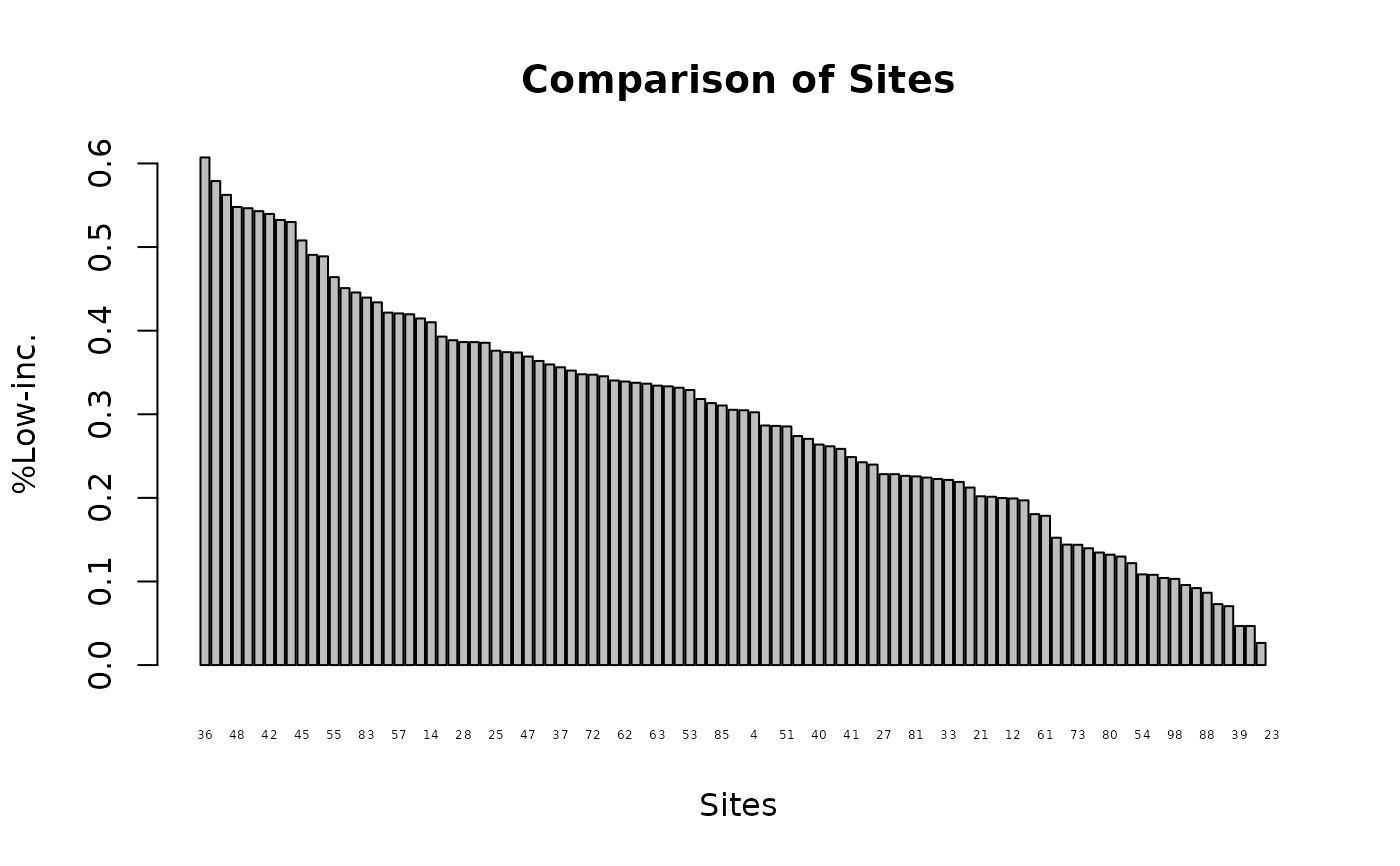
Barplot comparing sites on 1 indicator, based on full output of ejamit() easy high-level function for getting a quick look at top few sites
Source:R/ejam2barplot_sites.R
ejam2barplot_sites.RdBarplot comparing sites on 1 indicator, based on full output of ejamit() easy high-level function for getting a quick look at top few sites
Usage
ejam2barplot_sites(
  ejamitout,
  varname = "pctlowinc",
  names.arg = NULL,
  main = "Comparison of Sites",
  xlab = "Sites",
  ylab = NULL,
  sortby = NULL,
  topn = 5,
  ...
)
Arguments
- ejamitout
list like output of ejamit(), where one element is table of sites, one row per site, column names at least varname (and "ejam_uniq_id" if names.arg not specified)
- varname
name of a column in results_bysite, bar height
- names.arg
optional vector of labels on the bars, like short site names or IDs
- main
optional, for barplot
- xlab
optional, for barplot
- ylab
optional, for barplot, plain English version of varname, indicator that is bar height
- sortby
set to FALSE if you want to have no sorting, or to an increasing vector that provides the sort order
- topn
optional, show only the top n sites – Does not show all sites by default – only shows top n sites.
- ...
passed to barplot()
Value
same as barplot()
Examples
# Quickly compare top few sites by population count nearby
out <- copy(testoutput_ejamit_10pts_1miles)
#> Error in copy(testoutput_ejamit_10pts_1miles): could not find function "copy"
ejam2barplot_sites(out, "pop")
#> Error: object 'out' not found

# Show all 10,
ejam2barplot_sites(out, "traffic.score", topn = 10, cex.names = 0.8)
#> Error: object 'out' not found

# Sort by site id
ejam2barplot_sites(out, "blockcount_near_site", topn = 10,
  sortby = -1 * out$results_bysite$ejam_uniq_id)
#> Error: object 'out' not found

# Plot a calculated variable
sites <- copy(out$results_bysite)
#> Error in copy(out$results_bysite): could not find function "copy"
sites$log_traffic = log10(sites$traffic.score)
#> Error: object 'sites' not found
plot_barplot_sites(sites, "log_traffic", ylab = "Traffic Score (log10 scale)", topn = 10)
#> Error: object 'sites' not found

# On a large monitor, 100 sites with legible labels if the window is wide enough
ejam2barplot_sites(testoutput_ejamit_100pts_1miles, topn = 100, cex.names = 0.4)