Get an EJ analysis (residential population and environmental indicators) in or near a list of locations
Source:R/ejamit.R
ejamit.RdThis is the main function in EJAM that runs the analysis. It does essentially what the web app does, to analyze/summarize near a set of points, or in a set of polygons from a shapefile, or in a list of Census Units like Counties.
Usage
ejamit(
sitepoints = NULL,
radius = 3,
radius_donut_lower_edge = 0,
maxradius = 31.07,
avoidorphans = FALSE,
quadtree = NULL,
fips = NULL,
shapefile = NULL,
countcols = NULL,
wtdmeancols = NULL,
calculatedcols = NULL,
calctype_maxbg = NULL,
calctype_minbg = NULL,
subgroups_type = "nh",
include_ejindexes = TRUE,
calculate_ratios = TRUE,
extra_demog = TRUE,
need_proximityscore = FALSE,
infer_sitepoints = FALSE,
need_blockwt = TRUE,
thresholds = list(80, 80),
threshnames = list(c(names_ej_pctile, names_ej_state_pctile), c(names_ej_supp_pctile,
names_ej_supp_state_pctile)),
threshgroups = list("EJ-US-or-ST", "Supp-US-or-ST"),
updateProgress = NULL,
updateProgress_getblocks = NULL,
progress_all = NULL,
in_shiny = FALSE,
quiet = TRUE,
silentinteractive = FALSE,
called_by_ejamit = TRUE,
testing = FALSE,
showdrinkingwater = TRUE,
showpctowned = TRUE,
download_fips_bounds_to_calc_areas = FALSE,
...
)Arguments
- sitepoints
data.table with columns lat, lon giving point locations of sites or facilities around which are circular buffers
- radius
in miles, defining circular buffer around a site point
- radius_donut_lower_edge
radius of lower edge of donut ring if analyzing a ring not circle
- maxradius
miles distance (max distance to check if not even 1 block point is within radius)
- avoidorphans
logical If TRUE, then where not even 1 BLOCK internal point is within radius of a SITE, it keeps looking past radius, up to maxradius, to find nearest 1 BLOCK. What EJScreen does in that case is report NA, right? So, does EJAM really need to report stats on residents presumed to be within radius, if no block centroid is within radius? Best estimate might be to report indicators from nearest block centroid which is probably almost always the one your site is sitting inside of, but ideally would adjust total count to be a fraction of blockwt based on what is area of circular buffer as fraction of area of block it is apparently inside of. Setting this to TRUE can produce unexpected results, which will not match EJScreen numbers. Note that if creating a proximity score, by contrast, you instead want to find nearest 1 SITE if none within radius of this BLOCK.
- quadtree
(a pointer to the large quadtree object) created using
indexblocks()which uses the SearchTree package. Takes about 2-5 seconds to create this each time it is needed. It can be automatically created when the package is attached via the .onAttach() function- fips
optional FIPS code vector to provide if using FIPS instead of sitepoints to specify places to analyze, such as a list of US Counties or tracts. Passed to
getblocksnearby_from_fips()- shapefile
optional. A sf shapefile object or path to .zip, .gdb, .json, .kml, etc., or folder that has a shapefiles, to analyze polygons. e.g.,
out = ejamit(shapefile = testdata("portland.json", quiet = T), radius = 0)If in RStudio you want it to interactively prompt you to pick a file, use shapefile=1 (otherwise it assumes you want to pick a latlon file).- countcols
character vector of names of variables to aggregate within a buffer using a sum of counts, like, for example, the number of people for whom a poverty ratio is known, the count of which is the exact denominator needed to correctly calculate percent low income.
- wtdmeancols
character vector of names of variables to aggregate within a buffer using population-weighted or other-weighted mean.
- calculatedcols
character vector of names of variables to aggregate within a buffer using formulas that have to be specified.
- calctype_maxbg
character vector of names of variables to aggregate within a buffer using max() of all blockgroup-level values.
- calctype_minbg
character vector of names of variables to aggregate within a buffer using min() of all blockgroup-level values.
- subgroups_type
Optional (uses default). Set this to "nh" for non-hispanic race subgroups as in Non-Hispanic White Alone, nhwa and others in names_d_subgroups_nh; "alone" for race subgroups like White Alone, wa and others in names_d_subgroups_alone; "both" for both versions. Possibly another option is "original" or "default" Alone means single race.
- include_ejindexes
whether to try to include Summary Indexes (assuming dataset is available) - passed to
doaggregate()- calculate_ratios
whether to calculate and return ratio of each indicator to US and State overall averages - passed to
doaggregate()- extra_demog
if should include more indicators from v2.2 report on language etc.
- need_proximityscore
whether to calculate proximity scores
- infer_sitepoints
set to TRUE to try to infer the lat,lon of each site around which the blocks in sites2blocks were found. lat,lon of each site will be approximated as average of nearby blocks, although a more accurate slower way would be to use reported distance of each of 3 of the furthest block points and triangulate
- need_blockwt
if fips parameter is used, passed to
getblocksnearby_from_fips()- thresholds
list of percentiles like list(80,90) passed to batch.summarize(), to be counted to report how many of each set of indicators exceed thresholds at each site. (see default)
- threshnames
list of groups of variable names (see default)
- threshgroups
list of text names of the groups (see default)
- updateProgress
progress bar function passed to
doaggregate()in shiny app- updateProgress_getblocks
progress bar function passed to
getblocksnearby()in shiny app- progress_all
progress bar from app in R shiny to run
- in_shiny
if fips parameter is used, passed to
getblocksnearby_from_fips()- quiet
Optional. passed to getblocksnearby() and batch.summarize(). set to TRUE to avoid message about using
getblocks_diagnostics(), which is relevant only if a user saved the output of this function.- silentinteractive
to prevent long output showing in console in RStudio when in interactive mode, passed to
doaggregate()also. app server sets this to TRUE when calling doaggregate() butejamit()default is to set this to FALSE when callingdoaggregate().- called_by_ejamit
Set to TRUE by
ejamit()to suppress some outputs even if ejamit(silentinteractive=F)- testing
used while testing this function, passed to doaggregate()
- showdrinkingwater
T/F whether to include drinking water indicator values or display as NA. Defaults to TRUE.
- showpctowned
T/f whether to include percent owner-occupied units indicator values or display as NA. Defaults to TRUE.
- download_fips_bounds_to_calc_areas
if set to TRUE, it is slower because it downloads bounds of each unit to calculate area in square miles
- ...
passed to
getblocksnearby()etc. such as report_progress_every_n = 0
Value
This returns a named list of results.
# To see the structure of the outputs of ejamit()
structure.of.output.list(testoutput_ejamit_10pts_1miles)
dim(testoutput_ejamit_10pts_1miles$results_summarized$keystats)
dim(testoutput_ejamit_10pts_1miles$results_summarized$rows)
dim(testoutput_ejamit_10pts_1miles$results_summarized$cols)
dim(testoutput_ejamit_10pts_1miles$results_summarized$keyindicators)results_overall a data.table with one row that provides the summary across all sites, the aggregated results for all unique residents.
results_bysite results for individual sites (buffers) - a data.table of results, one row per ejam_uniq_id (i.e., each site analyzed), one column per indicator
results_bybg_people results for each block group, to allow for showing the distribution of each indicator across everyone, including the distribution within a single residential population group, for example. This table is essential for analyzing the distribution of an indicator across all the unique residents analyzed. Not all columns from results_bysite are here, however. One row is one blockgroup that was either partly or entirely counted as being at (or in) any one or more of the analyzed sites, and the bgid can be linked to bgfips via the table blockgroupstats. All the indicators in that row are the totals or averages for the entire blockgroup, not just the portion that was counted as at/in the analyzed sites. The column bgwt records what fraction of the blockgroup was counted as being at/in the analyzed sites as a whole, which may reflect more than one blockgroup since it may be near two analyzed sites, for example.
results_summarized See
batch.summarize()documenting what is here!longnames descriptive long names for the indicators in the above outputs
count_of_blocks_near_multiple_sites additional detail
sitetype indicates if analysis used latlon, fips, or shp
formatted another tall format showing averages for all indicators
sitetype the type of analysis done: "latlon", "shp", "fips", etc.
Examples
# See examples in vignettes/ articles
# All in one step, using functions not shiny app:
out <- ejamit(testpoints_100_dt, 2)
#> Finding blocks nearby.
#> Analyzing 100 points, radius of 2 miles around each.
#> Aggregating at each site and overall.
#> doaggregate is predicted to take 24 seconds
# \donttest{
# Do not specify sitepoints and it will prompt you for a file,
# if in RStudio in interactive mode!
out <- ejamit(radius = 3)
#> Error in select_valid_file(silentinteractive = silentinteractive): Must specify one of these: sitepoints, fips, or shapefile
# Specify facilities or sites as points for test data,
# use 1000 test facility points from the R package
testsites <- testpoints_1000
# use facility points in an excel or csv file
testsites <- latlon_from_anything(
system.file(paste0("testdata/latlon/",
"testpoints_10.xlsx"),
package = "EJAM")
)
# head(testsites)
# use facility points from a random sample of EPA-regulated facilities
testsites <- testpoints_n(1e3)
#> Loading arrow datasets: frs
#> ❌ Token is invalid or expired. Resetting...
#> Arrow-format datasets (blocks, etc.) are up-to-date -- locally-installed and latest-released data repository versions match.
#> looking for frs in memory...
#> frs is loading from local folder ...done.
#>
# Specify max distance from sites to look at (residents within X miles of site point)
radius <- 3.1 # miles
# Get summaries of all indicators near a set of points
out <- ejamit(testsites, radius)
#> Finding blocks nearby.
#> Analyzing 1000 points, radius of 3.1 miles around each.
#> Aggregating at each site and overall.
#> doaggregate is predicted to take 26 seconds
#> In zone = PR for drinking indicator, the lookup table lacks percentile information, so those percentiles will be reported as NA
# out <- ejamit("myfile.xlsx", 3.1)
# Shapefile examples
out2 = ejamit(shapefile = testshapes_2, radius = 0)
#> Finding blocks whose internal points are inside each polygon.
#> Aggregating at each polygon and overall.
out3 = ejamit(shapefile = testdata("portland.json", quiet = T), radius = 0)
#> Reading layer `portland' from data source
#> `/home/runner/work/_temp/Library/EJAM/testdata/shapes/portland.json'
#> using driver `GeoJSON'
#> Simple feature collection with 98 features and 11 fields
#> Geometry type: MULTIPOLYGON
#> Dimension: XY
#> Bounding box: xmin: -122.8677 ymin: 45.43254 xmax: -122.4666 ymax: 45.65302
#> Geodetic CRS: NAD83
#> Warning: ejam_uniq_id columns was already in shp, but replacing it now!
#> Finding blocks whose internal points are inside each polygon.
#> Aggregating at each polygon and overall.
# FIPS examples
out4 = ejamit(fips = testinput_fips_cities)
#> Finding blocks in each FIPS Census unit.
#> note that fips for cities/cdps are handled as shapefiles for analysis
#> Retrieving data for the year 2024
#>
|
| | 0%
|
|= | 1%
|
|= | 2%
|
|== | 2%
|
|== | 3%
|
|=== | 4%
|
|=== | 5%
|
|==== | 6%
|
|===== | 7%
|
|===== | 8%
|
|====== | 9%
|
|======= | 10%
|
|======== | 11%
|
|======== | 12%
|
|========= | 12%
|
|========= | 13%
|
|========= | 14%
|
|========== | 15%
|
|=========== | 15%
|
|=========== | 16%
|
|============= | 18%
|
|============== | 19%
|
|============== | 20%
|
|=============== | 21%
|
|================ | 23%
|
|=================== | 26%
|
|====================== | 31%
|
|========================= | 36%
|
|============================== | 43%
|
|================================ | 46%
|
|================================== | 49%
|
|==================================== | 52%
|
|====================================== | 55%
|
|========================================== | 60%
|
|=============================================== | 67%
|
|==================================================== | 74%
|
|========================================================= | 81%
|
|============================================================== | 88%
|
|================================================================== | 94%
|
|======================================================================| 100%
#> Aggregating at each FIPS Census unit and overall.
out5 = ejamit(fips = fips_counties_from_state_abbrev("DE"), radius = 0)
#> Finding blocks in each FIPS Census unit.
#> Joining with `by = join_by(blockid)`
#> Aggregating at each FIPS Census unit and overall.
# View results overall
round(t(out$results_overall), 3.1)
#> Error in round(t(out$results_overall), 3.1): non-numeric argument to mathematical function
# View plots
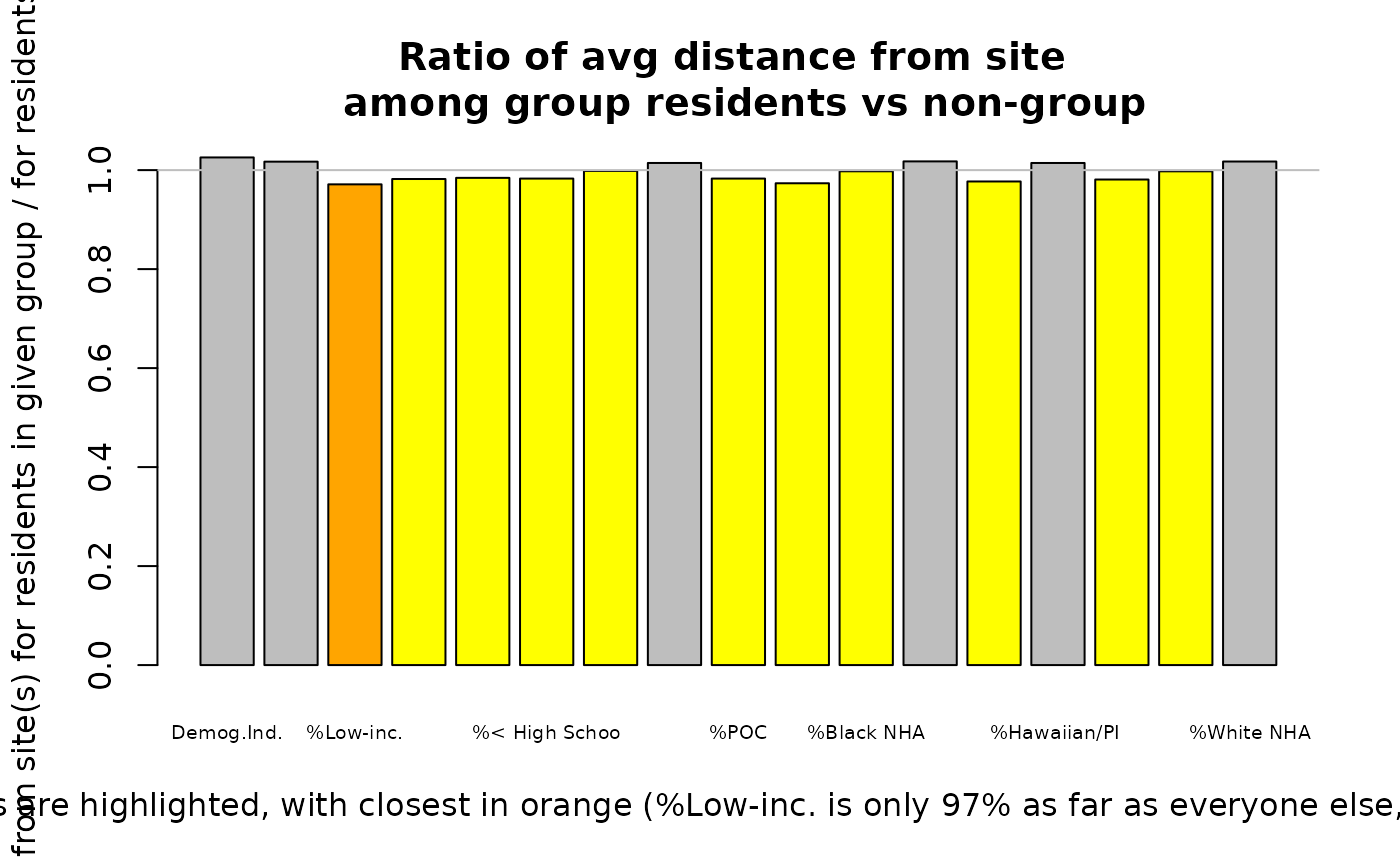
plot_distance_by_group(results_bybg_people = out$results_bybg_people)
 #> group nearest nearer ratio avg_distance_for_group
#> Demog.Ind. Demog.Index FALSE FALSE 1.026 2.04
#> Suppl Demog.Ind. Demog.Index.Supp FALSE FALSE 1.017 2.05
#> %Low-inc. pctlowinc TRUE TRUE 0.971 2.02
#> %Limited English pctlingiso FALSE TRUE 0.982 2.03
#> %Unemployed pctunemployed FALSE TRUE 0.984 2.04
#> %< High School pctlths FALSE TRUE 0.983 2.04
#> %< age 5 pctunder5 FALSE TRUE 0.998 2.06
#> %> age 64 pctover64 FALSE FALSE 1.014 2.09
#> %POC pctmin FALSE TRUE 0.983 2.05
#> %Hispanic pcthisp FALSE TRUE 0.973 2.03
#> %Black NHA pctnhba FALSE TRUE 0.998 2.06
#> %Asian NHA pctnhaa FALSE FALSE 1.018 2.10
#> %AmerIndian/AK NHA pctnhaiana FALSE TRUE 0.977 2.02
#> %Hawaiian/PI NHA pctnhnhpia FALSE FALSE 1.014 2.10
#> %Other race NHA pctnhotheralone FALSE TRUE 0.981 2.03
#> %multirace NH pctnhmulti FALSE TRUE 0.998 2.06
#> %White NHA pctnhwa FALSE FALSE 1.017 2.09
#> avg_distance_for_nongroup
#> Demog.Ind. 1.99
#> Suppl Demog.Ind. 2.01
#> %Low-inc. 2.08
#> %Limited English 2.07
#> %Unemployed 2.07
#> %< High School 2.07
#> %< age 5 2.07
#> %> age 64 2.06
#> %POC 2.09
#> %Hispanic 2.08
#> %Black NHA 2.07
#> %Asian NHA 2.06
#> %AmerIndian/AK NHA 2.07
#> %Hawaiian/PI NHA 2.07
#> %Other race NHA 2.07
#> %multirace NH 2.07
#> %White NHA 2.05
distance_by_group(out$results_bybg_people)
#> group nearest nearer ratio avg_distance_for_group
#> Demog.Ind. Demog.Index FALSE FALSE 1.026 2.04
#> Suppl Demog.Ind. Demog.Index.Supp FALSE FALSE 1.017 2.05
#> %Low-inc. pctlowinc TRUE TRUE 0.971 2.02
#> %Limited English pctlingiso FALSE TRUE 0.982 2.03
#> %Unemployed pctunemployed FALSE TRUE 0.984 2.04
#> %< High School pctlths FALSE TRUE 0.983 2.04
#> %< age 5 pctunder5 FALSE TRUE 0.998 2.06
#> %> age 64 pctover64 FALSE FALSE 1.014 2.09
#> %POC pctmin FALSE TRUE 0.983 2.05
#> %Hispanic pcthisp FALSE TRUE 0.973 2.03
#> %Black NHA pctnhba FALSE TRUE 0.998 2.06
#> %Asian NHA pctnhaa FALSE FALSE 1.018 2.10
#> %AmerIndian/AK NHA pctnhaiana FALSE TRUE 0.977 2.02
#> %Hawaiian/PI NHA pctnhnhpia FALSE FALSE 1.014 2.10
#> %Other race NHA pctnhotheralone FALSE TRUE 0.981 2.03
#> %multirace NH pctnhmulti FALSE TRUE 0.998 2.06
#> %White NHA pctnhwa FALSE FALSE 1.017 2.09
#> avg_distance_for_nongroup
#> Demog.Ind. 1.99
#> Suppl Demog.Ind. 2.01
#> %Low-inc. 2.08
#> %Limited English 2.07
#> %Unemployed 2.07
#> %< High School 2.07
#> %< age 5 2.07
#> %> age 64 2.06
#> %POC 2.09
#> %Hispanic 2.08
#> %Black NHA 2.07
#> %Asian NHA 2.06
#> %AmerIndian/AK NHA 2.07
#> %Hawaiian/PI NHA 2.07
#> %Other race NHA 2.07
#> %multirace NH 2.07
#> %White NHA 2.05
# View maps
mapfast(out$results_bysite, radius = 3.1)
#> group nearest nearer ratio avg_distance_for_group
#> Demog.Ind. Demog.Index FALSE FALSE 1.026 2.04
#> Suppl Demog.Ind. Demog.Index.Supp FALSE FALSE 1.017 2.05
#> %Low-inc. pctlowinc TRUE TRUE 0.971 2.02
#> %Limited English pctlingiso FALSE TRUE 0.982 2.03
#> %Unemployed pctunemployed FALSE TRUE 0.984 2.04
#> %< High School pctlths FALSE TRUE 0.983 2.04
#> %< age 5 pctunder5 FALSE TRUE 0.998 2.06
#> %> age 64 pctover64 FALSE FALSE 1.014 2.09
#> %POC pctmin FALSE TRUE 0.983 2.05
#> %Hispanic pcthisp FALSE TRUE 0.973 2.03
#> %Black NHA pctnhba FALSE TRUE 0.998 2.06
#> %Asian NHA pctnhaa FALSE FALSE 1.018 2.10
#> %AmerIndian/AK NHA pctnhaiana FALSE TRUE 0.977 2.02
#> %Hawaiian/PI NHA pctnhnhpia FALSE FALSE 1.014 2.10
#> %Other race NHA pctnhotheralone FALSE TRUE 0.981 2.03
#> %multirace NH pctnhmulti FALSE TRUE 0.998 2.06
#> %White NHA pctnhwa FALSE FALSE 1.017 2.09
#> avg_distance_for_nongroup
#> Demog.Ind. 1.99
#> Suppl Demog.Ind. 2.01
#> %Low-inc. 2.08
#> %Limited English 2.07
#> %Unemployed 2.07
#> %< High School 2.07
#> %< age 5 2.07
#> %> age 64 2.06
#> %POC 2.09
#> %Hispanic 2.08
#> %Black NHA 2.07
#> %Asian NHA 2.06
#> %AmerIndian/AK NHA 2.07
#> %Hawaiian/PI NHA 2.07
#> %Other race NHA 2.07
#> %multirace NH 2.07
#> %White NHA 2.05
distance_by_group(out$results_bybg_people)
#> group nearest nearer ratio avg_distance_for_group
#> Demog.Ind. Demog.Index FALSE FALSE 1.026 2.04
#> Suppl Demog.Ind. Demog.Index.Supp FALSE FALSE 1.017 2.05
#> %Low-inc. pctlowinc TRUE TRUE 0.971 2.02
#> %Limited English pctlingiso FALSE TRUE 0.982 2.03
#> %Unemployed pctunemployed FALSE TRUE 0.984 2.04
#> %< High School pctlths FALSE TRUE 0.983 2.04
#> %< age 5 pctunder5 FALSE TRUE 0.998 2.06
#> %> age 64 pctover64 FALSE FALSE 1.014 2.09
#> %POC pctmin FALSE TRUE 0.983 2.05
#> %Hispanic pcthisp FALSE TRUE 0.973 2.03
#> %Black NHA pctnhba FALSE TRUE 0.998 2.06
#> %Asian NHA pctnhaa FALSE FALSE 1.018 2.10
#> %AmerIndian/AK NHA pctnhaiana FALSE TRUE 0.977 2.02
#> %Hawaiian/PI NHA pctnhnhpia FALSE FALSE 1.014 2.10
#> %Other race NHA pctnhotheralone FALSE TRUE 0.981 2.03
#> %multirace NH pctnhmulti FALSE TRUE 0.998 2.06
#> %White NHA pctnhwa FALSE FALSE 1.017 2.09
#> avg_distance_for_nongroup
#> Demog.Ind. 1.99
#> Suppl Demog.Ind. 2.01
#> %Low-inc. 2.08
#> %Limited English 2.07
#> %Unemployed 2.07
#> %< High School 2.07
#> %< age 5 2.07
#> %> age 64 2.06
#> %POC 2.09
#> %Hispanic 2.08
#> %Black NHA 2.07
#> %Asian NHA 2.06
#> %AmerIndian/AK NHA 2.07
#> %Hawaiian/PI NHA 2.07
#> %Other race NHA 2.07
#> %multirace NH 2.07
#> %White NHA 2.05
# View maps
mapfast(out$results_bysite, radius = 3.1)