Compare subsets (types) of places that are all from one list
Source:R/ejamit_compare_types_of_places.R
ejamit_compare_types_of_places.Rd*** DRAFT - May change but works as currently drafted. e.g., change output formats of results_bytype vs results_overall
Usage
ejamit_compare_types_of_places(
  sitepoints,
  typeofsite = NULL,
  shapefile = NULL,
  fips = NULL,
  silentinteractive = TRUE,
  ...
)Examples
out <- ejamit_compare_types_of_places(testpoints_10[1:4, ],
typeofsite = c("A", "B", "B", "C"))
#> Type 1 of 3 = A -- Analyzing 1 points, radius of 3 miles around each.
#> doaggregate is predicted to take 24 seconds
#> Finished 1 of 1 sites. Rate of 1,937 buffers per hour: 1 lat/long pairs took 2 seconds
#> Type 2 of 3 = B --
#> Note that ejam_uniq_id was already in sitepoints, and might not be 1:NROW(sitepoints), which might cause issues
#> Analyzing 2 points, radius of 3 miles around each.
#> doaggregate is predicted to take 24 seconds
#> Finished 3 of 3 sites. Rate of 1,922 buffers per hour: 3 lat/long pairs took 6 seconds
#> Type 3 of 3 = C --
#> Note that ejam_uniq_id was already in sitepoints, and might not be 1:NROW(sitepoints), which might cause issues
#> Analyzing 1 points, radius of 3 miles around each.
#> doaggregate is predicted to take 24 seconds
#> Finished 4 of 4 sites. Rate of 1,939 buffers per hour: 4 lat/long pairs took 7 seconds
#>
#>
#> type valid sitecount pctvalid pop pop_persite pctofallpop
#> 1 A 1 1 100 124566 124566 9
#> 2 B 2 2 100 1176931 588466 89
#> 3 C 1 1 100 19637 19637 1
#> pctofallsitecount
#> 1 25
#> 2 50
#> 3 25
#> ratio.to.state.avg.Demog.Index ratio.to.state.avg.Demog.Index.Supp
#> 1 0.9 0.8
#> 2 1.2 1.0
#> 3 0.7 0.9
#> ratio.to.state.avg.pctlowinc ratio.to.state.avg.pctlingiso
#> 1 0.5 1.2
#> 2 1.1 1.0
#> 3 0.8 0.7
#> ratio.to.state.avg.pctunemployed ratio.to.state.avg.pctlths
#> 1 0.6 0.7
#> 2 1.1 1.0
#> 3 1.0 1.0
#> ratio.to.state.avg.pctunder5 ratio.to.state.avg.pctover64
#> 1 0.9 1.1
#> 2 1.2 0.7
#> 3 1.2 0.8
#> ratio.to.state.avg.pctmin
#> 1 1.2
#> 2 1.2
#> 3 0.6
#> Use ejam2excel(out) to view results, and see the types of sites compared, one row each, in the Overall tab
#> Use ejam2barplot_sitegroups() to plot results.
#>
#>
#> 4 sites in 3 groups (types of sites).
#> Rate of 1,937 buffers per hour: 4 lat/long pairs took 7 seconds
cbind(Rows_or_length = sapply(out, NROW))
#> Rows_or_length
#> types 3
#> sitecount_bytype 3
#> results_bytype 3
#> results_overall 3
#> ejam_uniq_id 4
#> typeofsite 4
#> results_bysite 4
#> longnames 469
#> validstats 3
#> ratiostats 3
ejam2barplot_sitegroups(out, names_these_ratio_to_avg[1], topn = 3)
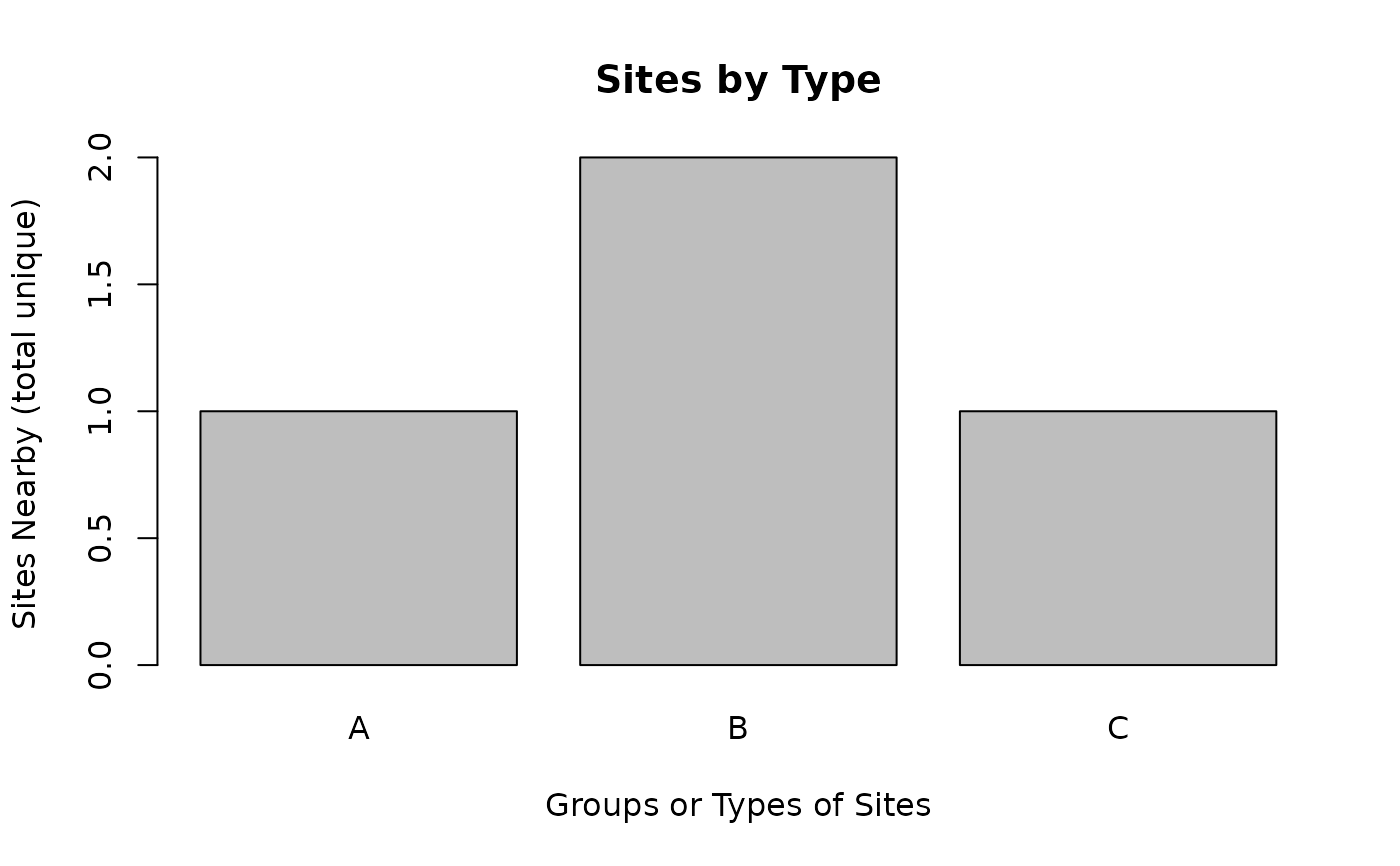
 ejam2barplot_sitegroups(out, "sitecount_unique", topn=3, sortby = F)
 ejam2barplot_sitegroups(out, "pop", topn = 3, sortby = F)
 # use calculated variable not in original table
df <- out$results_bytype
df$share <- df$pop / sum(df$pop)
df$pop_per_site <- df$pop / df$sitecount_unique
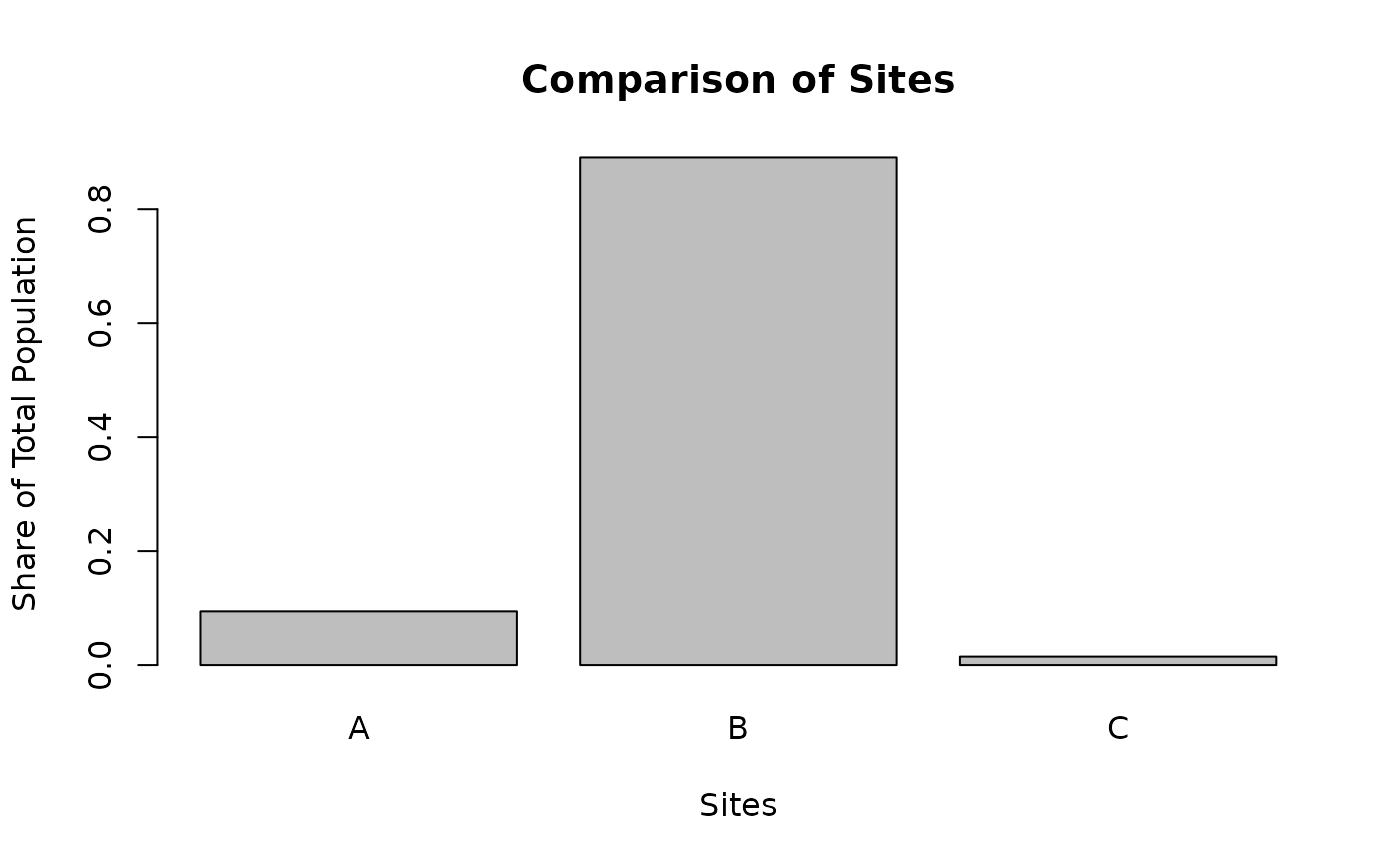
plot_barplot_sites(df,
"share", ylab = "Share of Total Population",
topn = 3, names.arg = out$types , sortby = F)
# use calculated variable not in original table
df <- out$results_bytype
df$share <- df$pop / sum(df$pop)
df$pop_per_site <- df$pop / df$sitecount_unique
plot_barplot_sites(df,
"share", ylab = "Share of Total Population",
topn = 3, names.arg = out$types , sortby = F)
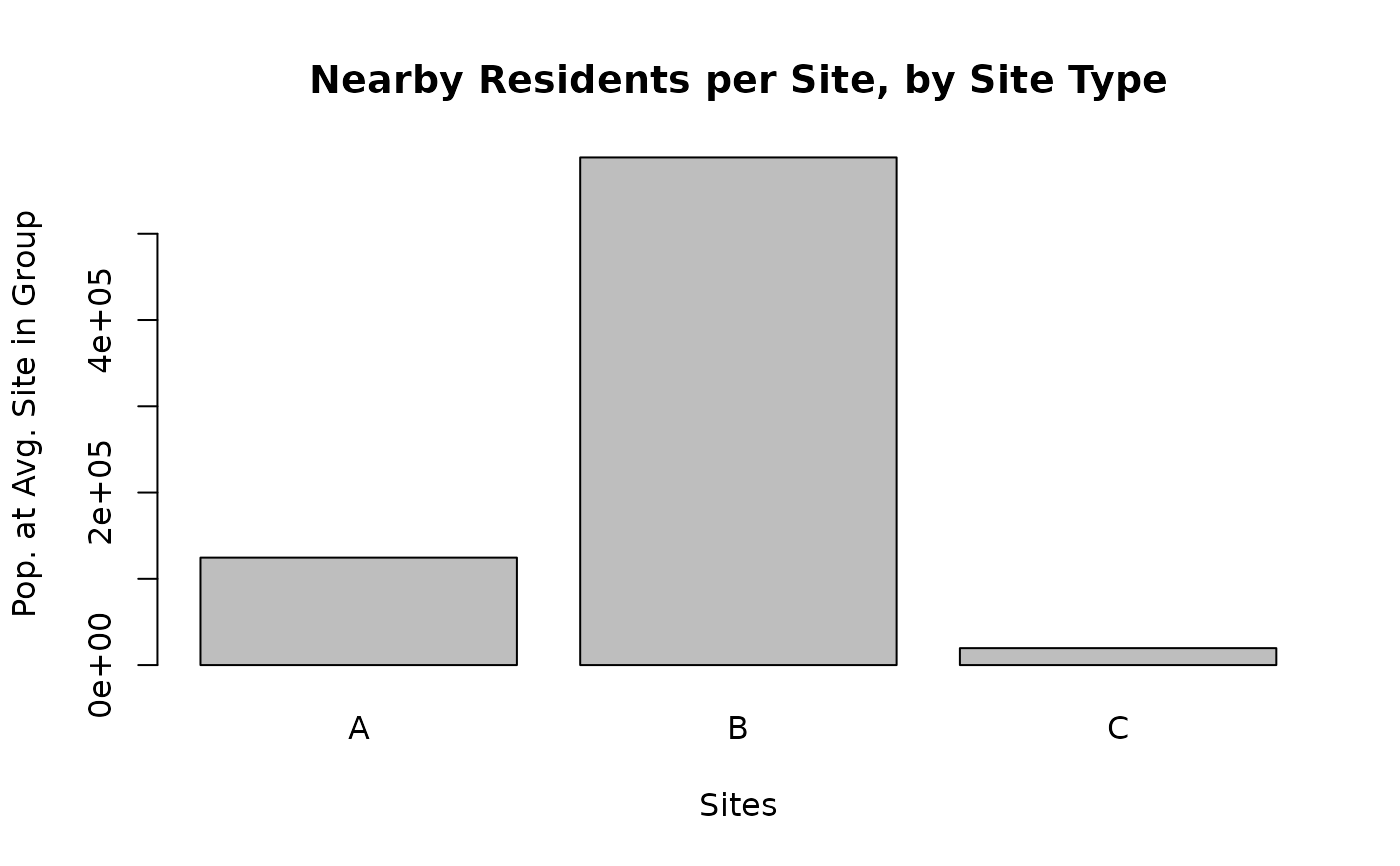
 plot_barplot_sites(df,
"pop_per_site", ylab = "Pop. at Avg. Site in Group",
topn = 3, main = "Nearby Residents per Site, by Site Type",
names.arg = out$types , sortby = F)
plot_barplot_sites(df,
"pop_per_site", ylab = "Pop. at Avg. Site in Group",
topn = 3, main = "Nearby Residents per Site, by Site Type",
names.arg = out$types , sortby = F)
 # \donttest{
# Analyze by EPA Region
pts <- data.frame(testpoints_1000)
# Get State and EPA Region of each point from lat/lon
x <- state_from_latlon(lat = pts$lat, lon = pts$lon)
pts <- data.frame(pts, x)
out_byregion <- ejamit_compare_types_of_places(
pts, typeofsite = pts$REGION)
#> Type 1 of 10 = 3 --
#> Note that ejam_uniq_id was already in sitepoints, and might not be 1:NROW(sitepoints), which might cause issues
#> Analyzing 56 points, radius of 3 miles around each.
#> doaggregate is predicted to take 24 seconds
#> Finished 56 of 56 sites. Rate of 64,182 buffers per hour: 56 lat/long pairs took 3 seconds
#> Type 2 of 10 = 9 --
#> Note that ejam_uniq_id was already in sitepoints, and might not be 1:NROW(sitepoints), which might cause issues
#> Analyzing 195 points, radius of 3 miles around each.
#> doaggregate is predicted to take 24 seconds
#> Finished 251 of 251 sites. Rate of 95,415 buffers per hour: 251 lat/long pairs took 9 seconds
#> Type 3 of 10 = 7 --
#> Note that ejam_uniq_id was already in sitepoints, and might not be 1:NROW(sitepoints), which might cause issues
#> Analyzing 67 points, radius of 3 miles around each.
#> doaggregate is predicted to take 24 seconds
#> Finished 318 of 318 sites. Rate of 98,521 buffers per hour: 318 lat/long pairs took 12 seconds
#> Type 4 of 10 = 4 --
#> Note that ejam_uniq_id was already in sitepoints, and might not be 1:NROW(sitepoints), which might cause issues
#> Analyzing 125 points, radius of 3 miles around each.
#> doaggregate is predicted to take 24 seconds
#> Finished 443 of 443 sites. Rate of 104,956 buffers per hour: 443 lat/long pairs took 15 seconds
#> Type 5 of 10 = 5 --
#> Note that ejam_uniq_id was already in sitepoints, and might not be 1:NROW(sitepoints), which might cause issues
#> Analyzing 156 points, radius of 3 miles around each.
#> doaggregate is predicted to take 24 seconds
#> Finished 599 of 599 sites. Rate of 109,714 buffers per hour: 599 lat/long pairs took 20 seconds
#> Type 6 of 10 = 2 --
#> Note that ejam_uniq_id was already in sitepoints, and might not be 1:NROW(sitepoints), which might cause issues
#> Analyzing 154 points, radius of 3 miles around each.
#> doaggregate is predicted to take 24 seconds
#> In zone = PR for drinking indicator, the lookup table lacks percentile information, so those percentiles will be reported as NA
#> Finished 753 of 753 sites. Rate of 108,294 buffers per hour: 753 lat/long pairs took 25 seconds
#> Type 7 of 10 = 1 --
#> Note that ejam_uniq_id was already in sitepoints, and might not be 1:NROW(sitepoints), which might cause issues
#> Analyzing 53 points, radius of 3 miles around each.
#> doaggregate is predicted to take 24 seconds
#> Finished 806 of 806 sites. Rate of 106,410 buffers per hour: 806 lat/long pairs took 27 seconds
#> Type 8 of 10 = 8 --
#> Note that ejam_uniq_id was already in sitepoints, and might not be 1:NROW(sitepoints), which might cause issues
#> Analyzing 48 points, radius of 3 miles around each.
#> doaggregate is predicted to take 24 seconds
#> Finished 854 of 854 sites. Rate of 100,560 buffers per hour: 854 lat/long pairs took 31 seconds
#> Type 9 of 10 = 6 --
#> Note that ejam_uniq_id was already in sitepoints, and might not be 1:NROW(sitepoints), which might cause issues
#> Analyzing 100 points, radius of 3 miles around each.
#> doaggregate is predicted to take 24 seconds
#> Finished 954 of 954 sites. Rate of 97,807 buffers per hour: 954 lat/long pairs took 35 seconds
#> Type 10 of 10 = 10 --
#> Note that ejam_uniq_id was already in sitepoints, and might not be 1:NROW(sitepoints), which might cause issues
#> Analyzing 46 points, radius of 3 miles around each.
#> doaggregate is predicted to take 24 seconds
#> Finished 1000 of 1000 sites. Rate of 96,577 buffers per hour: 1,000 lat/long pairs took 37 seconds
#>
#>
#> type valid sitecount pctvalid pop pop_persite pctofallpop
#> 1 3 56 56 100 2913936 52035 6
#> 2 9 195 195 100 16960745 86978 34
#> 3 7 67 67 100 1101208 16436 2
#> 4 4 125 125 100 3344207 26754 7
#> 5 5 156 156 100 5248470 33644 10
#> 6 2 154 154 100 9852536 63978 20
#> 7 1 53 53 100 2747347 51837 5
#> 8 8 45 48 94 1776904 37019 4
#> 9 6 98 100 98 4065964 40660 8
#> 10 10 46 46 100 2173060 47240 4
#> pctofallsitecount
#> 1 6
#> 2 20
#> 3 7
#> 4 12
#> 5 16
#> 6 15
#> 7 5
#> 8 5
#> 9 10
#> 10 5
#> ratio.to.state.avg.Demog.Index ratio.to.state.avg.Demog.Index.Supp
#> 1 1.2 1.1
#> 2 1.1 1.0
#> 3 1.2 1.0
#> 4 1.1 1.0
#> 5 1.2 1.0
#> 6 1.2 1.1
#> 7 1.3 1.1
#> 8 1.1 1.1
#> 9 1.1 1.0
#> 10 1.1 0.9
#> ratio.to.state.avg.pctlowinc ratio.to.state.avg.pctlingiso
#> 1 1.1 1.2
#> 2 1.1 1.2
#> 3 1.0 1.3
#> 4 1.0 1.1
#> 5 1.1 1.4
#> 6 1.1 1.2
#> 7 1.2 1.3
#> 8 1.0 1.3
#> 9 1.0 1.3
#> 10 0.9 1.4
#> ratio.to.state.avg.pctunemployed ratio.to.state.avg.pctlths
#> 1 1.1 1.0
#> 2 1.0 1.1
#> 3 1.0 0.9
#> 4 1.1 0.9
#> 5 1.1 1.1
#> 6 1.1 1.2
#> 7 1.1 1.1
#> 8 1.0 1.1
#> 9 1.0 1.1
#> 10 1.0 0.9
#> ratio.to.state.avg.pctunder5 ratio.to.state.avg.pctover64
#> 1 1.1 0.9
#> 2 1.0 0.9
#> 3 1.1 0.9
#> 4 1.1 0.8
#> 5 1.0 0.9
#> 6 1.1 0.9
#> 7 1.1 0.8
#> 8 1.0 0.9
#> 9 1.1 0.8
#> 10 1.0 0.8
#> ratio.to.state.avg.pctmin
#> 1 1.3
#> 2 1.1
#> 3 1.6
#> 4 1.2
#> 5 1.4
#> 6 1.3
#> 7 1.3
#> 8 1.2
#> 9 1.2
#> 10 1.3
#> Use ejam2excel(out) to view results, and see the types of sites compared, one row each, in the Overall tab
#> Use ejam2barplot_sitegroups() to plot results.
#>
#>
#> 1000 sites in 10 groups (types of sites).
#> Rate of 96,546 buffers per hour: 1,000 lat/long pairs took 37 seconds
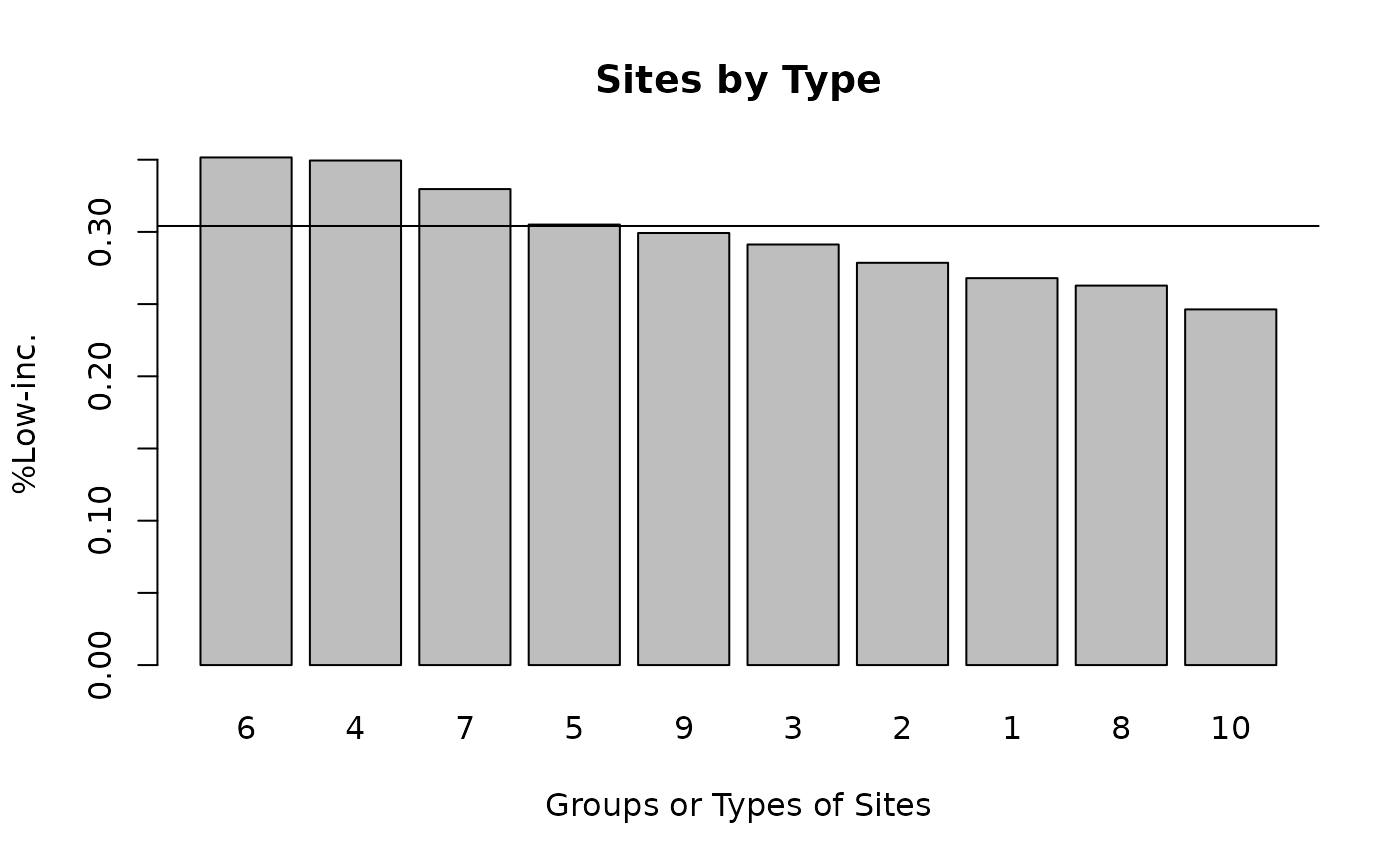
dvarname <- names_d[3]
ejam2barplot_sitegroups(out_byregion, dvarname)
abline(h = usastats_means(dvarname))
# \donttest{
# Analyze by EPA Region
pts <- data.frame(testpoints_1000)
# Get State and EPA Region of each point from lat/lon
x <- state_from_latlon(lat = pts$lat, lon = pts$lon)
pts <- data.frame(pts, x)
out_byregion <- ejamit_compare_types_of_places(
pts, typeofsite = pts$REGION)
#> Type 1 of 10 = 3 --
#> Note that ejam_uniq_id was already in sitepoints, and might not be 1:NROW(sitepoints), which might cause issues
#> Analyzing 56 points, radius of 3 miles around each.
#> doaggregate is predicted to take 24 seconds
#> Finished 56 of 56 sites. Rate of 64,182 buffers per hour: 56 lat/long pairs took 3 seconds
#> Type 2 of 10 = 9 --
#> Note that ejam_uniq_id was already in sitepoints, and might not be 1:NROW(sitepoints), which might cause issues
#> Analyzing 195 points, radius of 3 miles around each.
#> doaggregate is predicted to take 24 seconds
#> Finished 251 of 251 sites. Rate of 95,415 buffers per hour: 251 lat/long pairs took 9 seconds
#> Type 3 of 10 = 7 --
#> Note that ejam_uniq_id was already in sitepoints, and might not be 1:NROW(sitepoints), which might cause issues
#> Analyzing 67 points, radius of 3 miles around each.
#> doaggregate is predicted to take 24 seconds
#> Finished 318 of 318 sites. Rate of 98,521 buffers per hour: 318 lat/long pairs took 12 seconds
#> Type 4 of 10 = 4 --
#> Note that ejam_uniq_id was already in sitepoints, and might not be 1:NROW(sitepoints), which might cause issues
#> Analyzing 125 points, radius of 3 miles around each.
#> doaggregate is predicted to take 24 seconds
#> Finished 443 of 443 sites. Rate of 104,956 buffers per hour: 443 lat/long pairs took 15 seconds
#> Type 5 of 10 = 5 --
#> Note that ejam_uniq_id was already in sitepoints, and might not be 1:NROW(sitepoints), which might cause issues
#> Analyzing 156 points, radius of 3 miles around each.
#> doaggregate is predicted to take 24 seconds
#> Finished 599 of 599 sites. Rate of 109,714 buffers per hour: 599 lat/long pairs took 20 seconds
#> Type 6 of 10 = 2 --
#> Note that ejam_uniq_id was already in sitepoints, and might not be 1:NROW(sitepoints), which might cause issues
#> Analyzing 154 points, radius of 3 miles around each.
#> doaggregate is predicted to take 24 seconds
#> In zone = PR for drinking indicator, the lookup table lacks percentile information, so those percentiles will be reported as NA
#> Finished 753 of 753 sites. Rate of 108,294 buffers per hour: 753 lat/long pairs took 25 seconds
#> Type 7 of 10 = 1 --
#> Note that ejam_uniq_id was already in sitepoints, and might not be 1:NROW(sitepoints), which might cause issues
#> Analyzing 53 points, radius of 3 miles around each.
#> doaggregate is predicted to take 24 seconds
#> Finished 806 of 806 sites. Rate of 106,410 buffers per hour: 806 lat/long pairs took 27 seconds
#> Type 8 of 10 = 8 --
#> Note that ejam_uniq_id was already in sitepoints, and might not be 1:NROW(sitepoints), which might cause issues
#> Analyzing 48 points, radius of 3 miles around each.
#> doaggregate is predicted to take 24 seconds
#> Finished 854 of 854 sites. Rate of 100,560 buffers per hour: 854 lat/long pairs took 31 seconds
#> Type 9 of 10 = 6 --
#> Note that ejam_uniq_id was already in sitepoints, and might not be 1:NROW(sitepoints), which might cause issues
#> Analyzing 100 points, radius of 3 miles around each.
#> doaggregate is predicted to take 24 seconds
#> Finished 954 of 954 sites. Rate of 97,807 buffers per hour: 954 lat/long pairs took 35 seconds
#> Type 10 of 10 = 10 --
#> Note that ejam_uniq_id was already in sitepoints, and might not be 1:NROW(sitepoints), which might cause issues
#> Analyzing 46 points, radius of 3 miles around each.
#> doaggregate is predicted to take 24 seconds
#> Finished 1000 of 1000 sites. Rate of 96,577 buffers per hour: 1,000 lat/long pairs took 37 seconds
#>
#>
#> type valid sitecount pctvalid pop pop_persite pctofallpop
#> 1 3 56 56 100 2913936 52035 6
#> 2 9 195 195 100 16960745 86978 34
#> 3 7 67 67 100 1101208 16436 2
#> 4 4 125 125 100 3344207 26754 7
#> 5 5 156 156 100 5248470 33644 10
#> 6 2 154 154 100 9852536 63978 20
#> 7 1 53 53 100 2747347 51837 5
#> 8 8 45 48 94 1776904 37019 4
#> 9 6 98 100 98 4065964 40660 8
#> 10 10 46 46 100 2173060 47240 4
#> pctofallsitecount
#> 1 6
#> 2 20
#> 3 7
#> 4 12
#> 5 16
#> 6 15
#> 7 5
#> 8 5
#> 9 10
#> 10 5
#> ratio.to.state.avg.Demog.Index ratio.to.state.avg.Demog.Index.Supp
#> 1 1.2 1.1
#> 2 1.1 1.0
#> 3 1.2 1.0
#> 4 1.1 1.0
#> 5 1.2 1.0
#> 6 1.2 1.1
#> 7 1.3 1.1
#> 8 1.1 1.1
#> 9 1.1 1.0
#> 10 1.1 0.9
#> ratio.to.state.avg.pctlowinc ratio.to.state.avg.pctlingiso
#> 1 1.1 1.2
#> 2 1.1 1.2
#> 3 1.0 1.3
#> 4 1.0 1.1
#> 5 1.1 1.4
#> 6 1.1 1.2
#> 7 1.2 1.3
#> 8 1.0 1.3
#> 9 1.0 1.3
#> 10 0.9 1.4
#> ratio.to.state.avg.pctunemployed ratio.to.state.avg.pctlths
#> 1 1.1 1.0
#> 2 1.0 1.1
#> 3 1.0 0.9
#> 4 1.1 0.9
#> 5 1.1 1.1
#> 6 1.1 1.2
#> 7 1.1 1.1
#> 8 1.0 1.1
#> 9 1.0 1.1
#> 10 1.0 0.9
#> ratio.to.state.avg.pctunder5 ratio.to.state.avg.pctover64
#> 1 1.1 0.9
#> 2 1.0 0.9
#> 3 1.1 0.9
#> 4 1.1 0.8
#> 5 1.0 0.9
#> 6 1.1 0.9
#> 7 1.1 0.8
#> 8 1.0 0.9
#> 9 1.1 0.8
#> 10 1.0 0.8
#> ratio.to.state.avg.pctmin
#> 1 1.3
#> 2 1.1
#> 3 1.6
#> 4 1.2
#> 5 1.4
#> 6 1.3
#> 7 1.3
#> 8 1.2
#> 9 1.2
#> 10 1.3
#> Use ejam2excel(out) to view results, and see the types of sites compared, one row each, in the Overall tab
#> Use ejam2barplot_sitegroups() to plot results.
#>
#>
#> 1000 sites in 10 groups (types of sites).
#> Rate of 96,546 buffers per hour: 1,000 lat/long pairs took 37 seconds
dvarname <- names_d[3]
ejam2barplot_sitegroups(out_byregion, dvarname)
abline(h = usastats_means(dvarname))
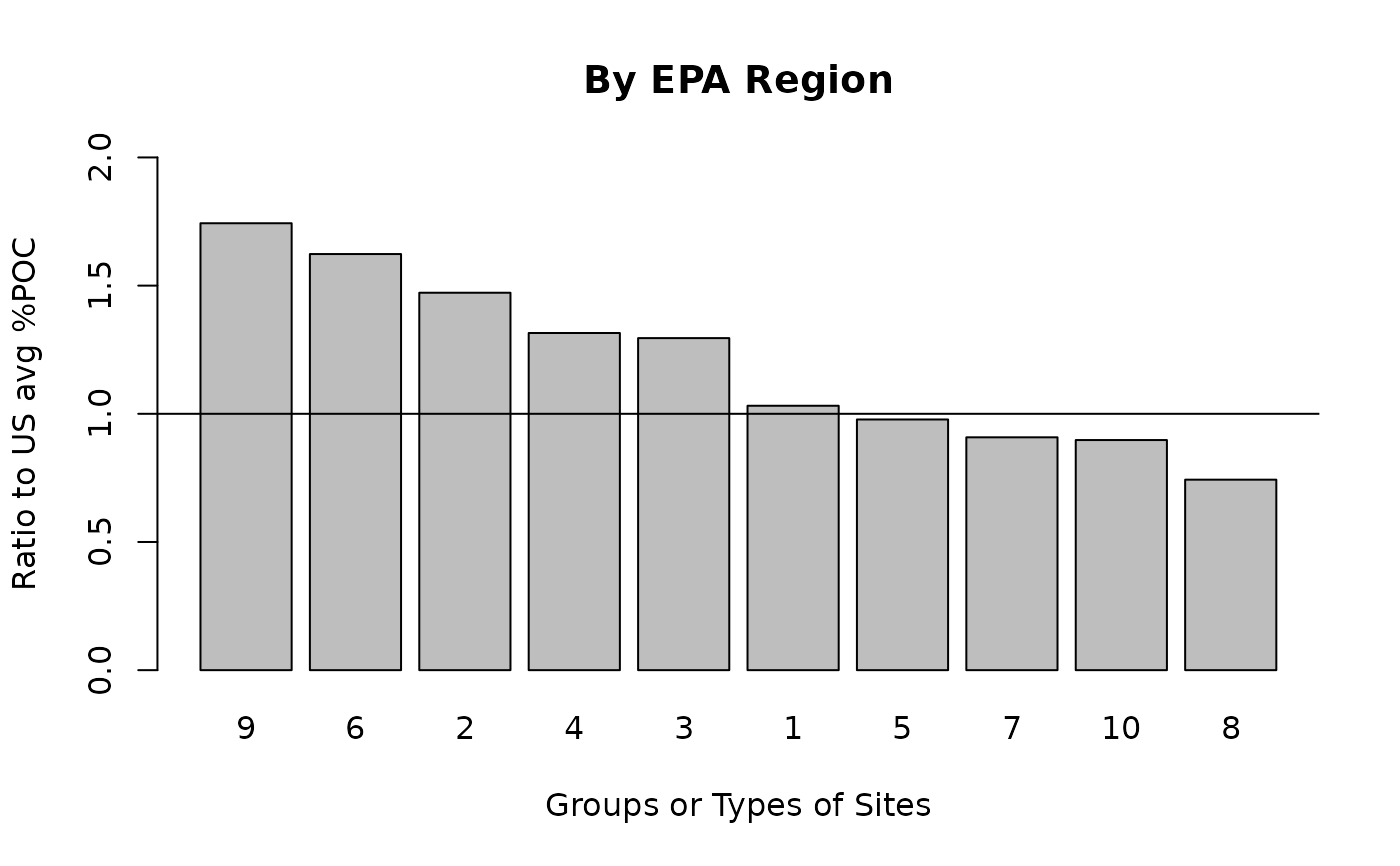
 ejam2barplot_sitegroups(out_byregion, "ratio.to.avg.pctmin",
main = "By EPA Region", ylim = c(0, 2))
abline(h = 1)
ejam2barplot_sitegroups(out_byregion, "ratio.to.avg.pctmin",
main = "By EPA Region", ylim = c(0, 2))
abline(h = 1)
 # Analyze by State (slow)
out_bystate <- ejamit_compare_types_of_places(pts, typeofsite = pts$ST)
#> Type 1 of 51 = PA --
#> Note that ejam_uniq_id was already in sitepoints, and might not be 1:NROW(sitepoints), which might cause issues
#> Analyzing 21 points, radius of 3 miles around each.
#> doaggregate is predicted to take 24 seconds
#> Finished 21 of 21 sites. Rate of 29,883 buffers per hour: 21 lat/long pairs took 3 seconds
#> Type 2 of 51 = CA --
#> Note that ejam_uniq_id was already in sitepoints, and might not be 1:NROW(sitepoints), which might cause issues
#> Analyzing 170 points, radius of 3 miles around each.
#> doaggregate is predicted to take 24 seconds
#> Finished 191 of 191 sites. Rate of 95,319 buffers per hour: 191 lat/long pairs took 7 seconds
#> Type 3 of 51 = IA --
#> Note that ejam_uniq_id was already in sitepoints, and might not be 1:NROW(sitepoints), which might cause issues
#> Analyzing 21 points, radius of 3 miles around each.
#> doaggregate is predicted to take 24 seconds
#> Finished 212 of 212 sites. Rate of 71,485 buffers per hour: 212 lat/long pairs took 11 seconds
#> Type 4 of 51 = NC --
#> Note that ejam_uniq_id was already in sitepoints, and might not be 1:NROW(sitepoints), which might cause issues
#> Analyzing 18 points, radius of 3 miles around each.
#> doaggregate is predicted to take 24 seconds
#> Finished 230 of 230 sites. Rate of 63,366 buffers per hour: 230 lat/long pairs took 13 seconds
#> Type 5 of 51 = IL --
#> Note that ejam_uniq_id was already in sitepoints, and might not be 1:NROW(sitepoints), which might cause issues
#> Analyzing 30 points, radius of 3 miles around each.
#> doaggregate is predicted to take 24 seconds
#> Finished 260 of 260 sites. Rate of 59,693 buffers per hour: 260 lat/long pairs took 16 seconds
#> Type 6 of 51 = AZ --
#> Note that ejam_uniq_id was already in sitepoints, and might not be 1:NROW(sitepoints), which might cause issues
#> Analyzing 14 points, radius of 3 miles around each.
#> doaggregate is predicted to take 24 seconds
#> Finished 274 of 274 sites. Rate of 54,404 buffers per hour: 274 lat/long pairs took 18 seconds
#> Type 7 of 51 = MS --
#> Note that ejam_uniq_id was already in sitepoints, and might not be 1:NROW(sitepoints), which might cause issues
#> Analyzing 11 points, radius of 3 miles around each.
#> doaggregate is predicted to take 24 seconds
#> Finished 285 of 285 sites. Rate of 49,782 buffers per hour: 285 lat/long pairs took 21 seconds
#> Type 8 of 51 = NY --
#> Note that ejam_uniq_id was already in sitepoints, and might not be 1:NROW(sitepoints), which might cause issues
#> Analyzing 57 points, radius of 3 miles around each.
#> doaggregate is predicted to take 24 seconds
#> Finished 342 of 342 sites. Rate of 52,471 buffers per hour: 342 lat/long pairs took 23 seconds
#> Type 9 of 51 = NJ --
#> Note that ejam_uniq_id was already in sitepoints, and might not be 1:NROW(sitepoints), which might cause issues
#> Analyzing 93 points, radius of 3 miles around each.
#> doaggregate is predicted to take 24 seconds
#> Finished 435 of 435 sites. Rate of 58,561 buffers per hour: 435 lat/long pairs took 27 seconds
#> Type 10 of 51 = VA --
#> Note that ejam_uniq_id was already in sitepoints, and might not be 1:NROW(sitepoints), which might cause issues
#> Analyzing 11 points, radius of 3 miles around each.
#> doaggregate is predicted to take 24 seconds
#> Finished 446 of 446 sites. Rate of 53,149 buffers per hour: 446 lat/long pairs took 30 seconds
#> Type 11 of 51 = CT --
#> Note that ejam_uniq_id was already in sitepoints, and might not be 1:NROW(sitepoints), which might cause issues
#> Analyzing 15 points, radius of 3 miles around each.
#> doaggregate is predicted to take 24 seconds
#> Finished 461 of 461 sites. Rate of 50,771 buffers per hour: 461 lat/long pairs took 33 seconds
#> Type 12 of 51 = MN --
#> Note that ejam_uniq_id was already in sitepoints, and might not be 1:NROW(sitepoints), which might cause issues
#> Analyzing 44 points, radius of 3 miles around each.
#> doaggregate is predicted to take 24 seconds
#> Finished 505 of 505 sites. Rate of 51,550 buffers per hour: 505 lat/long pairs took 35 seconds
#> Type 13 of 51 = NE --
#> Note that ejam_uniq_id was already in sitepoints, and might not be 1:NROW(sitepoints), which might cause issues
#> Analyzing 14 points, radius of 3 miles around each.
#> doaggregate is predicted to take 24 seconds
#> Finished 519 of 519 sites. Rate of 47,549 buffers per hour: 519 lat/long pairs took 39 seconds
#> Type 14 of 51 = IN --
#> Note that ejam_uniq_id was already in sitepoints, and might not be 1:NROW(sitepoints), which might cause issues
#> Analyzing 26 points, radius of 3 miles around each.
#> doaggregate is predicted to take 24 seconds
#> Finished 545 of 545 sites. Rate of 47,579 buffers per hour: 545 lat/long pairs took 41 seconds
#> Type 15 of 51 = CO --
#> Note that ejam_uniq_id was already in sitepoints, and might not be 1:NROW(sitepoints), which might cause issues
#> Analyzing 9 points, radius of 3 miles around each.
#> doaggregate is predicted to take 24 seconds
#> Finished 554 of 554 sites. Rate of 45,667 buffers per hour: 554 lat/long pairs took 44 seconds
#> Type 16 of 51 = MA --
#> Note that ejam_uniq_id was already in sitepoints, and might not be 1:NROW(sitepoints), which might cause issues
#> Analyzing 26 points, radius of 3 miles around each.
#> doaggregate is predicted to take 24 seconds
#> Finished 580 of 580 sites. Rate of 45,116 buffers per hour: 580 lat/long pairs took 46 seconds
#> Type 17 of 51 = OH --
#> Note that ejam_uniq_id was already in sitepoints, and might not be 1:NROW(sitepoints), which might cause issues
#> Analyzing 26 points, radius of 3 miles around each.
#> doaggregate is predicted to take 24 seconds
#> Finished 606 of 606 sites. Rate of 43,750 buffers per hour: 606 lat/long pairs took 50 seconds
#> Type 18 of 51 = TX --
#> Note that ejam_uniq_id was already in sitepoints, and might not be 1:NROW(sitepoints), which might cause issues
#> Analyzing 71 points, radius of 3 miles around each.
#> doaggregate is predicted to take 24 seconds
#> Finished 677 of 677 sites. Rate of 46,757 buffers per hour: 677 lat/long pairs took 52 seconds
#> Type 19 of 51 = KS --
#> Note that ejam_uniq_id was already in sitepoints, and might not be 1:NROW(sitepoints), which might cause issues
#> Analyzing 16 points, radius of 3 miles around each.
#> doaggregate is predicted to take 24 seconds
#> Finished 693 of 693 sites. Rate of 46,639 buffers per hour: 693 lat/long pairs took 53 seconds
#> Type 20 of 51 = MT --
#> Note that ejam_uniq_id was already in sitepoints, and might not be 1:NROW(sitepoints), which might cause issues
#> Analyzing 10 points, radius of 3 miles around each.
#> doaggregate is predicted to take 24 seconds
#> Finished 703 of 703 sites. Rate of 45,749 buffers per hour: 703 lat/long pairs took 55 seconds
#> Type 21 of 51 = UT --
#> Note that ejam_uniq_id was already in sitepoints, and might not be 1:NROW(sitepoints), which might cause issues
#> Analyzing 18 points, radius of 3 miles around each.
#> doaggregate is predicted to take 24 seconds
#> Finished 721 of 721 sites. Rate of 44,943 buffers per hour: 721 lat/long pairs took 58 seconds
#> Type 22 of 51 = MI --
#> Note that ejam_uniq_id was already in sitepoints, and might not be 1:NROW(sitepoints), which might cause issues
#> Analyzing 16 points, radius of 3 miles around each.
#> doaggregate is predicted to take 24 seconds
#> Finished 737 of 737 sites. Rate of 43,984 buffers per hour: 737 lat/long pairs took 60 seconds
#> Type 23 of 51 = DE --
#> Note that ejam_uniq_id was already in sitepoints, and might not be 1:NROW(sitepoints), which might cause issues
#> Analyzing 5 points, radius of 3 miles around each.
#> doaggregate is predicted to take 24 seconds
#> Finished 742 of 742 sites. Rate of 42,565 buffers per hour: 742 lat/long pairs took 63 seconds
#> Type 24 of 51 = LA --
#> Note that ejam_uniq_id was already in sitepoints, and might not be 1:NROW(sitepoints), which might cause issues
#> Analyzing 9 points, radius of 3 miles around each.
#> doaggregate is predicted to take 24 seconds
#> Finished 751 of 751 sites. Rate of 41,477 buffers per hour: 751 lat/long pairs took 65 seconds
#> Type 25 of 51 = AL --
#> Note that ejam_uniq_id was already in sitepoints, and might not be 1:NROW(sitepoints), which might cause issues
#> Analyzing 13 points, radius of 3 miles around each.
#> doaggregate is predicted to take 24 seconds
#> Finished 764 of 764 sites. Rate of 40,715 buffers per hour: 764 lat/long pairs took 68 seconds
#> Type 26 of 51 = WA --
#> Note that ejam_uniq_id was already in sitepoints, and might not be 1:NROW(sitepoints), which might cause issues
#> Analyzing 20 points, radius of 3 miles around each.
#> doaggregate is predicted to take 24 seconds
#> Finished 784 of 784 sites. Rate of 40,190 buffers per hour: 784 lat/long pairs took 70 seconds
#> Type 27 of 51 = HI --
#> Note that ejam_uniq_id was already in sitepoints, and might not be 1:NROW(sitepoints), which might cause issues
#> Analyzing 5 points, radius of 3 miles around each.
#> doaggregate is predicted to take 24 seconds
#> Finished 789 of 789 sites. Rate of 39,102 buffers per hour: 789 lat/long pairs took 73 seconds
#> Type 28 of 51 = KY --
#> Note that ejam_uniq_id was already in sitepoints, and might not be 1:NROW(sitepoints), which might cause issues
#> Analyzing 9 points, radius of 3 miles around each.
#> doaggregate is predicted to take 24 seconds
#> Finished 798 of 798 sites. Rate of 38,017 buffers per hour: 798 lat/long pairs took 76 seconds
#> Type 29 of 51 = FL --
#> Note that ejam_uniq_id was already in sitepoints, and might not be 1:NROW(sitepoints), which might cause issues
#> Analyzing 28 points, radius of 3 miles around each.
#> doaggregate is predicted to take 24 seconds
#> Finished 826 of 826 sites. Rate of 38,093 buffers per hour: 826 lat/long pairs took 78 seconds
#> Type 30 of 51 = OR --
#> Note that ejam_uniq_id was already in sitepoints, and might not be 1:NROW(sitepoints), which might cause issues
#> Analyzing 21 points, radius of 3 miles around each.
#> doaggregate is predicted to take 24 seconds
#> Finished 847 of 847 sites. Rate of 37,830 buffers per hour: 847 lat/long pairs took 81 seconds
#> Type 31 of 51 = WI --
#> Note that ejam_uniq_id was already in sitepoints, and might not be 1:NROW(sitepoints), which might cause issues
#> Analyzing 14 points, radius of 3 miles around each.
#> doaggregate is predicted to take 24 seconds
#> Finished 861 of 861 sites. Rate of 37,306 buffers per hour: 861 lat/long pairs took 83 seconds
#> Type 32 of 51 = ID --
#> Note that ejam_uniq_id was already in sitepoints, and might not be 1:NROW(sitepoints), which might cause issues
#> Analyzing 5 points, radius of 3 miles around each.
#> doaggregate is predicted to take 24 seconds
#> Finished 866 of 866 sites. Rate of 36,723 buffers per hour: 866 lat/long pairs took 85 seconds
#> Type 33 of 51 = SC --
#> Note that ejam_uniq_id was already in sitepoints, and might not be 1:NROW(sitepoints), which might cause issues
#> Analyzing 15 points, radius of 3 miles around each.
#> doaggregate is predicted to take 24 seconds
#> Finished 881 of 881 sites. Rate of 36,092 buffers per hour: 881 lat/long pairs took 88 seconds
#> Type 34 of 51 = GA --
#> Note that ejam_uniq_id was already in sitepoints, and might not be 1:NROW(sitepoints), which might cause issues
#> Analyzing 24 points, radius of 3 miles around each.
#> doaggregate is predicted to take 24 seconds
#> Finished 905 of 905 sites. Rate of 35,455 buffers per hour: 905 lat/long pairs took 92 seconds
#> Type 35 of 51 = OK --
#> Note that ejam_uniq_id was already in sitepoints, and might not be 1:NROW(sitepoints), which might cause issues
#> Analyzing 12 points, radius of 3 miles around each.
#> doaggregate is predicted to take 24 seconds
#> Finished 917 of 917 sites. Rate of 35,225 buffers per hour: 917 lat/long pairs took 94 seconds
#> Type 36 of 51 = TN --
#> Note that ejam_uniq_id was already in sitepoints, and might not be 1:NROW(sitepoints), which might cause issues
#> Analyzing 7 points, radius of 3 miles around each.
#> doaggregate is predicted to take 24 seconds
#> Finished 924 of 924 sites. Rate of 34,239 buffers per hour: 924 lat/long pairs took 97 seconds
#> Type 37 of 51 = ND --
#> Note that ejam_uniq_id was already in sitepoints, and might not be 1:NROW(sitepoints), which might cause issues
#> Analyzing 6 points, radius of 3 miles around each.
#> doaggregate is predicted to take 24 seconds
#> Finished 930 of 930 sites. Rate of 33,627 buffers per hour: 930 lat/long pairs took 100 seconds
#> Type 38 of 51 = MO --
#> Note that ejam_uniq_id was already in sitepoints, and might not be 1:NROW(sitepoints), which might cause issues
#> Analyzing 16 points, radius of 3 miles around each.
#> doaggregate is predicted to take 24 seconds
#> Finished 946 of 946 sites. Rate of 33,398 buffers per hour: 946 lat/long pairs took 102 seconds
#> Type 39 of 51 = AR --
#> Note that ejam_uniq_id was already in sitepoints, and might not be 1:NROW(sitepoints), which might cause issues
#> Analyzing 2 points, radius of 3 miles around each.
#> doaggregate is predicted to take 24 seconds
#> Finished 948 of 948 sites. Rate of 32,710 buffers per hour: 948 lat/long pairs took 104 seconds
#> Type 40 of 51 = NH --
#> Note that ejam_uniq_id was already in sitepoints, and might not be 1:NROW(sitepoints), which might cause issues
#> Analyzing 4 points, radius of 3 miles around each.
#> doaggregate is predicted to take 24 seconds
#> Finished 952 of 952 sites. Rate of 32,071 buffers per hour: 952 lat/long pairs took 107 seconds
#> Type 41 of 51 = WV --
#> Note that ejam_uniq_id was already in sitepoints, and might not be 1:NROW(sitepoints), which might cause issues
#> Analyzing 7 points, radius of 3 miles around each.
#> doaggregate is predicted to take 24 seconds
#> Finished 959 of 959 sites. Rate of 31,595 buffers per hour: 959 lat/long pairs took 109 seconds
#> Type 42 of 51 = WY --
#> Note that ejam_uniq_id was already in sitepoints, and might not be 1:NROW(sitepoints), which might cause issues
#> Analyzing 4 points, radius of 3 miles around each.
#> doaggregate is predicted to take 24 seconds
#> Finished 963 of 963 sites. Rate of 31,017 buffers per hour: 963 lat/long pairs took 112 seconds
#> Type 43 of 51 = PR --
#> Note that ejam_uniq_id was already in sitepoints, and might not be 1:NROW(sitepoints), which might cause issues
#> Analyzing 4 points, radius of 3 miles around each.
#> doaggregate is predicted to take 24 seconds
#> In zone = PR for drinking indicator, the lookup table lacks percentile information, so those percentiles will be reported as NA
#> Finished 967 of 967 sites. Rate of 30,378 buffers per hour: 967 lat/long pairs took 115 seconds
#> Type 44 of 51 = NV --
#> Note that ejam_uniq_id was already in sitepoints, and might not be 1:NROW(sitepoints), which might cause issues
#> Analyzing 6 points, radius of 3 miles around each.
#> doaggregate is predicted to take 24 seconds
#> Finished 973 of 973 sites. Rate of 29,951 buffers per hour: 973 lat/long pairs took 117 seconds
#> Type 45 of 51 = ME --
#> Note that ejam_uniq_id was already in sitepoints, and might not be 1:NROW(sitepoints), which might cause issues
#> Analyzing 3 points, radius of 3 miles around each.
#> doaggregate is predicted to take 24 seconds
#> Finished 976 of 976 sites. Rate of 29,414 buffers per hour: 976 lat/long pairs took 119 seconds
#> Type 46 of 51 = MD --
#> Note that ejam_uniq_id was already in sitepoints, and might not be 1:NROW(sitepoints), which might cause issues
#> Analyzing 11 points, radius of 3 miles around each.
#> doaggregate is predicted to take 24 seconds
#> Finished 987 of 987 sites. Rate of 29,159 buffers per hour: 987 lat/long pairs took 122 seconds
#> Type 47 of 51 = NM --
#> Note that ejam_uniq_id was already in sitepoints, and might not be 1:NROW(sitepoints), which might cause issues
#> Analyzing 6 points, radius of 3 miles around each.
#> doaggregate is predicted to take 24 seconds
#> Finished 993 of 993 sites. Rate of 28,908 buffers per hour: 993 lat/long pairs took 124 seconds
#> Type 48 of 51 = RI --
#> Note that ejam_uniq_id was already in sitepoints, and might not be 1:NROW(sitepoints), which might cause issues
#> Analyzing 3 points, radius of 3 miles around each.
#> doaggregate is predicted to take 24 seconds
#> Finished 996 of 996 sites. Rate of 28,298 buffers per hour: 996 lat/long pairs took 127 seconds
#> Type 49 of 51 = DC --
#> Note that ejam_uniq_id was already in sitepoints, and might not be 1:NROW(sitepoints), which might cause issues
#> Analyzing 1 points, radius of 3 miles around each.
#> doaggregate is predicted to take 24 seconds
#> Finished 997 of 997 sites. Rate of 27,781 buffers per hour: 997 lat/long pairs took 129 seconds
#> Type 50 of 51 = VT --
#> Note that ejam_uniq_id was already in sitepoints, and might not be 1:NROW(sitepoints), which might cause issues
#> Analyzing 2 points, radius of 3 miles around each.
#> doaggregate is predicted to take 24 seconds
#> Finished 999 of 999 sites. Rate of 27,302 buffers per hour: 999 lat/long pairs took 132 seconds
#> Type 51 of 51 = SD --
#> Note that ejam_uniq_id was already in sitepoints, and might not be 1:NROW(sitepoints), which might cause issues
#> Analyzing 1 points, radius of 3 miles around each.
#> doaggregate is predicted to take 24 seconds
#> Finished 1000 of 1000 sites. Rate of 26,754 buffers per hour: 1,000 lat/long pairs took 135 seconds
#>
#>
#> type valid sitecount pctvalid pop pop_persite pctofallpop
#> 1 PA 21 21 100 1159954 55236 2
#> 2 CA 170 170 100 15264350 89790 30
#> 3 IA 21 21 100 194052 9241 0
#> 4 NC 18 18 100 401732 22318 1
#> 5 IL 30 30 100 1589128 52971 3
#> 6 AZ 14 14 100 871648 62261 2
#> 7 MS 11 11 100 108080 9825 0
#> 8 NY 57 57 100 4839114 84897 10
#> 9 NJ 93 93 100 5340268 57422 11
#> 10 VA 11 11 100 491362 44669 1
#> 11 CT 15 15 100 454150 30277 1
#> 12 MN 44 44 100 1023437 23260 2
#> 13 NE 14 14 100 75159 5368 0
#> 14 IN 26 26 100 754959 29037 1
#> 15 CO 8 9 89 590346 65594 1
#> 16 MA 26 26 100 1831173 70430 4
#> 17 OH 26 26 100 780793 30030 2
#> 18 TX 69 71 97 3232024 45521 6
#> 19 KS 16 16 100 154902 9681 0
#> 20 MT 10 10 100 132544 13254 0
#> 21 UT 16 18 89 950899 52828 2
#> 22 MI 16 16 100 782767 48923 2
#> 23 DE 5 5 100 102823 20565 0
#> 24 LA 9 9 100 540233 60026 1
#> 25 AL 13 13 100 254235 19557 1
#> 26 WA 20 20 100 1054156 52708 2
#> 27 HI 5 5 100 161256 32251 0
#> 28 KY 9 9 100 61386 6821 0
#> 29 FL 28 28 100 1457251 52045 3
#> 30 OR 21 21 100 1107128 52720 2
#> 31 WI 14 14 100 317386 22670 1
#> 32 ID 5 5 100 11776 2355 0
#> 33 SC 15 15 100 210285 14019 0
#> 34 GA 24 24 100 703126 29297 1
#> 35 OK 12 12 100 205049 17087 0
#> 36 TN 7 7 100 148113 21159 0
#> 37 ND 6 6 100 43233 7206 0
#> 38 MO 16 16 100 677095 42318 1
#> 39 AR 2 2 100 7114 3557 0
#> 40 NH 4 4 100 47660 11915 0
#> 41 WV 7 7 100 31962 4566 0
#> 42 WY 4 4 100 59303 14826 0
#> 43 PR 4 4 100 225174 56294 0
#> 44 NV 6 6 100 663492 110582 1
#> 45 ME 3 3 100 62719 20906 0
#> 46 MD 11 11 100 821114 74647 2
#> 47 NM 6 6 100 81544 13591 0
#> 48 RI 3 3 100 362909 120970 1
#> 49 DC 1 1 100 353862 353862 1
#> 50 VT 2 2 100 5038 2519 0
#> 51 SD 1 1 100 579 579 0
#> pctofallsitecount
#> 1 2
#> 2 17
#> 3 2
#> 4 2
#> 5 3
#> 6 1
#> 7 1
#> 8 6
#> 9 9
#> 10 1
#> 11 2
#> 12 4
#> 13 1
#> 14 3
#> 15 1
#> 16 3
#> 17 3
#> 18 7
#> 19 2
#> 20 1
#> 21 2
#> 22 2
#> 23 0
#> 24 1
#> 25 1
#> 26 2
#> 27 0
#> 28 1
#> 29 3
#> 30 2
#> 31 1
#> 32 0
#> 33 2
#> 34 2
#> 35 1
#> 36 1
#> 37 1
#> 38 2
#> 39 0
#> 40 0
#> 41 1
#> 42 0
#> 43 0
#> 44 1
#> 45 0
#> 46 1
#> 47 1
#> 48 0
#> 49 0
#> 50 0
#> 51 0
#> ratio.to.state.avg.Demog.Index ratio.to.state.avg.Demog.Index.Supp
#> 1 1.5 1.1
#> 2 1.1 1.0
#> 3 1.3 1.0
#> 4 1.2 1.0
#> 5 1.0 0.9
#> 6 1.2 1.1
#> 7 1.0 0.9
#> 8 1.2 1.0
#> 9 1.2 1.1
#> 10 1.1 1.0
#> 11 1.2 1.3
#> 12 1.1 1.0
#> 13 0.8 0.9
#> 14 1.6 1.2
#> 15 1.0 1.0
#> 16 1.2 1.1
#> 17 1.1 1.0
#> 18 1.1 1.0
#> 19 1.1 1.0
#> 20 1.2 1.1
#> 21 1.1 1.1
#> 22 1.4 1.1
#> 23 1.0 0.9
#> 24 1.0 0.9
#> 25 1.0 0.9
#> 26 1.2 1.0
#> 27 1.1 1.0
#> 28 0.7 0.7
#> 29 1.2 1.0
#> 30 1.0 0.9
#> 31 1.4 1.1
#> 32 1.2 1.4
#> 33 1.1 1.0
#> 34 1.1 0.9
#> 35 1.3 1.3
#> 36 1.5 1.1
#> 37 1.0 1.0
#> 38 1.3 1.0
#> 39 1.5 1.2
#> 40 0.9 0.9
#> 41 0.9 0.8
#> 42 1.2 1.1
#> 43 1.0 0.9
#> 44 1.1 1.0
#> 45 1.3 1.2
#> 46 1.3 1.2
#> 47 1.0 1.1
#> 48 1.4 1.2
#> 49 0.8 0.9
#> 50 1.2 1.2
#> 51 1.7 0.6
#> ratio.to.state.avg.pctlowinc ratio.to.state.avg.pctlingiso
#> 1 1.2 1.1
#> 2 1.1 1.3
#> 3 1.1 1.3
#> 4 1.1 1.7
#> 5 0.9 1.2
#> 6 1.2 1.0
#> 7 1.0 1.2
#> 8 1.0 1.2
#> 9 1.2 1.3
#> 10 1.0 1.6
#> 11 1.2 1.4
#> 12 0.9 1.6
#> 13 0.8 0.7
#> 14 1.3 1.5
#> 15 0.9 1.0
#> 16 1.1 1.3
#> 17 1.0 0.6
#> 18 1.0 1.3
#> 19 1.0 1.2
#> 20 1.2 1.4
#> 21 1.1 1.6
#> 22 1.2 2.4
#> 23 1.0 0.9
#> 24 0.9 1.6
#> 25 0.9 1.7
#> 26 1.0 1.3
#> 27 1.0 1.2
#> 28 0.7 0.7
#> 29 1.1 1.1
#> 30 0.9 1.3
#> 31 1.2 1.0
#> 32 1.1 2.8
#> 33 1.0 1.8
#> 34 0.9 0.8
#> 35 1.2 2.6
#> 36 1.2 1.3
#> 37 0.8 1.3
#> 38 1.1 1.5
#> 39 1.1 0.0
#> 40 0.9 1.2
#> 41 0.8 0.4
#> 42 1.1 0.6
#> 43 0.8 0.9
#> 44 1.1 1.1
#> 45 1.1 2.2
#> 46 1.3 1.3
#> 47 0.9 1.8
#> 48 1.3 1.5
#> 49 0.8 1.3
#> 50 1.3 0.8
#> 51 1.1 0.2
#> ratio.to.state.avg.pctunemployed ratio.to.state.avg.pctlths
#> 1 1.3 0.9
#> 2 1.0 1.1
#> 3 1.1 0.9
#> 4 1.1 1.0
#> 5 0.9 1.0
#> 6 1.1 1.1
#> 7 1.1 0.8
#> 8 1.2 1.1
#> 9 1.1 1.2
#> 10 1.1 1.0
#> 11 1.1 1.3
#> 12 1.1 0.9
#> 13 0.8 0.9
#> 14 1.5 1.3
#> 15 1.0 1.1
#> 16 1.1 1.1
#> 17 1.0 0.9
#> 18 1.0 1.1
#> 19 0.9 0.8
#> 20 0.9 0.9
#> 21 1.1 1.1
#> 22 1.2 1.3
#> 23 1.1 0.7
#> 24 0.9 0.8
#> 25 1.0 0.7
#> 26 1.0 1.0
#> 27 1.0 1.2
#> 28 0.8 0.6
#> 29 1.1 1.0
#> 30 1.0 0.8
#> 31 1.4 1.1
#> 32 0.5 2.2
#> 33 0.9 0.9
#> 34 1.0 0.7
#> 35 1.2 1.6
#> 36 1.5 1.1
#> 37 1.3 1.0
#> 38 1.1 0.9
#> 39 2.2 1.4
#> 40 0.9 0.6
#> 41 0.9 0.8
#> 42 1.1 1.2
#> 43 0.8 0.7
#> 44 1.0 1.0
#> 45 0.8 1.1
#> 46 1.2 1.3
#> 47 1.0 1.3
#> 48 1.1 1.4
#> 49 0.7 0.7
#> 50 0.6 1.0
#> 51 2.4 1.0
#> ratio.to.state.avg.pctunder5 ratio.to.state.avg.pctover64
#> 1 1.1 0.9
#> 2 1.0 0.9
#> 3 1.2 0.8
#> 4 1.1 0.8
#> 5 1.0 0.9
#> 6 1.0 0.7
#> 7 0.9 0.8
#> 8 1.1 0.9
#> 9 1.1 0.9
#> 10 1.1 0.8
#> 11 1.1 0.9
#> 12 1.0 0.9
#> 13 1.0 1.1
#> 14 1.1 0.8
#> 15 1.0 0.8
#> 16 1.1 0.8
#> 17 0.9 0.9
#> 18 1.1 0.8
#> 19 1.1 0.9
#> 20 0.9 0.8
#> 21 1.0 1.0
#> 22 1.2 0.8
#> 23 0.9 0.9
#> 24 1.0 1.0
#> 25 1.0 0.8
#> 26 1.0 0.8
#> 27 1.3 0.9
#> 28 1.1 0.8
#> 29 1.2 0.8
#> 30 1.0 0.8
#> 31 1.2 0.9
#> 32 1.0 1.0
#> 33 1.1 0.8
#> 34 1.0 0.9
#> 35 1.1 0.7
#> 36 1.2 0.9
#> 37 1.0 0.8
#> 38 1.0 0.9
#> 39 1.2 0.8
#> 40 1.2 0.8
#> 41 1.1 1.0
#> 42 1.0 0.9
#> 43 1.1 1.0
#> 44 1.1 0.9
#> 45 1.2 0.7
#> 46 1.2 0.9
#> 47 1.4 0.8
#> 48 1.3 0.8
#> 49 0.9 0.7
#> 50 0.8 1.1
#> 51 1.5 0.7
#> ratio.to.state.avg.pctmin
#> 1 1.8
#> 2 1.1
#> 3 1.5
#> 4 1.2
#> 5 1.2
#> 6 1.2
#> 7 1.0
#> 8 1.4
#> 9 1.2
#> 10 1.1
#> 11 1.2
#> 12 1.3
#> 13 0.8
#> 14 2.1
#> 15 1.1
#> 16 1.3
#> 17 1.1
#> 18 1.2
#> 19 1.1
#> 20 1.2
#> 21 1.2
#> 22 1.7
#> 23 1.1
#> 24 1.1
#> 25 1.0
#> 26 1.3
#> 27 1.1
#> 28 0.8
#> 29 1.2
#> 30 1.2
#> 31 1.7
#> 32 1.2
#> 33 1.1
#> 34 1.2
#> 35 1.4
#> 36 1.9
#> 37 1.2
#> 38 1.8
#> 39 2.2
#> 40 1.0
#> 41 1.3
#> 42 1.4
#> 43 1.0
#> 44 1.1
#> 45 1.7
#> 46 1.4
#> 47 1.0
#> 48 1.5
#> 49 0.8
#> 50 1.1
#> 51 2.7
#> Use ejam2excel(out) to view results, and see the types of sites compared, one row each, in the Overall tab
#> Use ejam2barplot_sitegroups() to plot results.
#>
#>
#> 1000 sites in 51 groups (types of sites).
#> Rate of 26,750 buffers per hour: 1,000 lat/long pairs took 135 seconds
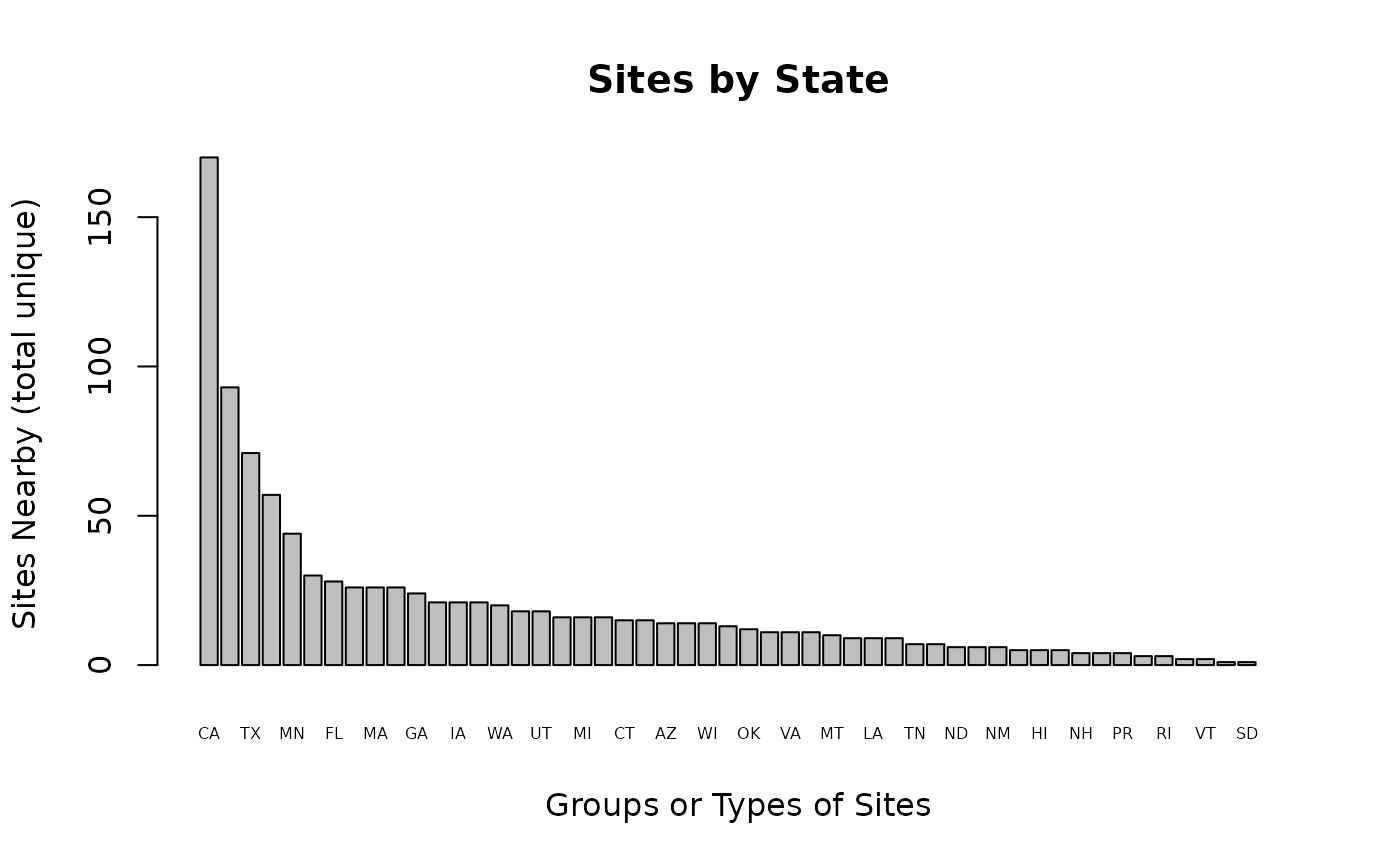
ejam2barplot_sitegroups(out_bystate, "sitecount_unique",
names.arg = out_bystate$types, topn = 52, cex.names = 0.5,
main = "Sites by State")
# Analyze by State (slow)
out_bystate <- ejamit_compare_types_of_places(pts, typeofsite = pts$ST)
#> Type 1 of 51 = PA --
#> Note that ejam_uniq_id was already in sitepoints, and might not be 1:NROW(sitepoints), which might cause issues
#> Analyzing 21 points, radius of 3 miles around each.
#> doaggregate is predicted to take 24 seconds
#> Finished 21 of 21 sites. Rate of 29,883 buffers per hour: 21 lat/long pairs took 3 seconds
#> Type 2 of 51 = CA --
#> Note that ejam_uniq_id was already in sitepoints, and might not be 1:NROW(sitepoints), which might cause issues
#> Analyzing 170 points, radius of 3 miles around each.
#> doaggregate is predicted to take 24 seconds
#> Finished 191 of 191 sites. Rate of 95,319 buffers per hour: 191 lat/long pairs took 7 seconds
#> Type 3 of 51 = IA --
#> Note that ejam_uniq_id was already in sitepoints, and might not be 1:NROW(sitepoints), which might cause issues
#> Analyzing 21 points, radius of 3 miles around each.
#> doaggregate is predicted to take 24 seconds
#> Finished 212 of 212 sites. Rate of 71,485 buffers per hour: 212 lat/long pairs took 11 seconds
#> Type 4 of 51 = NC --
#> Note that ejam_uniq_id was already in sitepoints, and might not be 1:NROW(sitepoints), which might cause issues
#> Analyzing 18 points, radius of 3 miles around each.
#> doaggregate is predicted to take 24 seconds
#> Finished 230 of 230 sites. Rate of 63,366 buffers per hour: 230 lat/long pairs took 13 seconds
#> Type 5 of 51 = IL --
#> Note that ejam_uniq_id was already in sitepoints, and might not be 1:NROW(sitepoints), which might cause issues
#> Analyzing 30 points, radius of 3 miles around each.
#> doaggregate is predicted to take 24 seconds
#> Finished 260 of 260 sites. Rate of 59,693 buffers per hour: 260 lat/long pairs took 16 seconds
#> Type 6 of 51 = AZ --
#> Note that ejam_uniq_id was already in sitepoints, and might not be 1:NROW(sitepoints), which might cause issues
#> Analyzing 14 points, radius of 3 miles around each.
#> doaggregate is predicted to take 24 seconds
#> Finished 274 of 274 sites. Rate of 54,404 buffers per hour: 274 lat/long pairs took 18 seconds
#> Type 7 of 51 = MS --
#> Note that ejam_uniq_id was already in sitepoints, and might not be 1:NROW(sitepoints), which might cause issues
#> Analyzing 11 points, radius of 3 miles around each.
#> doaggregate is predicted to take 24 seconds
#> Finished 285 of 285 sites. Rate of 49,782 buffers per hour: 285 lat/long pairs took 21 seconds
#> Type 8 of 51 = NY --
#> Note that ejam_uniq_id was already in sitepoints, and might not be 1:NROW(sitepoints), which might cause issues
#> Analyzing 57 points, radius of 3 miles around each.
#> doaggregate is predicted to take 24 seconds
#> Finished 342 of 342 sites. Rate of 52,471 buffers per hour: 342 lat/long pairs took 23 seconds
#> Type 9 of 51 = NJ --
#> Note that ejam_uniq_id was already in sitepoints, and might not be 1:NROW(sitepoints), which might cause issues
#> Analyzing 93 points, radius of 3 miles around each.
#> doaggregate is predicted to take 24 seconds
#> Finished 435 of 435 sites. Rate of 58,561 buffers per hour: 435 lat/long pairs took 27 seconds
#> Type 10 of 51 = VA --
#> Note that ejam_uniq_id was already in sitepoints, and might not be 1:NROW(sitepoints), which might cause issues
#> Analyzing 11 points, radius of 3 miles around each.
#> doaggregate is predicted to take 24 seconds
#> Finished 446 of 446 sites. Rate of 53,149 buffers per hour: 446 lat/long pairs took 30 seconds
#> Type 11 of 51 = CT --
#> Note that ejam_uniq_id was already in sitepoints, and might not be 1:NROW(sitepoints), which might cause issues
#> Analyzing 15 points, radius of 3 miles around each.
#> doaggregate is predicted to take 24 seconds
#> Finished 461 of 461 sites. Rate of 50,771 buffers per hour: 461 lat/long pairs took 33 seconds
#> Type 12 of 51 = MN --
#> Note that ejam_uniq_id was already in sitepoints, and might not be 1:NROW(sitepoints), which might cause issues
#> Analyzing 44 points, radius of 3 miles around each.
#> doaggregate is predicted to take 24 seconds
#> Finished 505 of 505 sites. Rate of 51,550 buffers per hour: 505 lat/long pairs took 35 seconds
#> Type 13 of 51 = NE --
#> Note that ejam_uniq_id was already in sitepoints, and might not be 1:NROW(sitepoints), which might cause issues
#> Analyzing 14 points, radius of 3 miles around each.
#> doaggregate is predicted to take 24 seconds
#> Finished 519 of 519 sites. Rate of 47,549 buffers per hour: 519 lat/long pairs took 39 seconds
#> Type 14 of 51 = IN --
#> Note that ejam_uniq_id was already in sitepoints, and might not be 1:NROW(sitepoints), which might cause issues
#> Analyzing 26 points, radius of 3 miles around each.
#> doaggregate is predicted to take 24 seconds
#> Finished 545 of 545 sites. Rate of 47,579 buffers per hour: 545 lat/long pairs took 41 seconds
#> Type 15 of 51 = CO --
#> Note that ejam_uniq_id was already in sitepoints, and might not be 1:NROW(sitepoints), which might cause issues
#> Analyzing 9 points, radius of 3 miles around each.
#> doaggregate is predicted to take 24 seconds
#> Finished 554 of 554 sites. Rate of 45,667 buffers per hour: 554 lat/long pairs took 44 seconds
#> Type 16 of 51 = MA --
#> Note that ejam_uniq_id was already in sitepoints, and might not be 1:NROW(sitepoints), which might cause issues
#> Analyzing 26 points, radius of 3 miles around each.
#> doaggregate is predicted to take 24 seconds
#> Finished 580 of 580 sites. Rate of 45,116 buffers per hour: 580 lat/long pairs took 46 seconds
#> Type 17 of 51 = OH --
#> Note that ejam_uniq_id was already in sitepoints, and might not be 1:NROW(sitepoints), which might cause issues
#> Analyzing 26 points, radius of 3 miles around each.
#> doaggregate is predicted to take 24 seconds
#> Finished 606 of 606 sites. Rate of 43,750 buffers per hour: 606 lat/long pairs took 50 seconds
#> Type 18 of 51 = TX --
#> Note that ejam_uniq_id was already in sitepoints, and might not be 1:NROW(sitepoints), which might cause issues
#> Analyzing 71 points, radius of 3 miles around each.
#> doaggregate is predicted to take 24 seconds
#> Finished 677 of 677 sites. Rate of 46,757 buffers per hour: 677 lat/long pairs took 52 seconds
#> Type 19 of 51 = KS --
#> Note that ejam_uniq_id was already in sitepoints, and might not be 1:NROW(sitepoints), which might cause issues
#> Analyzing 16 points, radius of 3 miles around each.
#> doaggregate is predicted to take 24 seconds
#> Finished 693 of 693 sites. Rate of 46,639 buffers per hour: 693 lat/long pairs took 53 seconds
#> Type 20 of 51 = MT --
#> Note that ejam_uniq_id was already in sitepoints, and might not be 1:NROW(sitepoints), which might cause issues
#> Analyzing 10 points, radius of 3 miles around each.
#> doaggregate is predicted to take 24 seconds
#> Finished 703 of 703 sites. Rate of 45,749 buffers per hour: 703 lat/long pairs took 55 seconds
#> Type 21 of 51 = UT --
#> Note that ejam_uniq_id was already in sitepoints, and might not be 1:NROW(sitepoints), which might cause issues
#> Analyzing 18 points, radius of 3 miles around each.
#> doaggregate is predicted to take 24 seconds
#> Finished 721 of 721 sites. Rate of 44,943 buffers per hour: 721 lat/long pairs took 58 seconds
#> Type 22 of 51 = MI --
#> Note that ejam_uniq_id was already in sitepoints, and might not be 1:NROW(sitepoints), which might cause issues
#> Analyzing 16 points, radius of 3 miles around each.
#> doaggregate is predicted to take 24 seconds
#> Finished 737 of 737 sites. Rate of 43,984 buffers per hour: 737 lat/long pairs took 60 seconds
#> Type 23 of 51 = DE --
#> Note that ejam_uniq_id was already in sitepoints, and might not be 1:NROW(sitepoints), which might cause issues
#> Analyzing 5 points, radius of 3 miles around each.
#> doaggregate is predicted to take 24 seconds
#> Finished 742 of 742 sites. Rate of 42,565 buffers per hour: 742 lat/long pairs took 63 seconds
#> Type 24 of 51 = LA --
#> Note that ejam_uniq_id was already in sitepoints, and might not be 1:NROW(sitepoints), which might cause issues
#> Analyzing 9 points, radius of 3 miles around each.
#> doaggregate is predicted to take 24 seconds
#> Finished 751 of 751 sites. Rate of 41,477 buffers per hour: 751 lat/long pairs took 65 seconds
#> Type 25 of 51 = AL --
#> Note that ejam_uniq_id was already in sitepoints, and might not be 1:NROW(sitepoints), which might cause issues
#> Analyzing 13 points, radius of 3 miles around each.
#> doaggregate is predicted to take 24 seconds
#> Finished 764 of 764 sites. Rate of 40,715 buffers per hour: 764 lat/long pairs took 68 seconds
#> Type 26 of 51 = WA --
#> Note that ejam_uniq_id was already in sitepoints, and might not be 1:NROW(sitepoints), which might cause issues
#> Analyzing 20 points, radius of 3 miles around each.
#> doaggregate is predicted to take 24 seconds
#> Finished 784 of 784 sites. Rate of 40,190 buffers per hour: 784 lat/long pairs took 70 seconds
#> Type 27 of 51 = HI --
#> Note that ejam_uniq_id was already in sitepoints, and might not be 1:NROW(sitepoints), which might cause issues
#> Analyzing 5 points, radius of 3 miles around each.
#> doaggregate is predicted to take 24 seconds
#> Finished 789 of 789 sites. Rate of 39,102 buffers per hour: 789 lat/long pairs took 73 seconds
#> Type 28 of 51 = KY --
#> Note that ejam_uniq_id was already in sitepoints, and might not be 1:NROW(sitepoints), which might cause issues
#> Analyzing 9 points, radius of 3 miles around each.
#> doaggregate is predicted to take 24 seconds
#> Finished 798 of 798 sites. Rate of 38,017 buffers per hour: 798 lat/long pairs took 76 seconds
#> Type 29 of 51 = FL --
#> Note that ejam_uniq_id was already in sitepoints, and might not be 1:NROW(sitepoints), which might cause issues
#> Analyzing 28 points, radius of 3 miles around each.
#> doaggregate is predicted to take 24 seconds
#> Finished 826 of 826 sites. Rate of 38,093 buffers per hour: 826 lat/long pairs took 78 seconds
#> Type 30 of 51 = OR --
#> Note that ejam_uniq_id was already in sitepoints, and might not be 1:NROW(sitepoints), which might cause issues
#> Analyzing 21 points, radius of 3 miles around each.
#> doaggregate is predicted to take 24 seconds
#> Finished 847 of 847 sites. Rate of 37,830 buffers per hour: 847 lat/long pairs took 81 seconds
#> Type 31 of 51 = WI --
#> Note that ejam_uniq_id was already in sitepoints, and might not be 1:NROW(sitepoints), which might cause issues
#> Analyzing 14 points, radius of 3 miles around each.
#> doaggregate is predicted to take 24 seconds
#> Finished 861 of 861 sites. Rate of 37,306 buffers per hour: 861 lat/long pairs took 83 seconds
#> Type 32 of 51 = ID --
#> Note that ejam_uniq_id was already in sitepoints, and might not be 1:NROW(sitepoints), which might cause issues
#> Analyzing 5 points, radius of 3 miles around each.
#> doaggregate is predicted to take 24 seconds
#> Finished 866 of 866 sites. Rate of 36,723 buffers per hour: 866 lat/long pairs took 85 seconds
#> Type 33 of 51 = SC --
#> Note that ejam_uniq_id was already in sitepoints, and might not be 1:NROW(sitepoints), which might cause issues
#> Analyzing 15 points, radius of 3 miles around each.
#> doaggregate is predicted to take 24 seconds
#> Finished 881 of 881 sites. Rate of 36,092 buffers per hour: 881 lat/long pairs took 88 seconds
#> Type 34 of 51 = GA --
#> Note that ejam_uniq_id was already in sitepoints, and might not be 1:NROW(sitepoints), which might cause issues
#> Analyzing 24 points, radius of 3 miles around each.
#> doaggregate is predicted to take 24 seconds
#> Finished 905 of 905 sites. Rate of 35,455 buffers per hour: 905 lat/long pairs took 92 seconds
#> Type 35 of 51 = OK --
#> Note that ejam_uniq_id was already in sitepoints, and might not be 1:NROW(sitepoints), which might cause issues
#> Analyzing 12 points, radius of 3 miles around each.
#> doaggregate is predicted to take 24 seconds
#> Finished 917 of 917 sites. Rate of 35,225 buffers per hour: 917 lat/long pairs took 94 seconds
#> Type 36 of 51 = TN --
#> Note that ejam_uniq_id was already in sitepoints, and might not be 1:NROW(sitepoints), which might cause issues
#> Analyzing 7 points, radius of 3 miles around each.
#> doaggregate is predicted to take 24 seconds
#> Finished 924 of 924 sites. Rate of 34,239 buffers per hour: 924 lat/long pairs took 97 seconds
#> Type 37 of 51 = ND --
#> Note that ejam_uniq_id was already in sitepoints, and might not be 1:NROW(sitepoints), which might cause issues
#> Analyzing 6 points, radius of 3 miles around each.
#> doaggregate is predicted to take 24 seconds
#> Finished 930 of 930 sites. Rate of 33,627 buffers per hour: 930 lat/long pairs took 100 seconds
#> Type 38 of 51 = MO --
#> Note that ejam_uniq_id was already in sitepoints, and might not be 1:NROW(sitepoints), which might cause issues
#> Analyzing 16 points, radius of 3 miles around each.
#> doaggregate is predicted to take 24 seconds
#> Finished 946 of 946 sites. Rate of 33,398 buffers per hour: 946 lat/long pairs took 102 seconds
#> Type 39 of 51 = AR --
#> Note that ejam_uniq_id was already in sitepoints, and might not be 1:NROW(sitepoints), which might cause issues
#> Analyzing 2 points, radius of 3 miles around each.
#> doaggregate is predicted to take 24 seconds
#> Finished 948 of 948 sites. Rate of 32,710 buffers per hour: 948 lat/long pairs took 104 seconds
#> Type 40 of 51 = NH --
#> Note that ejam_uniq_id was already in sitepoints, and might not be 1:NROW(sitepoints), which might cause issues
#> Analyzing 4 points, radius of 3 miles around each.
#> doaggregate is predicted to take 24 seconds
#> Finished 952 of 952 sites. Rate of 32,071 buffers per hour: 952 lat/long pairs took 107 seconds
#> Type 41 of 51 = WV --
#> Note that ejam_uniq_id was already in sitepoints, and might not be 1:NROW(sitepoints), which might cause issues
#> Analyzing 7 points, radius of 3 miles around each.
#> doaggregate is predicted to take 24 seconds
#> Finished 959 of 959 sites. Rate of 31,595 buffers per hour: 959 lat/long pairs took 109 seconds
#> Type 42 of 51 = WY --
#> Note that ejam_uniq_id was already in sitepoints, and might not be 1:NROW(sitepoints), which might cause issues
#> Analyzing 4 points, radius of 3 miles around each.
#> doaggregate is predicted to take 24 seconds
#> Finished 963 of 963 sites. Rate of 31,017 buffers per hour: 963 lat/long pairs took 112 seconds
#> Type 43 of 51 = PR --
#> Note that ejam_uniq_id was already in sitepoints, and might not be 1:NROW(sitepoints), which might cause issues
#> Analyzing 4 points, radius of 3 miles around each.
#> doaggregate is predicted to take 24 seconds
#> In zone = PR for drinking indicator, the lookup table lacks percentile information, so those percentiles will be reported as NA
#> Finished 967 of 967 sites. Rate of 30,378 buffers per hour: 967 lat/long pairs took 115 seconds
#> Type 44 of 51 = NV --
#> Note that ejam_uniq_id was already in sitepoints, and might not be 1:NROW(sitepoints), which might cause issues
#> Analyzing 6 points, radius of 3 miles around each.
#> doaggregate is predicted to take 24 seconds
#> Finished 973 of 973 sites. Rate of 29,951 buffers per hour: 973 lat/long pairs took 117 seconds
#> Type 45 of 51 = ME --
#> Note that ejam_uniq_id was already in sitepoints, and might not be 1:NROW(sitepoints), which might cause issues
#> Analyzing 3 points, radius of 3 miles around each.
#> doaggregate is predicted to take 24 seconds
#> Finished 976 of 976 sites. Rate of 29,414 buffers per hour: 976 lat/long pairs took 119 seconds
#> Type 46 of 51 = MD --
#> Note that ejam_uniq_id was already in sitepoints, and might not be 1:NROW(sitepoints), which might cause issues
#> Analyzing 11 points, radius of 3 miles around each.
#> doaggregate is predicted to take 24 seconds
#> Finished 987 of 987 sites. Rate of 29,159 buffers per hour: 987 lat/long pairs took 122 seconds
#> Type 47 of 51 = NM --
#> Note that ejam_uniq_id was already in sitepoints, and might not be 1:NROW(sitepoints), which might cause issues
#> Analyzing 6 points, radius of 3 miles around each.
#> doaggregate is predicted to take 24 seconds
#> Finished 993 of 993 sites. Rate of 28,908 buffers per hour: 993 lat/long pairs took 124 seconds
#> Type 48 of 51 = RI --
#> Note that ejam_uniq_id was already in sitepoints, and might not be 1:NROW(sitepoints), which might cause issues
#> Analyzing 3 points, radius of 3 miles around each.
#> doaggregate is predicted to take 24 seconds
#> Finished 996 of 996 sites. Rate of 28,298 buffers per hour: 996 lat/long pairs took 127 seconds
#> Type 49 of 51 = DC --
#> Note that ejam_uniq_id was already in sitepoints, and might not be 1:NROW(sitepoints), which might cause issues
#> Analyzing 1 points, radius of 3 miles around each.
#> doaggregate is predicted to take 24 seconds
#> Finished 997 of 997 sites. Rate of 27,781 buffers per hour: 997 lat/long pairs took 129 seconds
#> Type 50 of 51 = VT --
#> Note that ejam_uniq_id was already in sitepoints, and might not be 1:NROW(sitepoints), which might cause issues
#> Analyzing 2 points, radius of 3 miles around each.
#> doaggregate is predicted to take 24 seconds
#> Finished 999 of 999 sites. Rate of 27,302 buffers per hour: 999 lat/long pairs took 132 seconds
#> Type 51 of 51 = SD --
#> Note that ejam_uniq_id was already in sitepoints, and might not be 1:NROW(sitepoints), which might cause issues
#> Analyzing 1 points, radius of 3 miles around each.
#> doaggregate is predicted to take 24 seconds
#> Finished 1000 of 1000 sites. Rate of 26,754 buffers per hour: 1,000 lat/long pairs took 135 seconds
#>
#>
#> type valid sitecount pctvalid pop pop_persite pctofallpop
#> 1 PA 21 21 100 1159954 55236 2
#> 2 CA 170 170 100 15264350 89790 30
#> 3 IA 21 21 100 194052 9241 0
#> 4 NC 18 18 100 401732 22318 1
#> 5 IL 30 30 100 1589128 52971 3
#> 6 AZ 14 14 100 871648 62261 2
#> 7 MS 11 11 100 108080 9825 0
#> 8 NY 57 57 100 4839114 84897 10
#> 9 NJ 93 93 100 5340268 57422 11
#> 10 VA 11 11 100 491362 44669 1
#> 11 CT 15 15 100 454150 30277 1
#> 12 MN 44 44 100 1023437 23260 2
#> 13 NE 14 14 100 75159 5368 0
#> 14 IN 26 26 100 754959 29037 1
#> 15 CO 8 9 89 590346 65594 1
#> 16 MA 26 26 100 1831173 70430 4
#> 17 OH 26 26 100 780793 30030 2
#> 18 TX 69 71 97 3232024 45521 6
#> 19 KS 16 16 100 154902 9681 0
#> 20 MT 10 10 100 132544 13254 0
#> 21 UT 16 18 89 950899 52828 2
#> 22 MI 16 16 100 782767 48923 2
#> 23 DE 5 5 100 102823 20565 0
#> 24 LA 9 9 100 540233 60026 1
#> 25 AL 13 13 100 254235 19557 1
#> 26 WA 20 20 100 1054156 52708 2
#> 27 HI 5 5 100 161256 32251 0
#> 28 KY 9 9 100 61386 6821 0
#> 29 FL 28 28 100 1457251 52045 3
#> 30 OR 21 21 100 1107128 52720 2
#> 31 WI 14 14 100 317386 22670 1
#> 32 ID 5 5 100 11776 2355 0
#> 33 SC 15 15 100 210285 14019 0
#> 34 GA 24 24 100 703126 29297 1
#> 35 OK 12 12 100 205049 17087 0
#> 36 TN 7 7 100 148113 21159 0
#> 37 ND 6 6 100 43233 7206 0
#> 38 MO 16 16 100 677095 42318 1
#> 39 AR 2 2 100 7114 3557 0
#> 40 NH 4 4 100 47660 11915 0
#> 41 WV 7 7 100 31962 4566 0
#> 42 WY 4 4 100 59303 14826 0
#> 43 PR 4 4 100 225174 56294 0
#> 44 NV 6 6 100 663492 110582 1
#> 45 ME 3 3 100 62719 20906 0
#> 46 MD 11 11 100 821114 74647 2
#> 47 NM 6 6 100 81544 13591 0
#> 48 RI 3 3 100 362909 120970 1
#> 49 DC 1 1 100 353862 353862 1
#> 50 VT 2 2 100 5038 2519 0
#> 51 SD 1 1 100 579 579 0
#> pctofallsitecount
#> 1 2
#> 2 17
#> 3 2
#> 4 2
#> 5 3
#> 6 1
#> 7 1
#> 8 6
#> 9 9
#> 10 1
#> 11 2
#> 12 4
#> 13 1
#> 14 3
#> 15 1
#> 16 3
#> 17 3
#> 18 7
#> 19 2
#> 20 1
#> 21 2
#> 22 2
#> 23 0
#> 24 1
#> 25 1
#> 26 2
#> 27 0
#> 28 1
#> 29 3
#> 30 2
#> 31 1
#> 32 0
#> 33 2
#> 34 2
#> 35 1
#> 36 1
#> 37 1
#> 38 2
#> 39 0
#> 40 0
#> 41 1
#> 42 0
#> 43 0
#> 44 1
#> 45 0
#> 46 1
#> 47 1
#> 48 0
#> 49 0
#> 50 0
#> 51 0
#> ratio.to.state.avg.Demog.Index ratio.to.state.avg.Demog.Index.Supp
#> 1 1.5 1.1
#> 2 1.1 1.0
#> 3 1.3 1.0
#> 4 1.2 1.0
#> 5 1.0 0.9
#> 6 1.2 1.1
#> 7 1.0 0.9
#> 8 1.2 1.0
#> 9 1.2 1.1
#> 10 1.1 1.0
#> 11 1.2 1.3
#> 12 1.1 1.0
#> 13 0.8 0.9
#> 14 1.6 1.2
#> 15 1.0 1.0
#> 16 1.2 1.1
#> 17 1.1 1.0
#> 18 1.1 1.0
#> 19 1.1 1.0
#> 20 1.2 1.1
#> 21 1.1 1.1
#> 22 1.4 1.1
#> 23 1.0 0.9
#> 24 1.0 0.9
#> 25 1.0 0.9
#> 26 1.2 1.0
#> 27 1.1 1.0
#> 28 0.7 0.7
#> 29 1.2 1.0
#> 30 1.0 0.9
#> 31 1.4 1.1
#> 32 1.2 1.4
#> 33 1.1 1.0
#> 34 1.1 0.9
#> 35 1.3 1.3
#> 36 1.5 1.1
#> 37 1.0 1.0
#> 38 1.3 1.0
#> 39 1.5 1.2
#> 40 0.9 0.9
#> 41 0.9 0.8
#> 42 1.2 1.1
#> 43 1.0 0.9
#> 44 1.1 1.0
#> 45 1.3 1.2
#> 46 1.3 1.2
#> 47 1.0 1.1
#> 48 1.4 1.2
#> 49 0.8 0.9
#> 50 1.2 1.2
#> 51 1.7 0.6
#> ratio.to.state.avg.pctlowinc ratio.to.state.avg.pctlingiso
#> 1 1.2 1.1
#> 2 1.1 1.3
#> 3 1.1 1.3
#> 4 1.1 1.7
#> 5 0.9 1.2
#> 6 1.2 1.0
#> 7 1.0 1.2
#> 8 1.0 1.2
#> 9 1.2 1.3
#> 10 1.0 1.6
#> 11 1.2 1.4
#> 12 0.9 1.6
#> 13 0.8 0.7
#> 14 1.3 1.5
#> 15 0.9 1.0
#> 16 1.1 1.3
#> 17 1.0 0.6
#> 18 1.0 1.3
#> 19 1.0 1.2
#> 20 1.2 1.4
#> 21 1.1 1.6
#> 22 1.2 2.4
#> 23 1.0 0.9
#> 24 0.9 1.6
#> 25 0.9 1.7
#> 26 1.0 1.3
#> 27 1.0 1.2
#> 28 0.7 0.7
#> 29 1.1 1.1
#> 30 0.9 1.3
#> 31 1.2 1.0
#> 32 1.1 2.8
#> 33 1.0 1.8
#> 34 0.9 0.8
#> 35 1.2 2.6
#> 36 1.2 1.3
#> 37 0.8 1.3
#> 38 1.1 1.5
#> 39 1.1 0.0
#> 40 0.9 1.2
#> 41 0.8 0.4
#> 42 1.1 0.6
#> 43 0.8 0.9
#> 44 1.1 1.1
#> 45 1.1 2.2
#> 46 1.3 1.3
#> 47 0.9 1.8
#> 48 1.3 1.5
#> 49 0.8 1.3
#> 50 1.3 0.8
#> 51 1.1 0.2
#> ratio.to.state.avg.pctunemployed ratio.to.state.avg.pctlths
#> 1 1.3 0.9
#> 2 1.0 1.1
#> 3 1.1 0.9
#> 4 1.1 1.0
#> 5 0.9 1.0
#> 6 1.1 1.1
#> 7 1.1 0.8
#> 8 1.2 1.1
#> 9 1.1 1.2
#> 10 1.1 1.0
#> 11 1.1 1.3
#> 12 1.1 0.9
#> 13 0.8 0.9
#> 14 1.5 1.3
#> 15 1.0 1.1
#> 16 1.1 1.1
#> 17 1.0 0.9
#> 18 1.0 1.1
#> 19 0.9 0.8
#> 20 0.9 0.9
#> 21 1.1 1.1
#> 22 1.2 1.3
#> 23 1.1 0.7
#> 24 0.9 0.8
#> 25 1.0 0.7
#> 26 1.0 1.0
#> 27 1.0 1.2
#> 28 0.8 0.6
#> 29 1.1 1.0
#> 30 1.0 0.8
#> 31 1.4 1.1
#> 32 0.5 2.2
#> 33 0.9 0.9
#> 34 1.0 0.7
#> 35 1.2 1.6
#> 36 1.5 1.1
#> 37 1.3 1.0
#> 38 1.1 0.9
#> 39 2.2 1.4
#> 40 0.9 0.6
#> 41 0.9 0.8
#> 42 1.1 1.2
#> 43 0.8 0.7
#> 44 1.0 1.0
#> 45 0.8 1.1
#> 46 1.2 1.3
#> 47 1.0 1.3
#> 48 1.1 1.4
#> 49 0.7 0.7
#> 50 0.6 1.0
#> 51 2.4 1.0
#> ratio.to.state.avg.pctunder5 ratio.to.state.avg.pctover64
#> 1 1.1 0.9
#> 2 1.0 0.9
#> 3 1.2 0.8
#> 4 1.1 0.8
#> 5 1.0 0.9
#> 6 1.0 0.7
#> 7 0.9 0.8
#> 8 1.1 0.9
#> 9 1.1 0.9
#> 10 1.1 0.8
#> 11 1.1 0.9
#> 12 1.0 0.9
#> 13 1.0 1.1
#> 14 1.1 0.8
#> 15 1.0 0.8
#> 16 1.1 0.8
#> 17 0.9 0.9
#> 18 1.1 0.8
#> 19 1.1 0.9
#> 20 0.9 0.8
#> 21 1.0 1.0
#> 22 1.2 0.8
#> 23 0.9 0.9
#> 24 1.0 1.0
#> 25 1.0 0.8
#> 26 1.0 0.8
#> 27 1.3 0.9
#> 28 1.1 0.8
#> 29 1.2 0.8
#> 30 1.0 0.8
#> 31 1.2 0.9
#> 32 1.0 1.0
#> 33 1.1 0.8
#> 34 1.0 0.9
#> 35 1.1 0.7
#> 36 1.2 0.9
#> 37 1.0 0.8
#> 38 1.0 0.9
#> 39 1.2 0.8
#> 40 1.2 0.8
#> 41 1.1 1.0
#> 42 1.0 0.9
#> 43 1.1 1.0
#> 44 1.1 0.9
#> 45 1.2 0.7
#> 46 1.2 0.9
#> 47 1.4 0.8
#> 48 1.3 0.8
#> 49 0.9 0.7
#> 50 0.8 1.1
#> 51 1.5 0.7
#> ratio.to.state.avg.pctmin
#> 1 1.8
#> 2 1.1
#> 3 1.5
#> 4 1.2
#> 5 1.2
#> 6 1.2
#> 7 1.0
#> 8 1.4
#> 9 1.2
#> 10 1.1
#> 11 1.2
#> 12 1.3
#> 13 0.8
#> 14 2.1
#> 15 1.1
#> 16 1.3
#> 17 1.1
#> 18 1.2
#> 19 1.1
#> 20 1.2
#> 21 1.2
#> 22 1.7
#> 23 1.1
#> 24 1.1
#> 25 1.0
#> 26 1.3
#> 27 1.1
#> 28 0.8
#> 29 1.2
#> 30 1.2
#> 31 1.7
#> 32 1.2
#> 33 1.1
#> 34 1.2
#> 35 1.4
#> 36 1.9
#> 37 1.2
#> 38 1.8
#> 39 2.2
#> 40 1.0
#> 41 1.3
#> 42 1.4
#> 43 1.0
#> 44 1.1
#> 45 1.7
#> 46 1.4
#> 47 1.0
#> 48 1.5
#> 49 0.8
#> 50 1.1
#> 51 2.7
#> Use ejam2excel(out) to view results, and see the types of sites compared, one row each, in the Overall tab
#> Use ejam2barplot_sitegroups() to plot results.
#>
#>
#> 1000 sites in 51 groups (types of sites).
#> Rate of 26,750 buffers per hour: 1,000 lat/long pairs took 135 seconds
ejam2barplot_sitegroups(out_bystate, "sitecount_unique",
names.arg = out_bystate$types, topn = 52, cex.names = 0.5,
main = "Sites by State")
 # }
# }