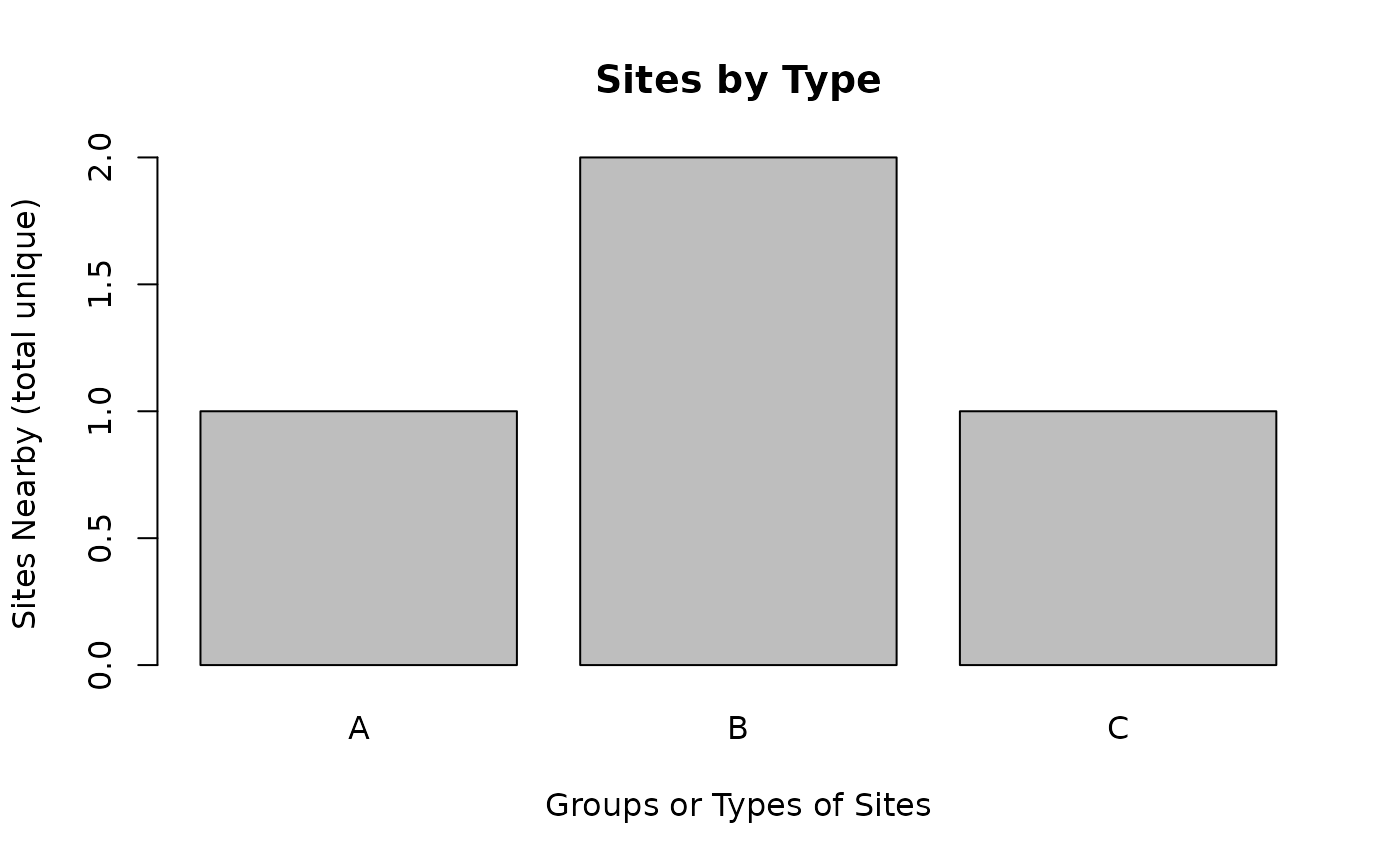
barplot comparing groups of sites on 1 indicator, based on table of grouped site data
Source:R/ejam2barplot_sites.R
plot_barplot_sitegroups.Rdbarplot comparing groups of sites on 1 indicator, based on table of grouped site data
Usage
plot_barplot_sitegroups(
  results_bytype,
  varname = "Demog.Index",
  names.arg = NULL,
  main = "Sites by Type",
  xlab = "Groups or Types of Sites",
  ylab = NULL,
  sortby = NULL,
  topn = 10,
  ...
)
Arguments
- results_bytype
table like from ejamit_compare_types_of_places()$results_bytype, a table of site groups, one row per type (group), column names at least varname (and "ejam_uniq_id" if names.arg not specified)
- varname
name of a column in results_bytype, bar height
- names.arg
optional vector of labels on the bars, like the types of sites represented by each group
- main
optional, for barplot
- xlab
optional, for barplot
- ylab
optional, for barplot, plain English version of varname, indicator that is bar height
- sortby
set to FALSE if you want to have no sorting, or to an increasing vector that provides the sort order
- topn
optional, show only the top n groups (site types) – Does not show all by default – only shows top n groups.
- ...
passed to barplot()
Value
same as barplot()
Examples
 out <- ejamit_compare_types_of_places(testpoints_10[1:4, ],
   typeofsite <- c("A", "B", "B", "C"))
#> Type 1 of 3 = A  -- Analyzing 1 points, radius of 3 miles around each.
#> doaggregate is predicted to take 24 seconds
#> Finished 1 of 1 sites. Rate of 872 buffers per hour: 1 lat/long pairs took 4 seconds
#> Type 2 of 3 = B  --
#> Note that ejam_uniq_id was already in sitepoints, and might not be 1:NROW(sitepoints), which might cause issues
#> Analyzing 2 points, radius of 3 miles around each.
#> doaggregate is predicted to take 24 seconds
#> Finished 3 of 3 sites. Rate of 1,250 buffers per hour: 3 lat/long pairs took 9 seconds
#> Type 3 of 3 = C  --
#> Note that ejam_uniq_id was already in sitepoints, and might not be 1:NROW(sitepoints), which might cause issues
#> Analyzing 1 points, radius of 3 miles around each.
#> doaggregate is predicted to take 24 seconds
#> Finished 4 of 4 sites. Rate of 1,285 buffers per hour: 4 lat/long pairs took 11 seconds
#>
#>
#>   type valid sitecount pctvalid     pop pop_persite pctofallpop
#> 1    A     1         1      100  124566      124566           9
#> 2    B     2         2      100 1176931      588466          89
#> 3    C     1         1      100   19637       19637           1
#>   pctofallsitecount
#> 1                25
#> 2                50
#> 3                25
#>   ratio.to.state.avg.Demog.Index ratio.to.state.avg.Demog.Index.Supp
#> 1                            0.9                                 0.8
#> 2                            1.2                                 1.0
#> 3                            0.7                                 0.9
#>   ratio.to.state.avg.pctlowinc ratio.to.state.avg.pctlingiso
#> 1                          0.5                           1.2
#> 2                          1.1                           1.0
#> 3                          0.8                           0.7
#>   ratio.to.state.avg.pctunemployed ratio.to.state.avg.pctlths
#> 1                              0.6                        0.7
#> 2                              1.1                        1.0
#> 3                              1.0                        1.0
#>   ratio.to.state.avg.pctunder5 ratio.to.state.avg.pctover64
#> 1                          0.9                          1.1
#> 2                          1.2                          0.7
#> 3                          1.2                          0.8
#>   ratio.to.state.avg.pctmin
#> 1                       1.2
#> 2                       1.2
#> 3                       0.6
#> Use  ejam2excel(out)  to view results, and see the types of sites compared, one row each, in the Overall tab
#> Use ejam2barplot_sitegroups() to plot results.
#>
#>
#>  4 sites in 3 groups (types of sites).
#> Rate of 1,284 buffers per hour: 4 lat/long pairs took 11 seconds
   cbind(Rows_or_length = sapply(out, NROW))
#>                  Rows_or_length
#> types                         3
#> sitecount_bytype              3
#> results_bytype                3
#> results_overall               3
#> ejam_uniq_id                  4
#> typeofsite                    4
#> results_bysite                4
#> longnames                   469
#> validstats                    3
#> ratiostats                    3

 ejam2barplot_sitegroups(out, "sitecount_unique", topn=3, sortby = F)