FIPS - Analyze US Counties as if they were sites, to get summary indicators summary for each county
Source:R/FIPS_FUNCTIONS.R
counties_as_sites.RdFIPS - Analyze US Counties as if they were sites, to get summary indicators summary for each county
Value
provides table similar to the output of getblocksnearby(), data.table with one row per blockgroup in these counties, or all pairs of county fips - bgid, and ejam_uniq_id (1 through N) assigned to each county but missing blockid and distance so not ready for doaggregate().
Details
This function provides one row per blockgroup.
getblocksnearby_from_fips() provides one row per block.
See more below under "Value"
Examples
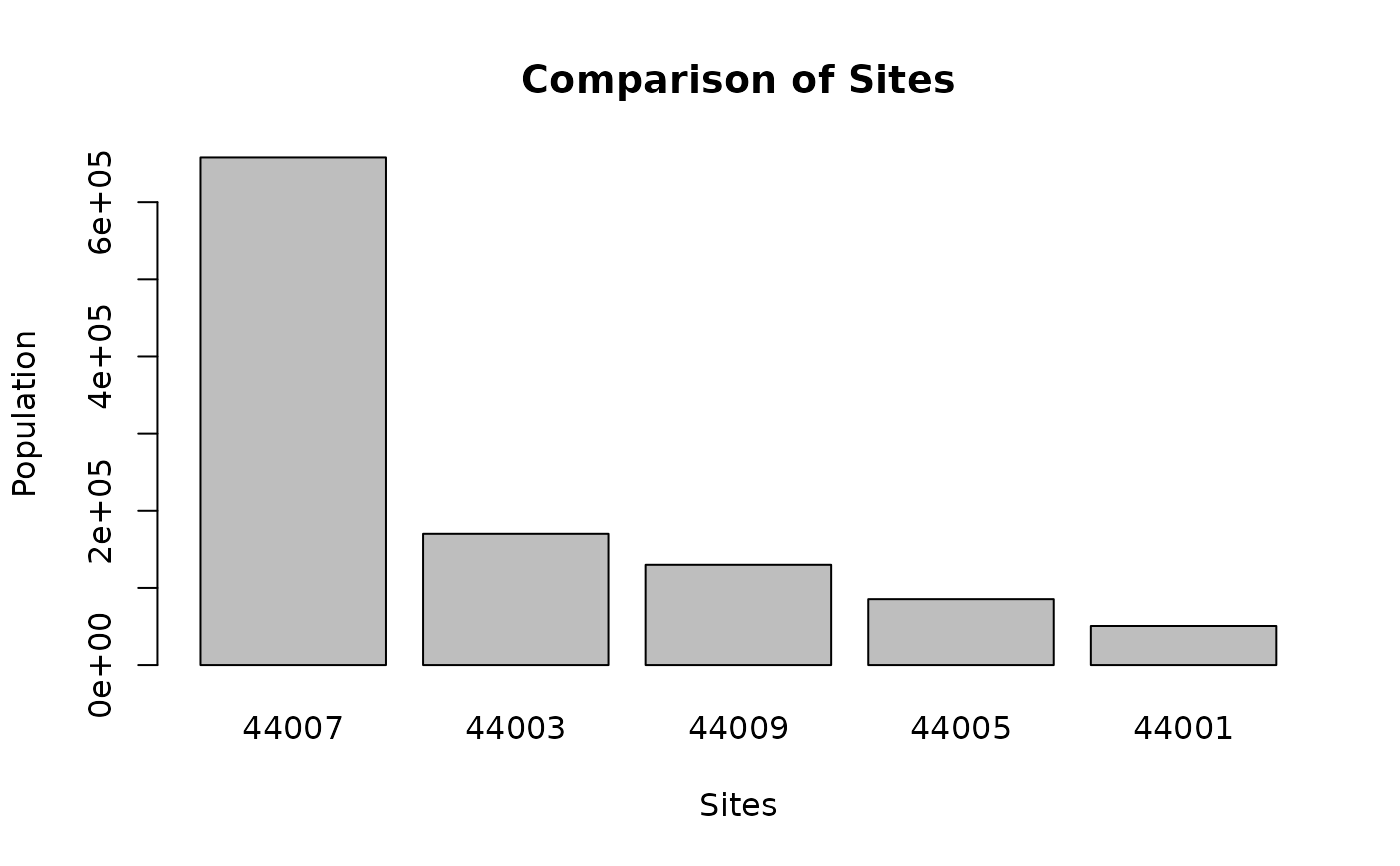
# compare counties within a state:
fipsRI = fips_counties_from_state_abbrev("RI")
x = counties_as_sites(fipsRI)
out = doaggregate(x) # similar to ejamit()
#> *** For now, if sites2states_or_latlon is not provided to doaggregate(),
#> for circles covering 2 states, it will use state of nearest block,
#> and for Shapefiles spanning 2 States, will just use 1 of the States -
#> not selected by area or population, but just whatever happens to be first in the table.
#> This should only arise if not in shiny app and not using ejamit() and
#> sites2states_or_latlon was not provided to doaggregate()
ejam2barplot_sites(out, "pop", names.arg = fipsRI)
 # compare two specific counties:
counties_as_sites(c('01001','72153'))
#> ejam_uniq_id countyfips bgid blockid blockwt distance distance_unadjusted
#> <int> <char> <int> <int> <num> <num> <num>
#> 1: 1 01001 1 1 1 0 0
#> 2: 1 01001 2 27 1 0 0
#> 3: 1 01001 3 57 1 0 0
#> 4: 1 01001 4 71 1 0 0
#> 5: 1 01001 5 98 1 0 0
#> 6: 1 01001 6 119 1 0 0
#> 7: 1 01001 7 140 1 0 0
#> 8: 1 01001 8 156 1 0 0
#> 9: 1 01001 9 185 1 0 0
#> 10: 1 01001 10 214 1 0 0
#> 11: 1 01001 11 232 1 0 0
#> 12: 1 01001 12 261 1 0 0
#> 13: 1 01001 13 279 1 0 0
#> 14: 1 01001 14 290 1 0 0
#> 15: 1 01001 15 296 1 0 0
#> 16: 1 01001 16 303 1 0 0
#> 17: 1 01001 17 313 1 0 0
#> 18: 1 01001 18 329 1 0 0
#> 19: 1 01001 19 361 1 0 0
#> 20: 1 01001 20 371 1 0 0
#> 21: 1 01001 21 393 1 0 0
#> 22: 1 01001 22 422 1 0 0
#> 23: 1 01001 23 450 1 0 0
#> 24: 1 01001 24 503 1 0 0
#> 25: 1 01001 25 564 1 0 0
#> 26: 1 01001 26 594 1 0 0
#> 27: 1 01001 27 641 1 0 0
#> 28: 1 01001 28 669 1 0 0
#> 29: 1 01001 29 683 1 0 0
#> 30: 1 01001 30 708 1 0 0
#> 31: 1 01001 31 738 1 0 0
#> 32: 1 01001 32 759 1 0 0
#> 33: 1 01001 33 814 1 0 0
#> 34: 1 01001 34 835 1 0 0
#> 35: 1 01001 35 868 1 0 0
#> 36: 1 01001 36 923 1 0 0
#> 37: 1 01001 37 970 1 0 0
#> 38: 1 01001 38 1025 1 0 0
#> 39: 1 01001 39 1075 1 0 0
#> 40: 1 01001 40 1162 1 0 0
#> 41: 1 01001 41 1221 1 0 0
#> 42: 1 01001 42 1301 1 0 0
#> 43: 1 01001 43 1346 1 0 0
#> 44: 1 01001 44 1427 1 0 0
#> 45: 1 01001 45 1466 1 0 0
#> 46: 2 72153 242331 8174359 1 0 0
#> 47: 2 72153 242332 8174393 1 0 0
#> 48: 2 72153 242333 8174414 1 0 0
#> 49: 2 72153 242334 8174443 1 0 0
#> 50: 2 72153 242335 8174469 1 0 0
#> 51: 2 72153 242336 8174527 1 0 0
#> 52: 2 72153 242337 8174551 1 0 0
#> 53: 2 72153 242338 8174561 1 0 0
#> 54: 2 72153 242339 8174585 1 0 0
#> 55: 2 72153 242340 8174598 1 0 0
#> 56: 2 72153 242341 8174618 1 0 0
#> 57: 2 72153 242342 8174642 1 0 0
#> 58: 2 72153 242343 8174660 1 0 0
#> 59: 2 72153 242344 8174686 1 0 0
#> 60: 2 72153 242345 8174724 1 0 0
#> 61: 2 72153 242346 8174768 1 0 0
#> 62: 2 72153 242347 8174783 1 0 0
#> 63: 2 72153 242348 8174801 1 0 0
#> 64: 2 72153 242349 8174814 1 0 0
#> 65: 2 72153 242350 8174837 1 0 0
#> 66: 2 72153 242351 8174863 1 0 0
#> 67: 2 72153 242352 8174894 1 0 0
#> 68: 2 72153 242353 8174906 1 0 0
#> 69: 2 72153 242354 8174921 1 0 0
#> 70: 2 72153 242355 8174940 1 0 0
#> ejam_uniq_id countyfips bgid blockid blockwt distance distance_unadjusted
# Largest US Counties by ACS Population Totals:
topcounties = blockgroupstats[ , .(ST = ST[1], countypop = sum(pop)),
by = .(FIPS = substr(bgfips,1,5))][order(-countypop),][1:20, .(
CountyPopulation = prettyNum(countypop, big.mark = ","), FIPS, ST)]
myfips = topcounties$FIPS
# simplest map of top counties
map_shapes_leaflet(shapes = shapes_counties_from_countyfips(myfips))
#> Error in shapes_counties_from_countyfips(myfips): could not find function "shapes_counties_from_countyfips"
# simplest way to get and map results county by county
out_c1 = ejamit(fips = myfips)
#> Finding blocks in each FIPS Census unit.
#> Loading arrow datasets: blockid2fips
#> ❌ Token is invalid or expired. Resetting...
#> Arrow-format datasets (blocks, etc.) are up-to-date -- locally-installed and latest-released data repository versions match.
#> looking for blockid2fips in memory...
#> blockid2fips is loading from local folder ...done.
#>
#> Loading arrow datasets: bgid2fips
#> ❌ Token is invalid or expired. Resetting...
#> Arrow-format datasets (blocks, etc.) are up-to-date -- locally-installed and latest-released data repository versions match.
#> looking for bgid2fips in memory...
#> bgid2fips is loading from local folder ...done.
#>
#> Joining with `by = join_by(blockid)`
#> Aggregating at each FIPS Census unit and overall.
#> Loading arrow datasets: bgej
#> ❌ Token is invalid or expired. Resetting...
#> Arrow-format datasets (blocks, etc.) are up-to-date -- locally-installed and latest-released data repository versions match.
#> looking for bgej in memory...
#> bgej is loading from local folder ...done.
#>
#> loaded bgej data because include_ejindexes = TRUE
mapfastej_counties(out_c1$results_bysite)
#> Warning: need tidycensus package and census API key to use myservice = 'cartographic', so using default service instead
#> Reading layer `OGRGeoJSON' from data source
#> `https://services.arcgis.com/P3ePLMYs2RVChkJx/ArcGIS/rest/services/USA_Boundaries_2022/FeatureServer/2/query?where=FIPS%3D%2704013%27%20OR%20FIPS%3D%2706001%27%20OR%20FIPS%3D%2706037%27%20OR%20FIPS%3D%2706059%27%20OR%20FIPS%3D%2706065%27%20OR%20FIPS%3D%2706071%27%20OR%20FIPS%3D%2706073%27%20OR%20FIPS%3D%2706085%27%20OR%20FIPS%3D%2712011%27%20OR%20FIPS%3D%2712086%27%20OR%20FIPS%3D%2717031%27%20OR%20FIPS%3D%2726163%27%20OR%20FIPS%3D%2732003%27%20OR%20FIPS%3D%2736047%27%20OR%20FIPS%3D%2736081%27%20OR%20FIPS%3D%2748029%27%20OR%20FIPS%3D%2748113%27%20OR%20FIPS%3D%2748201%27%20OR%20FIPS%3D%2748439%27%20OR%20FIPS%3D%2753033%27&outFields=NAME%2CFIPS%2CSTATE_ABBR%2CSTATE_NAME%2CPOP_SQMI&returnGeometry=true&f=geojson'
#> using driver `GeoJSON'
#> Simple feature collection with 20 features and 5 fields
#> Geometry type: MULTIPOLYGON
#> Dimension: XY
#> Bounding box: xmin: -122.5279 ymin: 25.13742 xmax: -73.70017 ymax: 47.78058
#> Geodetic CRS: WGS 84
#> Warning: Some values were outside the color scale and will be treated as NA
# another way to get and map results county by county
s2b = counties_as_sites(myfips)
out_c2 = doaggregate(s2b)
#> *** For now, if sites2states_or_latlon is not provided to doaggregate(),
#> for circles covering 2 states, it will use state of nearest block,
#> and for Shapefiles spanning 2 States, will just use 1 of the States -
#> not selected by area or population, but just whatever happens to be first in the table.
#> This should only arise if not in shiny app and not using ejamit() and
#> sites2states_or_latlon was not provided to doaggregate()
# but without URLs/links to reports
bysite = out_c2$results_bysite
bysite$ejam_uniq_id <- myfips
mapfastej_counties(bysite)
#> Warning: need tidycensus package and census API key to use myservice = 'cartographic', so using default service instead
#> Reading layer `OGRGeoJSON' from data source
#> `https://services.arcgis.com/P3ePLMYs2RVChkJx/ArcGIS/rest/services/USA_Boundaries_2022/FeatureServer/2/query?where=FIPS%3D%2706037%27%20OR%20FIPS%3D%2717031%27%20OR%20FIPS%3D%2748201%27%20OR%20FIPS%3D%2704013%27%20OR%20FIPS%3D%2706073%27%20OR%20FIPS%3D%2706059%27%20OR%20FIPS%3D%2712086%27%20OR%20FIPS%3D%2736047%27%20OR%20FIPS%3D%2748113%27%20OR%20FIPS%3D%2706065%27%20OR%20FIPS%3D%2736081%27%20OR%20FIPS%3D%2732003%27%20OR%20FIPS%3D%2753033%27%20OR%20FIPS%3D%2706071%27%20OR%20FIPS%3D%2748439%27%20OR%20FIPS%3D%2748029%27%20OR%20FIPS%3D%2712011%27%20OR%20FIPS%3D%2706085%27%20OR%20FIPS%3D%2726163%27%20OR%20FIPS%3D%2706001%27&outFields=NAME%2CFIPS%2CSTATE_ABBR%2CSTATE_NAME%2CPOP_SQMI&returnGeometry=true&f=geojson'
#> using driver `GeoJSON'
#> Simple feature collection with 20 features and 5 fields
#> Geometry type: MULTIPOLYGON
#> Dimension: XY
#> Bounding box: xmin: -122.5279 ymin: 25.13742 xmax: -73.70017 ymax: 47.78058
#> Geodetic CRS: WGS 84
#> Warning: Some values were outside the color scale and will be treated as NA
# compare two specific counties:
counties_as_sites(c('01001','72153'))
#> ejam_uniq_id countyfips bgid blockid blockwt distance distance_unadjusted
#> <int> <char> <int> <int> <num> <num> <num>
#> 1: 1 01001 1 1 1 0 0
#> 2: 1 01001 2 27 1 0 0
#> 3: 1 01001 3 57 1 0 0
#> 4: 1 01001 4 71 1 0 0
#> 5: 1 01001 5 98 1 0 0
#> 6: 1 01001 6 119 1 0 0
#> 7: 1 01001 7 140 1 0 0
#> 8: 1 01001 8 156 1 0 0
#> 9: 1 01001 9 185 1 0 0
#> 10: 1 01001 10 214 1 0 0
#> 11: 1 01001 11 232 1 0 0
#> 12: 1 01001 12 261 1 0 0
#> 13: 1 01001 13 279 1 0 0
#> 14: 1 01001 14 290 1 0 0
#> 15: 1 01001 15 296 1 0 0
#> 16: 1 01001 16 303 1 0 0
#> 17: 1 01001 17 313 1 0 0
#> 18: 1 01001 18 329 1 0 0
#> 19: 1 01001 19 361 1 0 0
#> 20: 1 01001 20 371 1 0 0
#> 21: 1 01001 21 393 1 0 0
#> 22: 1 01001 22 422 1 0 0
#> 23: 1 01001 23 450 1 0 0
#> 24: 1 01001 24 503 1 0 0
#> 25: 1 01001 25 564 1 0 0
#> 26: 1 01001 26 594 1 0 0
#> 27: 1 01001 27 641 1 0 0
#> 28: 1 01001 28 669 1 0 0
#> 29: 1 01001 29 683 1 0 0
#> 30: 1 01001 30 708 1 0 0
#> 31: 1 01001 31 738 1 0 0
#> 32: 1 01001 32 759 1 0 0
#> 33: 1 01001 33 814 1 0 0
#> 34: 1 01001 34 835 1 0 0
#> 35: 1 01001 35 868 1 0 0
#> 36: 1 01001 36 923 1 0 0
#> 37: 1 01001 37 970 1 0 0
#> 38: 1 01001 38 1025 1 0 0
#> 39: 1 01001 39 1075 1 0 0
#> 40: 1 01001 40 1162 1 0 0
#> 41: 1 01001 41 1221 1 0 0
#> 42: 1 01001 42 1301 1 0 0
#> 43: 1 01001 43 1346 1 0 0
#> 44: 1 01001 44 1427 1 0 0
#> 45: 1 01001 45 1466 1 0 0
#> 46: 2 72153 242331 8174359 1 0 0
#> 47: 2 72153 242332 8174393 1 0 0
#> 48: 2 72153 242333 8174414 1 0 0
#> 49: 2 72153 242334 8174443 1 0 0
#> 50: 2 72153 242335 8174469 1 0 0
#> 51: 2 72153 242336 8174527 1 0 0
#> 52: 2 72153 242337 8174551 1 0 0
#> 53: 2 72153 242338 8174561 1 0 0
#> 54: 2 72153 242339 8174585 1 0 0
#> 55: 2 72153 242340 8174598 1 0 0
#> 56: 2 72153 242341 8174618 1 0 0
#> 57: 2 72153 242342 8174642 1 0 0
#> 58: 2 72153 242343 8174660 1 0 0
#> 59: 2 72153 242344 8174686 1 0 0
#> 60: 2 72153 242345 8174724 1 0 0
#> 61: 2 72153 242346 8174768 1 0 0
#> 62: 2 72153 242347 8174783 1 0 0
#> 63: 2 72153 242348 8174801 1 0 0
#> 64: 2 72153 242349 8174814 1 0 0
#> 65: 2 72153 242350 8174837 1 0 0
#> 66: 2 72153 242351 8174863 1 0 0
#> 67: 2 72153 242352 8174894 1 0 0
#> 68: 2 72153 242353 8174906 1 0 0
#> 69: 2 72153 242354 8174921 1 0 0
#> 70: 2 72153 242355 8174940 1 0 0
#> ejam_uniq_id countyfips bgid blockid blockwt distance distance_unadjusted
# Largest US Counties by ACS Population Totals:
topcounties = blockgroupstats[ , .(ST = ST[1], countypop = sum(pop)),
by = .(FIPS = substr(bgfips,1,5))][order(-countypop),][1:20, .(
CountyPopulation = prettyNum(countypop, big.mark = ","), FIPS, ST)]
myfips = topcounties$FIPS
# simplest map of top counties
map_shapes_leaflet(shapes = shapes_counties_from_countyfips(myfips))
#> Error in shapes_counties_from_countyfips(myfips): could not find function "shapes_counties_from_countyfips"
# simplest way to get and map results county by county
out_c1 = ejamit(fips = myfips)
#> Finding blocks in each FIPS Census unit.
#> Loading arrow datasets: blockid2fips
#> ❌ Token is invalid or expired. Resetting...
#> Arrow-format datasets (blocks, etc.) are up-to-date -- locally-installed and latest-released data repository versions match.
#> looking for blockid2fips in memory...
#> blockid2fips is loading from local folder ...done.
#>
#> Loading arrow datasets: bgid2fips
#> ❌ Token is invalid or expired. Resetting...
#> Arrow-format datasets (blocks, etc.) are up-to-date -- locally-installed and latest-released data repository versions match.
#> looking for bgid2fips in memory...
#> bgid2fips is loading from local folder ...done.
#>
#> Joining with `by = join_by(blockid)`
#> Aggregating at each FIPS Census unit and overall.
#> Loading arrow datasets: bgej
#> ❌ Token is invalid or expired. Resetting...
#> Arrow-format datasets (blocks, etc.) are up-to-date -- locally-installed and latest-released data repository versions match.
#> looking for bgej in memory...
#> bgej is loading from local folder ...done.
#>
#> loaded bgej data because include_ejindexes = TRUE
mapfastej_counties(out_c1$results_bysite)
#> Warning: need tidycensus package and census API key to use myservice = 'cartographic', so using default service instead
#> Reading layer `OGRGeoJSON' from data source
#> `https://services.arcgis.com/P3ePLMYs2RVChkJx/ArcGIS/rest/services/USA_Boundaries_2022/FeatureServer/2/query?where=FIPS%3D%2704013%27%20OR%20FIPS%3D%2706001%27%20OR%20FIPS%3D%2706037%27%20OR%20FIPS%3D%2706059%27%20OR%20FIPS%3D%2706065%27%20OR%20FIPS%3D%2706071%27%20OR%20FIPS%3D%2706073%27%20OR%20FIPS%3D%2706085%27%20OR%20FIPS%3D%2712011%27%20OR%20FIPS%3D%2712086%27%20OR%20FIPS%3D%2717031%27%20OR%20FIPS%3D%2726163%27%20OR%20FIPS%3D%2732003%27%20OR%20FIPS%3D%2736047%27%20OR%20FIPS%3D%2736081%27%20OR%20FIPS%3D%2748029%27%20OR%20FIPS%3D%2748113%27%20OR%20FIPS%3D%2748201%27%20OR%20FIPS%3D%2748439%27%20OR%20FIPS%3D%2753033%27&outFields=NAME%2CFIPS%2CSTATE_ABBR%2CSTATE_NAME%2CPOP_SQMI&returnGeometry=true&f=geojson'
#> using driver `GeoJSON'
#> Simple feature collection with 20 features and 5 fields
#> Geometry type: MULTIPOLYGON
#> Dimension: XY
#> Bounding box: xmin: -122.5279 ymin: 25.13742 xmax: -73.70017 ymax: 47.78058
#> Geodetic CRS: WGS 84
#> Warning: Some values were outside the color scale and will be treated as NA
# another way to get and map results county by county
s2b = counties_as_sites(myfips)
out_c2 = doaggregate(s2b)
#> *** For now, if sites2states_or_latlon is not provided to doaggregate(),
#> for circles covering 2 states, it will use state of nearest block,
#> and for Shapefiles spanning 2 States, will just use 1 of the States -
#> not selected by area or population, but just whatever happens to be first in the table.
#> This should only arise if not in shiny app and not using ejamit() and
#> sites2states_or_latlon was not provided to doaggregate()
# but without URLs/links to reports
bysite = out_c2$results_bysite
bysite$ejam_uniq_id <- myfips
mapfastej_counties(bysite)
#> Warning: need tidycensus package and census API key to use myservice = 'cartographic', so using default service instead
#> Reading layer `OGRGeoJSON' from data source
#> `https://services.arcgis.com/P3ePLMYs2RVChkJx/ArcGIS/rest/services/USA_Boundaries_2022/FeatureServer/2/query?where=FIPS%3D%2706037%27%20OR%20FIPS%3D%2717031%27%20OR%20FIPS%3D%2748201%27%20OR%20FIPS%3D%2704013%27%20OR%20FIPS%3D%2706073%27%20OR%20FIPS%3D%2706059%27%20OR%20FIPS%3D%2712086%27%20OR%20FIPS%3D%2736047%27%20OR%20FIPS%3D%2748113%27%20OR%20FIPS%3D%2706065%27%20OR%20FIPS%3D%2736081%27%20OR%20FIPS%3D%2732003%27%20OR%20FIPS%3D%2753033%27%20OR%20FIPS%3D%2706071%27%20OR%20FIPS%3D%2748439%27%20OR%20FIPS%3D%2748029%27%20OR%20FIPS%3D%2712011%27%20OR%20FIPS%3D%2706085%27%20OR%20FIPS%3D%2726163%27%20OR%20FIPS%3D%2706001%27&outFields=NAME%2CFIPS%2CSTATE_ABBR%2CSTATE_NAME%2CPOP_SQMI&returnGeometry=true&f=geojson'
#> using driver `GeoJSON'
#> Simple feature collection with 20 features and 5 fields
#> Geometry type: MULTIPOLYGON
#> Dimension: XY
#> Bounding box: xmin: -122.5279 ymin: 25.13742 xmax: -73.70017 ymax: 47.78058
#> Geodetic CRS: WGS 84
#> Warning: Some values were outside the color scale and will be treated as NA