Barplot of ratios of residential population (or other) scores to averages - simpler syntax
Source:R/plot_barplot_ratios.R
ejam2barplot.RdBarplot of ratios of residential population (or other) scores to averages - simpler syntax
Helper - Barplot of ratios of indicators (at a site or all sites overall) to US or State average
helper - Barplot of ratios of residential population percentages (or other scores) to averages (or other references)
Usage
ejam2barplot(
ejamitout,
varnames = c(names_d_ratio_to_avg, names_d_subgroups_ratio_to_avg),
sitenumber = NULL,
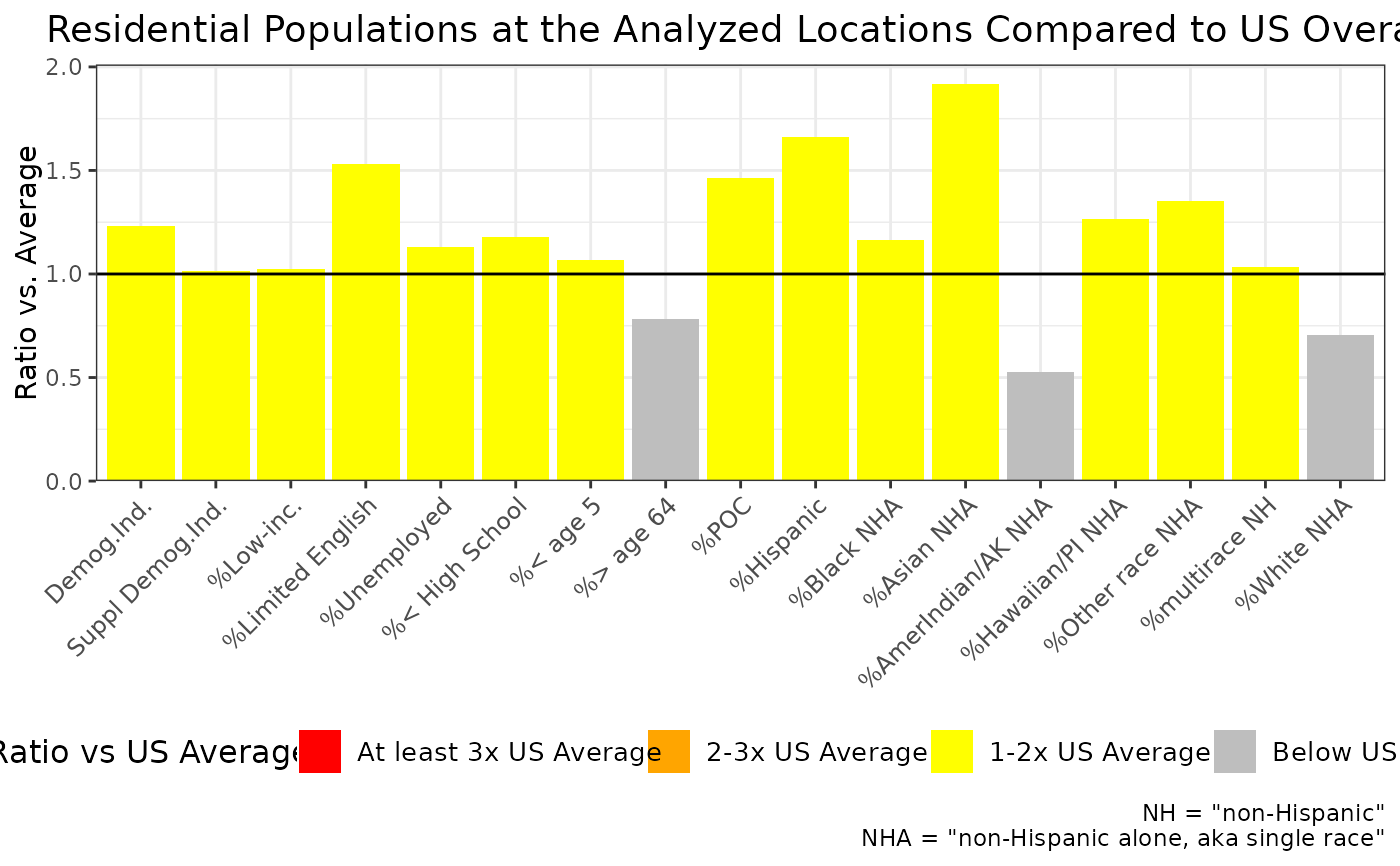
main = "Residential Populations at the Analyzed Locations Compared to US Overall",
...
)
plot_barplot_ratios_ez(
out,
varnames = c(names_d_ratio_to_avg, names_d_subgroups_ratio_to_avg),
main = "Residential Populations at the Analyzed Locations Compared to US Overall",
single_location = FALSE,
row_index = NULL,
...
)
plot_barplot_ratios(
ratio.to.us.d.overall,
shortlabels = NULL,
mycolorsavailable = c("gray", "yellow", "orange", "red"),
main = "Residential Populations at the Analyzed Locations Compared to US Overall",
ylab = "Ratio vs. Average",
caption = "NH = \"non-Hispanic\"\nNHA = \"non-Hispanic alone, aka single race\""
)Arguments
- ejamitout
like from
ejamit()- varnames
vector of indicator names that are ratios to avg, like c(names_d_ratio_to_avg , names_d_subgroups_ratio_to_avg) but could be c(names_d_ratio_to_state_avg , names_d_subgroups_ratio_to_state_avg)
- sitenumber
default is all sites from ejamitout$results_overall, and if an integer, it is the row number to show from ejamitout$results_bysite. Important: note this is the row number which is NOT necessarily the same as the ejamitout$results_bysite$ejam_uniq_id
- main
optional, title for plot, like "Stats at the Analyzed Locations Compared to US Overall"
- ...
passed to plot_barplot_ratios()
- out
the list of tables that is the output of ejamit() or a related function
- single_location
set to TRUE if using row_index to view one site, set to FALSE to view overall results from out$results_overall
- row_index
the number of the row to use from out$results_bysite
- ratio.to.us.d.overall
named list of a few ratios to plot, but see
ejam2barplot()for an easier way to specify which indicator to show.- shortlabels
optional, names to use for plot - should be same length as named list ratio.to.us.d.overall
- mycolorsavailable
optional (best to leave as default)
- ylab
optional, label for y axis
- caption
text for a key defining some terms that are abbreviations
Details
Used by and similar to ejam2barplot(), which is an easier way to do this!
This function requires you to specify single_location = TRUE when
using the row_index param. The ejam2barplot() function just uses a sitenumber parameter.
This function is more flexible than plot_barplot_ratios(), which it relies on,
since this lets you specify
whether to use overall results from ejamit()$results_overall
or just one site from ejamit()$results_bysite
If the parameter called main has the word "State" in it, then the legend will refer to "State Average" instead of "US Average"
See also
ejam2ratios() ejam2barplot() plot_barplot_ratios_ez() table_xls_format()
Examples
# Check a long list of indicators for any that are elevated
out <- testoutput_ejamit_100pts_1miles
ejam2barplot(out,
varnames = names_these_ratio_to_avg,
main = "Envt & Demog Indicators at Selected Sites Compared to State Averages")
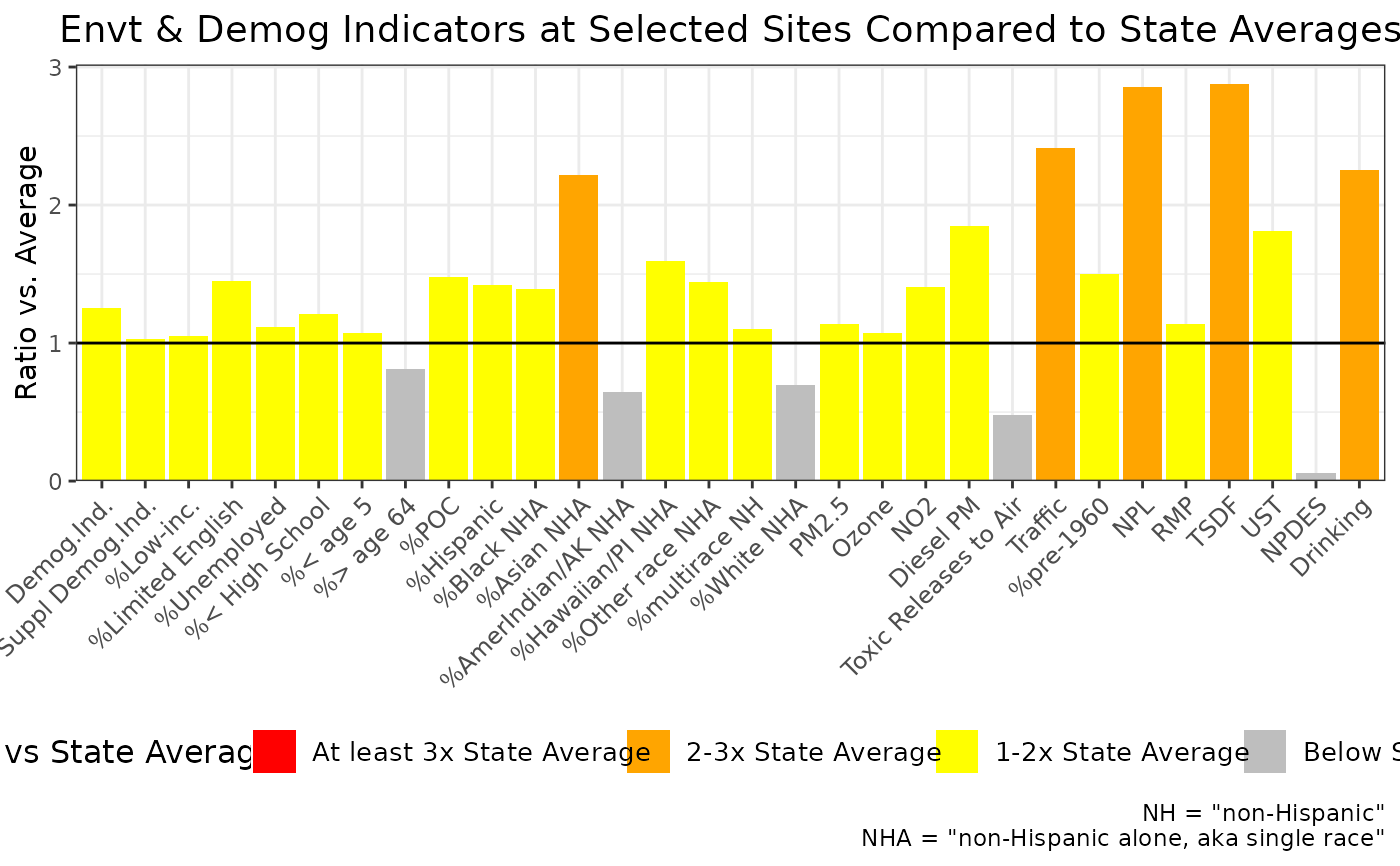 ejam2barplot(out,
varnames = names_these_ratio_to_state_avg,
main = "Envt & Demog Indicators at Selected Sites Compared to State Averages")
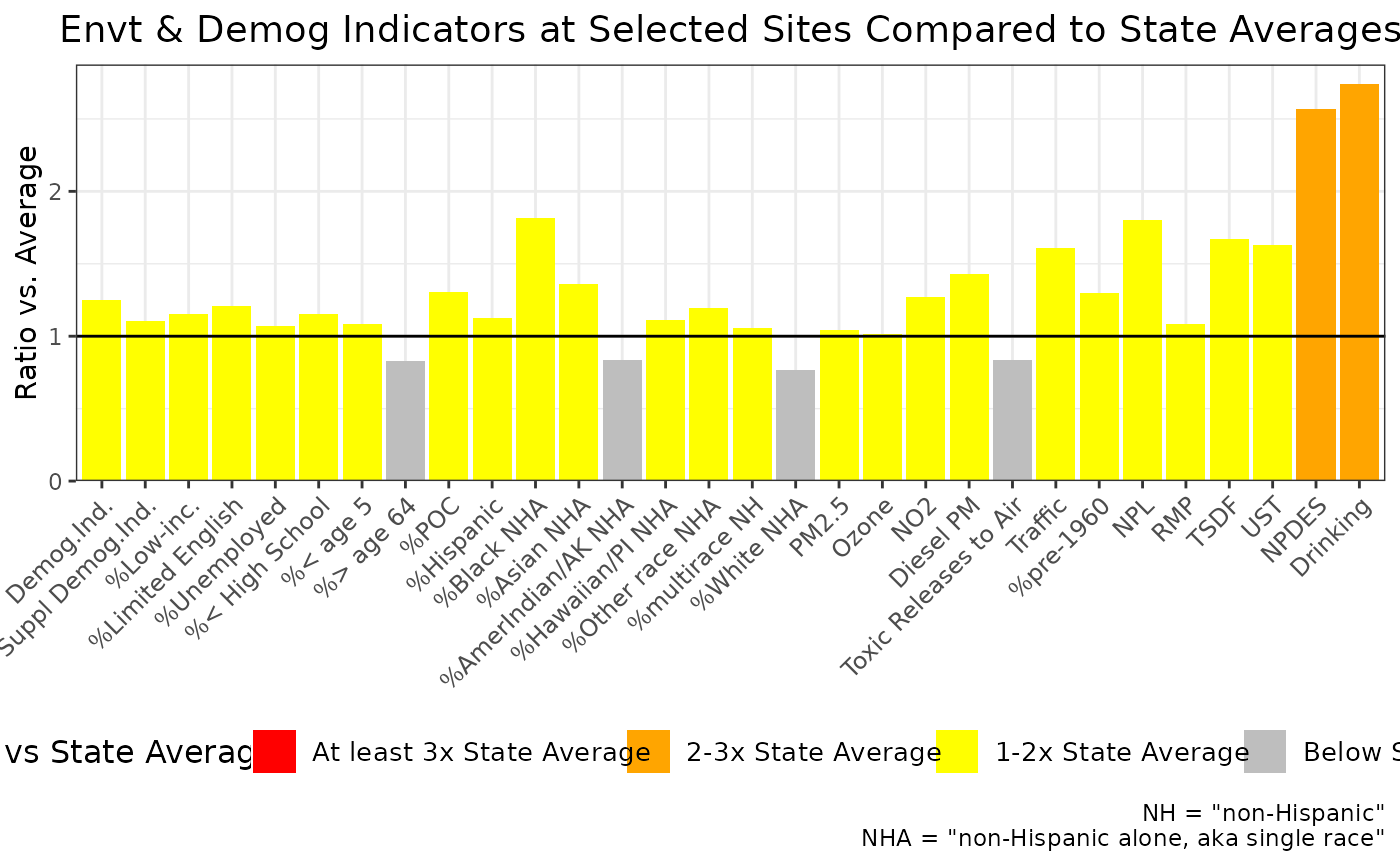
ejam2barplot(out,
varnames = names_these_ratio_to_state_avg,
main = "Envt & Demog Indicators at Selected Sites Compared to State Averages")
 # Residential population percentages only
# vs nationwide avg
ejam2barplot(out)
# Residential population percentages only
# vs nationwide avg
ejam2barplot(out)
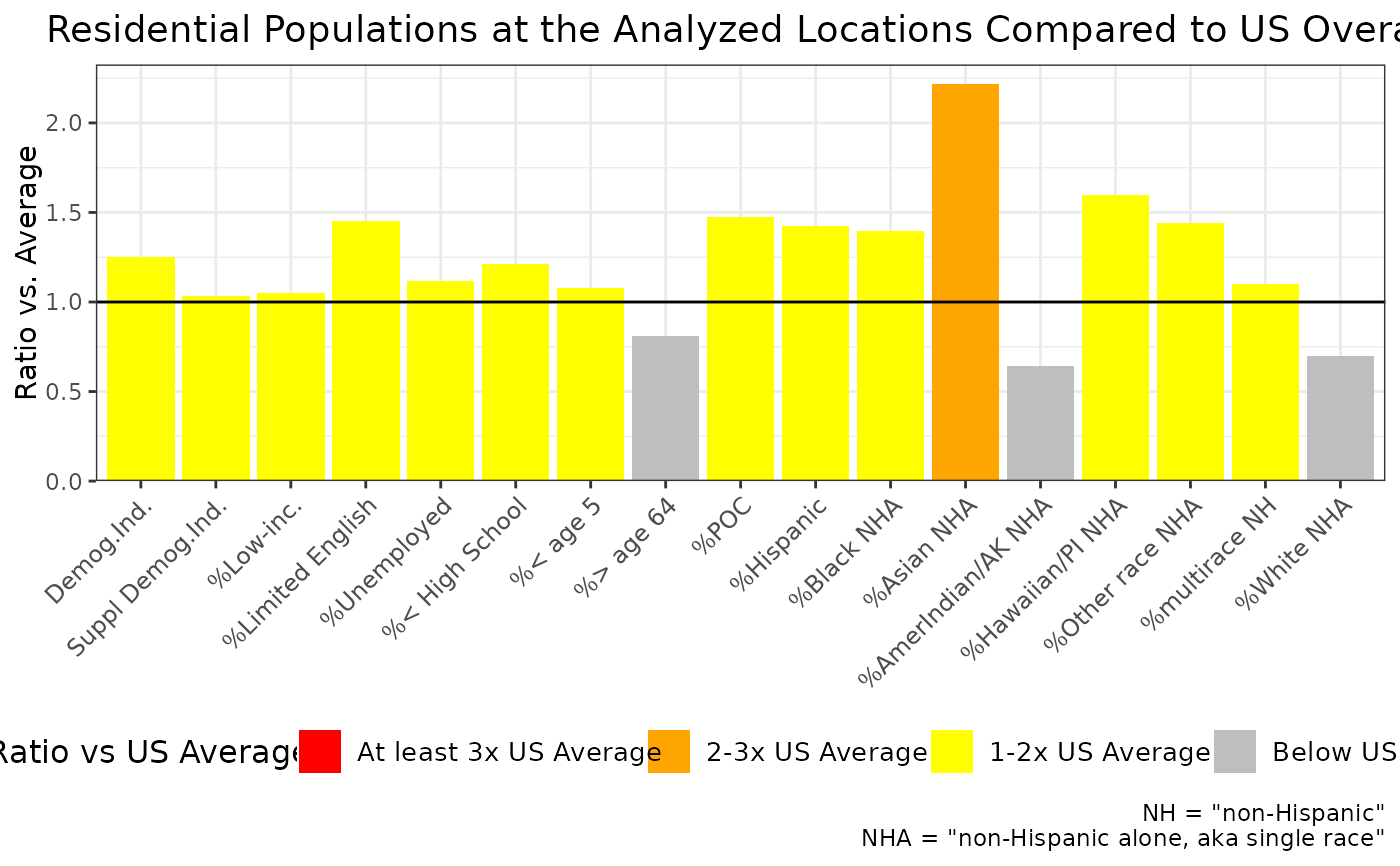 # vs statewide avg
ejam2barplot(out,
varnames = c(names_d_ratio_to_state_avg, names_d_subgroups_ratio_to_state_avg),
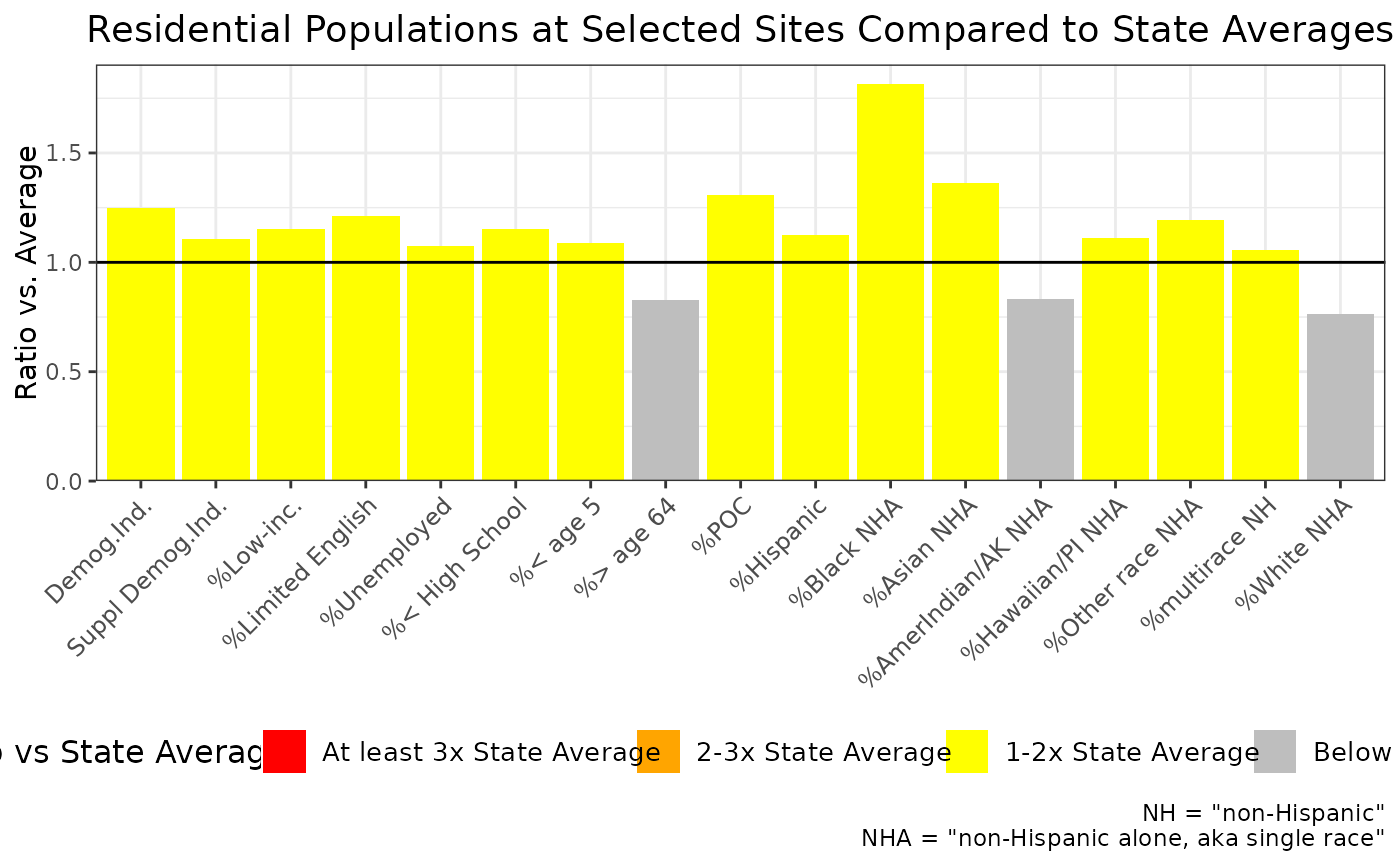
main = "Residential Populations at Selected Sites Compared to State Averages")
# vs statewide avg
ejam2barplot(out,
varnames = c(names_d_ratio_to_state_avg, names_d_subgroups_ratio_to_state_avg),
main = "Residential Populations at Selected Sites Compared to State Averages")
 # Environmental only
ejam2barplot(out,
varnames = c(names_e_ratio_to_avg, names_e_ratio_to_state_avg),
main = "Environmental Indicators at Selected Sites Compared to Averages")
#> Error in `levels<-`(`*tmp*`, value = as.character(levels)): factor level [14] is duplicated
## select your own ratio-type indicators that are available
## -- and you could see the range of available ratio indicators like this:
if (FALSE) { # \dontrun{
varinfo(
grep("ratio",
names(testoutput_ejamit_10pts_1miles$results_overall),
value = TRUE),
info = c("varlist", "shortname")
)
} # }
# helper functions related to ejam2barplot()
plot_barplot_ratios_ez(
out,
varnames = c(names_d_ratio_to_avg , names_d_subgroups_ratio_to_avg)
)
# Environmental only
ejam2barplot(out,
varnames = c(names_e_ratio_to_avg, names_e_ratio_to_state_avg),
main = "Environmental Indicators at Selected Sites Compared to Averages")
#> Error in `levels<-`(`*tmp*`, value = as.character(levels)): factor level [14] is duplicated
## select your own ratio-type indicators that are available
## -- and you could see the range of available ratio indicators like this:
if (FALSE) { # \dontrun{
varinfo(
grep("ratio",
names(testoutput_ejamit_10pts_1miles$results_overall),
value = TRUE),
info = c("varlist", "shortname")
)
} # }
# helper functions related to ejam2barplot()
plot_barplot_ratios_ez(
out,
varnames = c(names_d_ratio_to_avg , names_d_subgroups_ratio_to_avg)
)
 # same plot but with function that would need more work to format inputs:
plot_barplot_ratios(
unlist(out$results_overall[ ,
c(..names_d_ratio_to_avg , ..names_d_subgroups_ratio_to_avg) ])
)
# same plot but with function that would need more work to format inputs:
plot_barplot_ratios(
unlist(out$results_overall[ ,
c(..names_d_ratio_to_avg , ..names_d_subgroups_ratio_to_avg) ])
)