Cape Cod - Detailed step-by-step
Standardize, clean and wrangle Water Quality Portal data in Cape Cod into more analytic-ready formats using the harmonize_wq package
US EPA’s Water Quality Portal (WQP) aggregates water quality, biological, and physical data provided by many organizations and has become an essential resource with tools to query and retrieval data using python or R. Given the variety of data and variety of data originators, using the data in analysis often requires data cleaning to ensure it meets the required quality standards and data wrangling to get it in a more analytic-ready format. Recognizing the definition of analysis-ready varies depending on the analysis, the harmonixe_wq package is intended to be a flexible water quality specific framework to help:
Identify differences in data units (including speciation and basis)
Identify differences in sampling or analytic methods
Resolve data errors using transparent assumptions
Reduce data to the columns that are most commonly needed
Transform data from long to wide format
Domain experts must decide what data meets their quality standards for data comparability and any thresholds for acceptance or rejection.
Detailed step-by-step workflow
This example workflow takes a deeper dive into some of the expanded functionality to examine results for different water quality parameters in Cape Cod
Install and import the required libraries
[1]:
import sys
#! python -m pip uninstall harmonize-wq --yes
# Use pip to install the package from pypi or the latest from github
#!{sys.executable} -m pip install harmonize-wq
# For latest dev version
#!{sys.executable} -m pip install git+https://github.com/USEPA/harmonize-wq.git
[2]:
import dataretrieval.wqp as wqp
from harmonize_wq import wrangle
from harmonize_wq import location
from harmonize_wq import harmonize
from harmonize_wq import visualize
from harmonize_wq import clean
Download location data using dataretrieval
[3]:
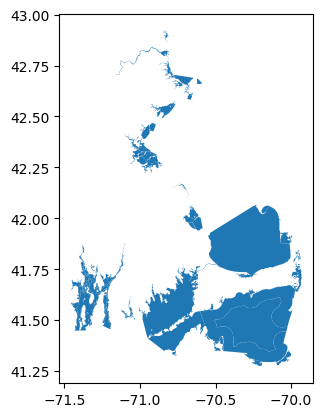
# Read geometry for Area of Interest from geojson file url and plot
aoi_url = 'https://github.com/jbousquin/test_notebook/raw/main/temperature_data/NewEngland.geojson'
aoi_gdf = wrangle.as_gdf(aoi_url)  # Already 4326 standard
aoi_gdf.plot()
[3]:
<Axes: >
[4]:
# Build query with characteristicNames and the AOI extent
query = {'characteristicName': ['Phosphorus',
                                'Temperature, water',
                                'Depth, Secchi disk depth',
                                'Dissolved oxygen (DO)',
                                'Salinity',
                                'pH',
                                'Nitrogen',
                                'Conductivity',
                                'Organic carbon',
                                'Chlorophyll a',
                                'Turbidity',
                                'Sediment',
                                'Fecal Coliform',
                                'Escherichia coli']}
query['bBox'] = wrangle.get_bounding_box(aoi_gdf)
[5]:
# Query stations (can be slow)
stations, site_md = wqp.what_sites(**query)
[6]:
# Rows and columns for results
stations.shape
[6]:
(9608, 37)
[7]:
# First 5 rows
stations.head()
[7]:
| OrganizationIdentifier | OrganizationFormalName | MonitoringLocationIdentifier | MonitoringLocationName | MonitoringLocationTypeName | MonitoringLocationDescriptionText | HUCEightDigitCode | DrainageAreaMeasure/MeasureValue | DrainageAreaMeasure/MeasureUnitCode | ContributingDrainageAreaMeasure/MeasureValue | ... | AquiferName | LocalAqfrName | FormationTypeText | AquiferTypeName | ConstructionDateText | WellDepthMeasure/MeasureValue | WellDepthMeasure/MeasureUnitCode | WellHoleDepthMeasure/MeasureValue | WellHoleDepthMeasure/MeasureUnitCode | ProviderName | |
|---|---|---|---|---|---|---|---|---|---|---|---|---|---|---|---|---|---|---|---|---|---|
| 0 | USGS-MA | USGS Massachusetts Water Science Center | USGS-010965305 | MERRIMACK R NR TYNGSBOROUGH BRIDGE TYNGSBOROUG... | Stream | NaN | 01070006 | 4070.00 | sq mi | NaN | ... | NaN | NaN | NaN | NaN | NaN | NaN | NaN | NaN | NaN | NWIS |
| 1 | USGS-MA | USGS Massachusetts Water Science Center | USGS-01096544 | STONY BROOK AT SCHOOL STREET AT CHELMSFORD, MA | Stream | NaN | 01070006 | 41.57 | sq mi | NaN | ... | NaN | NaN | NaN | NaN | NaN | NaN | NaN | NaN | NaN | NWIS |
| 2 | USGS-MA | USGS Massachusetts Water Science Center | USGS-01096546 | STONY BROOK AT CHELMSFORD, MA | Stream | NaN | 01070006 | 43.60 | sq mi | NaN | ... | NaN | NaN | NaN | NaN | NaN | NaN | NaN | NaN | NaN | NWIS |
| 3 | USGS-MA | USGS Massachusetts Water Science Center | USGS-01096548 | STONY BROOK AT N CHELMSFORD, MA | Stream | NaN | 01070006 | NaN | NaN | NaN | ... | NaN | NaN | NaN | NaN | NaN | NaN | NaN | NaN | NaN | NWIS |
| 4 | USGS-MA | USGS Massachusetts Water Science Center | USGS-01096550 | MERRIMACK RIVER ABOVE LOWELL, MA | Stream | NaN | 01070006 | 3900.00 | sq mi | 3900.0 | ... | NaN | NaN | NaN | NaN | NaN | NaN | NaN | NaN | NaN | NWIS |
5 rows × 37 columns
[8]:
# Columns used for an example row
stations.iloc[0][['HorizontalCoordinateReferenceSystemDatumName', 'LatitudeMeasure', 'LongitudeMeasure']]
[8]:
HorizontalCoordinateReferenceSystemDatumName        NAD83
LatitudeMeasure                                 42.677389
LongitudeMeasure                               -71.421056
Name: 0, dtype: object
[9]:
# Harmonize location datums to 4326 (Note we keep intermediate columns using intermediate_columns=True)
stations_gdf = location.harmonize_locations(stations, outEPSG=4326, intermediate_columns=True)
[10]:
# Every function has a dostring to help understand input/output and what it does
location.harmonize_locations?
[11]:
# Rows and columns for results after running the function (5 new columns, only 2 new if intermediate_columns=False)
stations_gdf.shape
[11]:
(9608, 42)
[12]:
# Example results for the new columns
stations_gdf.iloc[0][['geom_orig', 'EPSG', 'QA_flag', 'geom', 'geometry']]
[12]:
geom_orig         (-71.4210556, 42.67738889)
EPSG                                  4269.0
QA_flag                                 <NA>
geom         POINT (-71.4210556 42.67738889)
geometry     POINT (-71.4210556 42.67738889)
Name: 0, dtype: object
[13]:
# geom and geometry look the same but geometry is a special datatype
stations_gdf['geometry'].dtype
[13]:
<geopandas.array.GeometryDtype at 0x7f228f5c5790>
[14]:
# Look at the different QA_flag flags that have been assigned,
# e.g., for bad datums or limited decimal precision
set(stations_gdf.loc[stations_gdf['QA_flag'].notna()]['QA_flag'])
[14]:
{'HorizontalCoordinateReferenceSystemDatumName: Bad datum OTHER, EPSG:4326 assumed',
 'HorizontalCoordinateReferenceSystemDatumName: Bad datum UNKWN, EPSG:4326 assumed',
 'LatitudeMeasure: Imprecise: lessthan3decimaldigits',
 'LatitudeMeasure: Imprecise: lessthan3decimaldigits; LongitudeMeasure: Imprecise: lessthan3decimaldigits',
 'LongitudeMeasure: Imprecise: lessthan3decimaldigits'}
[15]:
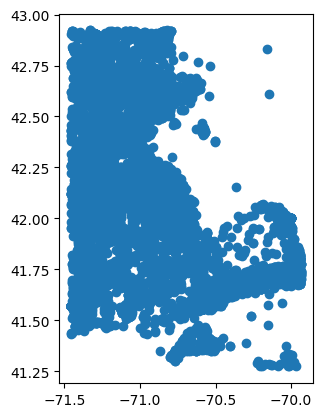
# Map it
stations_gdf.plot()
[15]:
<Axes: >
[16]:
# Clip to area of interest
stations_clipped = wrangle.clip_stations(stations_gdf, aoi_gdf)
[17]:
# Map it
stations_clipped.plot()
[17]:
<Axes: >
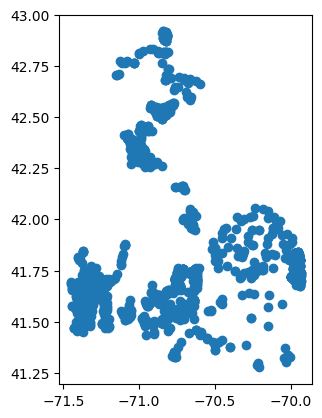
[18]:
# How many stations now?
len(stations_clipped)
[18]:
1860
[19]:
# To save the results to a shapefile
#import os
#path = ''  #specify the path (folder/directory) to save it to
#stations_clipped.to_file(os.path.join(path,'CapeCod_stations.shp'))
Retrieve Characteristic Data
[20]:
# Now query for results
query['dataProfile'] = 'narrowResult'
res_narrow, md_narrow = wqp.get_results(**query)
[21]:
df = res_narrow
df
[21]:
| OrganizationIdentifier | OrganizationFormalName | ActivityIdentifier | ActivityStartDate | ActivityStartTime/Time | ActivityStartTime/TimeZoneCode | MonitoringLocationIdentifier | ResultIdentifier | DataLoggerLine | ResultDetectionConditionText | ... | ResultDetectionQuantitationLimitUrl | LaboratoryAccreditationIndicator | LaboratoryAccreditationAuthorityName | TaxonomistAccreditationIndicator | TaxonomistAccreditationAuthorityName | LabSamplePreparationUrl | ProviderName | ActivityStartDateTime | AnalysisStartDateTime | AnalysisEndDateTime | |
|---|---|---|---|---|---|---|---|---|---|---|---|---|---|---|---|---|---|---|---|---|---|
| 0 | USGS-MA | USGS Massachusetts Water Science Center | nwisma.01.90100001 | 1901-08-09 | 09:00:00 | EST | USGS-01116500 | NWIS-66459398 | NaN | NaN | ... | NaN | NaN | NaN | NaN | NaN | NaN | NWIS | 1901-08-09 14:00:00+00:00 | NaT | NaT |
| 1 | USGS-MA | USGS Massachusetts Water Science Center | nwisma.01.90100001 | 1901-08-09 | 09:00:00 | EST | USGS-01116500 | NWIS-66459396 | NaN | NaN | ... | NaN | NaN | NaN | NaN | NaN | NaN | NWIS | 1901-08-09 14:00:00+00:00 | NaT | NaT |
| 2 | USGS-MA | USGS Massachusetts Water Science Center | nwisma.01.90100001 | 1901-08-09 | 09:00:00 | EST | USGS-01116500 | NWIS-66459391 | NaN | NaN | ... | NaN | NaN | NaN | NaN | NaN | NaN | NWIS | 1901-08-09 14:00:00+00:00 | NaT | NaT |
| 3 | USGS-MA | USGS Massachusetts Water Science Center | nwisma.01.95300021 | 1952-10-21 | 09:00:00 | EST | USGS-01104500 | NWIS-66461873 | NaN | NaN | ... | NaN | NaN | NaN | NaN | NaN | NaN | NWIS | 1952-10-21 14:00:00+00:00 | NaT | NaT |
| 4 | USGS-MA | USGS Massachusetts Water Science Center | nwisma.01.95300023 | 1952-10-24 | 11:45:00 | EST | USGS-01108000 | NWIS-66461945 | NaN | NaN | ... | NaN | NaN | NaN | NaN | NaN | NaN | NWIS | 1952-10-24 16:45:00+00:00 | NaT | NaT |
| ... | ... | ... | ... | ... | ... | ... | ... | ... | ... | ... | ... | ... | ... | ... | ... | ... | ... | ... | ... | ... | ... |
| 488897 | 11NPSWRD_WQX | National Park Service Water Resources Division | 11NPSWRD_WQX-CACO_DUCK_W_19560816_731708 | 1956-08-16 | NaN | NaN | 11NPSWRD_WQX-CACO_DUCK_W | STORET-740598866 | NaN | NaN | ... | https://www.waterqualitydata.us/data/providers... | NaN | NaN | NaN | NaN | NaN | STORET | NaT | NaT | NaT |
| 488898 | 11NPSWRD_WQX | National Park Service Water Resources Division | 11NPSWRD_WQX-CACO_DUCK_W_19560616_731704 | 1956-06-16 | NaN | NaN | 11NPSWRD_WQX-CACO_DUCK_W | STORET-740598862 | NaN | NaN | ... | https://www.waterqualitydata.us/data/providers... | NaN | NaN | NaN | NaN | NaN | STORET | NaT | NaT | NaT |
| 488899 | 11NPSWRD_WQX | National Park Service Water Resources Division | 11NPSWRD_WQX-CACO_DUCK_W_19560701_731705 | 1956-07-01 | NaN | NaN | 11NPSWRD_WQX-CACO_DUCK_W | STORET-740598863 | NaN | NaN | ... | https://www.waterqualitydata.us/data/providers... | NaN | NaN | NaN | NaN | NaN | STORET | NaT | NaT | NaT |
| 488900 | 11NPSWRD_WQX | National Park Service Water Resources Division | 11NPSWRD_WQX-CACO_GREAT_W_19550816_731703 | 1955-08-16 | NaN | NaN | 11NPSWRD_WQX-CACO_GREAT_W | STORET-740649462 | NaN | NaN | ... | https://www.waterqualitydata.us/data/providers... | NaN | NaN | NaN | NaN | NaN | STORET | NaT | NaT | NaT |
| 488901 | 11NPSWRD_WQX | National Park Service Water Resources Division | 11NPSWRD_WQX-CACO_SLOUGH_19520816_731702 | 1952-08-16 | NaN | NaN | 11NPSWRD_WQX-CACO_SLOUGH | STORET-740745800 | NaN | Not Detected | ... | https://www.waterqualitydata.us/data/providers... | NaN | NaN | NaN | NaN | NaN | STORET | NaT | NaT | NaT |
488902 rows × 81 columns
[22]:
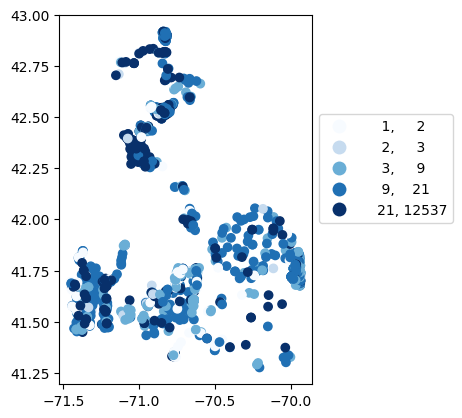
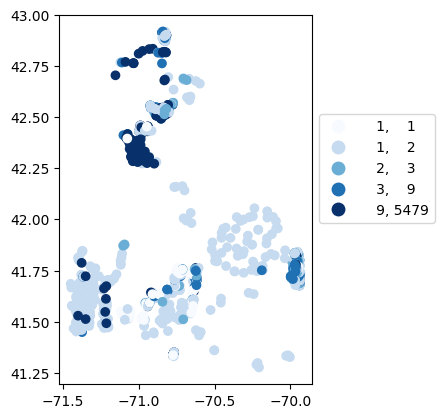
# Map number of usable results at each station
gdf_count = visualize.map_counts(df, stations_clipped)
legend_kwds = {"fmt": "{:.0f}", 'bbox_to_anchor':(1, 0.75)}
gdf_count.plot(column='cnt', cmap='Blues', legend=True, scheme='quantiles', legend_kwds=legend_kwds)
[22]:
<Axes: >
Harmonize Characteristic Results
Two options for functions to harmonize characteristics: harmonize_all() or harmonize_generic(). harmonize_all runs functions on all characteristics and lets you specify how to handle errors harmonize_generic runs functions only on the characteristic specified with char_val and lets you also choose output units, to keep intermediate columns and to do a quick report summarizing changes.
[23]:
# See Documentation
#harmonize_WQP.harmonize_all?
#harmonize_WQP.harmonize?
secchi disk depth
[24]:
# Each harmonize function has optional params, e.g., char_val is the characticName column value to use so we can send the entire df.
# Optional params: units='m', char_val='Depth, Secchi disk depth', out_col='Secchi', report=False)
# We start by demonstrating on secchi disk depth (units default to m, keep intermediate fields, see report)
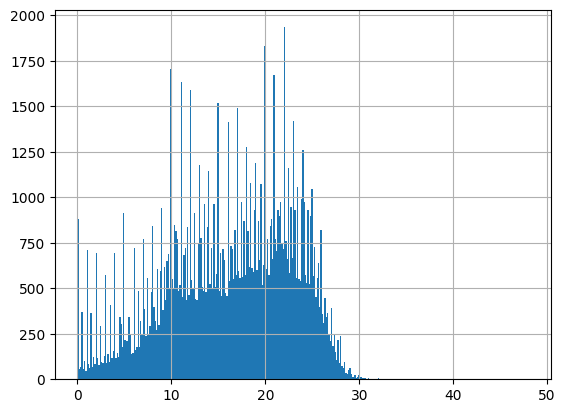
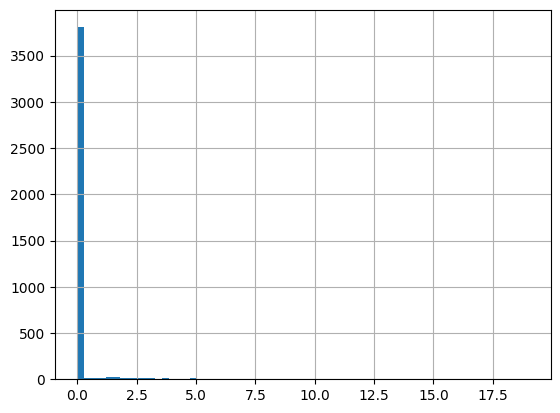
df = harmonize.harmonize(df, "Depth, Secchi disk depth", errors="ignore", intermediate_columns=True, report=True)
-Usable results-
count    8961.000000
mean       -5.920774
std       298.744632
min     -9999.000000
25%         1.400000
50%         2.000000
75%         3.962400
max        27.000000
dtype: float64
Unusable results: 2231
Usable results with inferred units: 8
Results outside threshold (0.0 to 1786.547021): 16
/opt/hostedtoolcache/Python/3.11.15/x64/lib/python3.11/site-packages/harmonize_wq/convert.py:131: UserWarning: WARNING: '%' converted to NaN
  warn(f"WARNING: '{unit}' converted to NaN")
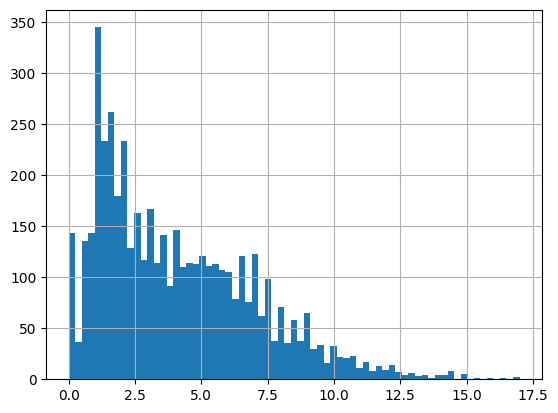
The threshold is based on standard deviations and is currently only used in the histogram.
[25]:
# Look at a table of just Secchi results and focus on subset of columns
cols = ['MonitoringLocationIdentifier', 'ResultMeasureValue', 'ResultMeasure/MeasureUnitCode', 'QA_flag', 'Units']
sechi_results = df.loc[df['CharacteristicName']=='Depth, Secchi disk depth', cols + ['Secchi']]
sechi_results
[25]:
| MonitoringLocationIdentifier | ResultMeasureValue | ResultMeasure/MeasureUnitCode | QA_flag | Units | Secchi | |
|---|---|---|---|---|---|---|
| 10030 | 11NPSWRD_WQX-SAMA_MEQ76_SB03 | 6.5 | ft | <NA> | ft | 1.9811999999999999 meter |
| 10048 | 11NPSWRD_WQX-SAMA_MEQ76_SB06 | 13.0 | ft | <NA> | ft | 3.9623999999999997 meter |
| 10080 | 11NPSWRD_WQX-SAMA_MEQ76_SB01 | 11.5 | ft | <NA> | ft | 3.5051999999999994 meter |
| 10100 | 11NPSWRD_WQX-SAMA_MEQ76_SB03 | 20.0 | ft | <NA> | ft | 6.095999999999999 meter |
| 10117 | 11NPSWRD_WQX-SAMA_MEQ76_SB05 | 11.0 | ft | <NA> | ft | 3.3527999999999993 meter |
| ... | ... | ... | ... | ... | ... | ... |
| 488897 | 11NPSWRD_WQX-CACO_DUCK_W | 10 | m | <NA> | m | 10.0 meter |
| 488898 | 11NPSWRD_WQX-CACO_DUCK_W | 17 | m | <NA> | m | 17.0 meter |
| 488899 | 11NPSWRD_WQX-CACO_DUCK_W | 16 | m | <NA> | m | 16.0 meter |
| 488900 | 11NPSWRD_WQX-CACO_GREAT_W | 7.8 | m | <NA> | m | 7.8 meter |
| 488901 | 11NPSWRD_WQX-CACO_SLOUGH | NaN | m | ResultMeasureValue: missing (NaN) result | m | NaN |
11192 rows × 6 columns
[26]:
# Look at unusable(NAN) results
sechi_results.loc[df['Secchi'].isna()]
[26]:
| MonitoringLocationIdentifier | ResultMeasureValue | ResultMeasure/MeasureUnitCode | QA_flag | Units | Secchi | |
|---|---|---|---|---|---|---|
| 25333 | 11113300-02-IPB | BV | m | ResultMeasureValue: "BV" result cannot be used | m | NaN |
| 30518 | 11113300-07A-MER | BV | m | ResultMeasureValue: "BV" result cannot be used | m | NaN |
| 95498 | 11113300-GRTKINSD | =3.4 | m | ResultMeasureValue: "=3.4" result cannot be used | m | NaN |
| 96430 | 11113300-CUBSDND | =1.7 | m | ResultMeasureValue: "=1.7" result cannot be used | m | NaN |
| 96526 | 11113300-CUBLDVLD | =1.4 | m | ResultMeasureValue: "=1.4" result cannot be used | m | NaN |
| ... | ... | ... | ... | ... | ... | ... |
| 483301 | 11NPSWRD_WQX-CACO_GREAT_W | NaN | m | ResultMeasureValue: missing (NaN) result | m | NaN |
| 483697 | 11NPSWRD_WQX-CACO_GREAT_W | NaN | m | ResultMeasureValue: missing (NaN) result | m | NaN |
| 485023 | 11113300-DARLITD | NaN | NaN | ResultMeasureValue: missing (NaN) result; Resu... | m | NaN |
| 486321 | 11113300-WORSALD | NaN | NaN | ResultMeasureValue: missing (NaN) result; Resu... | m | NaN |
| 488901 | 11NPSWRD_WQX-CACO_SLOUGH | NaN | m | ResultMeasureValue: missing (NaN) result | m | NaN |
2231 rows × 6 columns
[27]:
# look at the QA flag for first row from above
list(sechi_results.loc[df['Secchi'].isna()]['QA_flag'])[0]
[27]:
'ResultMeasureValue: "BV" result cannot be used'
[28]:
# All cases where there was a QA flag
sechi_results.loc[df['QA_flag'].notna()]
[28]:
| MonitoringLocationIdentifier | ResultMeasureValue | ResultMeasure/MeasureUnitCode | QA_flag | Units | Secchi | |
|---|---|---|---|---|---|---|
| 25333 | 11113300-02-IPB | BV | m | ResultMeasureValue: "BV" result cannot be used | m | NaN |
| 30518 | 11113300-07A-MER | BV | m | ResultMeasureValue: "BV" result cannot be used | m | NaN |
| 95498 | 11113300-GRTKINSD | =3.4 | m | ResultMeasureValue: "=3.4" result cannot be used | m | NaN |
| 96430 | 11113300-CUBSDND | =1.7 | m | ResultMeasureValue: "=1.7" result cannot be used | m | NaN |
| 96526 | 11113300-CUBLDVLD | =1.4 | m | ResultMeasureValue: "=1.4" result cannot be used | m | NaN |
| ... | ... | ... | ... | ... | ... | ... |
| 483301 | 11NPSWRD_WQX-CACO_GREAT_W | NaN | m | ResultMeasureValue: missing (NaN) result | m | NaN |
| 483697 | 11NPSWRD_WQX-CACO_GREAT_W | NaN | m | ResultMeasureValue: missing (NaN) result | m | NaN |
| 485023 | 11113300-DARLITD | NaN | NaN | ResultMeasureValue: missing (NaN) result; Resu... | m | NaN |
| 486321 | 11113300-WORSALD | NaN | NaN | ResultMeasureValue: missing (NaN) result; Resu... | m | NaN |
| 488901 | 11NPSWRD_WQX-CACO_SLOUGH | NaN | m | ResultMeasureValue: missing (NaN) result | m | NaN |
1273 rows × 6 columns
If both value and unit are missing nothing can be done, a unitless (NaN) value is assumed as to be in default units but a QA_flag is added
[29]:
# Aggregate secchi data by station
visualize.station_summary(sechi_results, 'Secchi')
[29]:
| MonitoringLocationIdentifier | cnt | mean | |
|---|---|---|---|
| 0 | 11113300-ANGSDND | 45 | 3.765500 |
| 1 | 11113300-ARLSALD | 3 | 3.400000 |
| 2 | 11113300-BARKIND | 1 | 2.100000 |
| 3 | 11113300-BAYKIND | 1 | 1.900000 |
| 4 | 11113300-BEADERD | 46 | 3.666304 |
| ... | ... | ... | ... |
| 983 | WWMD_VA-SH1 | 2 | 1.500000 |
| 984 | WWMD_VA-SH2 | 2 | 1.800000 |
| 985 | WWMD_VA-SR6A | 1 | 0.500000 |
| 986 | WWMD_VA-WF2 | 1 | 0.600000 |
| 987 | WWMD_VA-WR5 | 1 | 2.000000 |
988 rows × 3 columns
[30]:
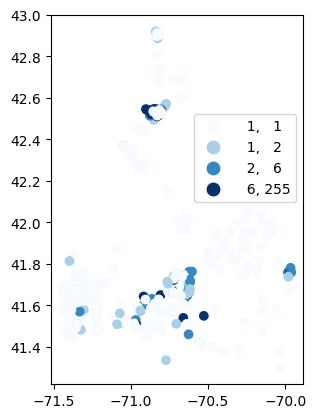
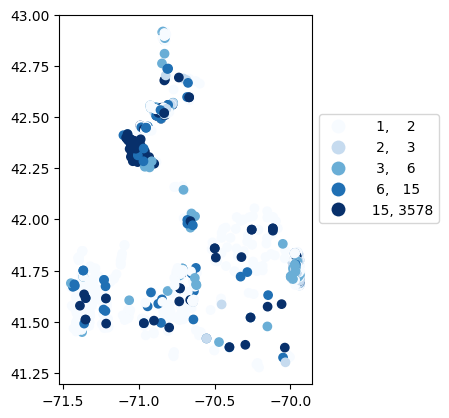
# Map number of usable results at each station
gdf_count = visualize.map_counts(sechi_results, stations_clipped)
gdf_count.plot(column='cnt', cmap='Blues', legend=True, scheme='quantiles', legend_kwds=legend_kwds)
/opt/hostedtoolcache/Python/3.11.15/x64/lib/python3.11/site-packages/mapclassify/classifiers.py:1767: UserWarning: Not enough unique values in array to form 5 classes. Setting k to 4.
  self.bins = quantile(y, k=k)
[30]:
<Axes: >
[31]:
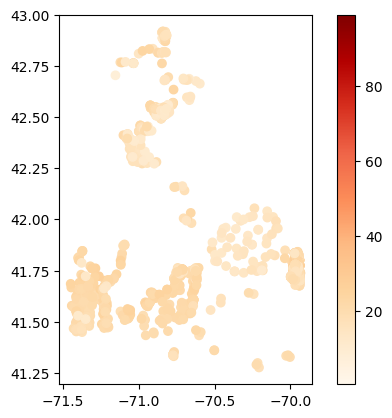
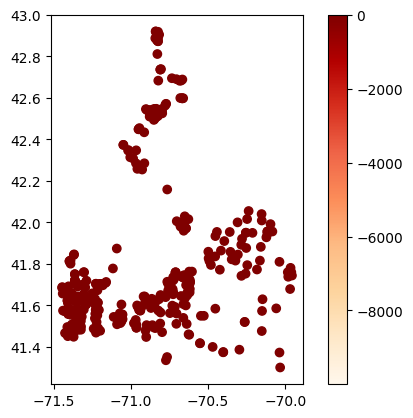
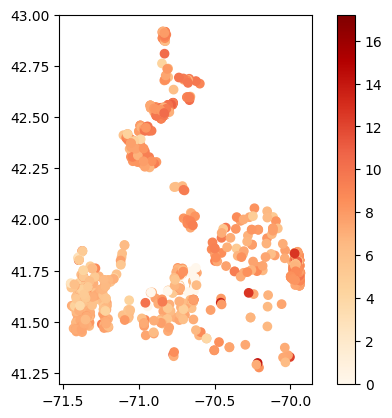
# Map average results at each station
gdf_avg = visualize.map_measure(sechi_results, stations_clipped, 'Secchi')
gdf_avg.plot(column='mean', cmap='OrRd', legend=True)
[31]:
<Axes: >
Temperature
The default error=’raise’, makes it so that there is an error when there is a dimensionality error (i.e. when units can’t be converted). Here we would get the error: DimensionalityError: Cannot convert from ‘count’ (dimensionless) to ‘degree_Celsius’ ([temperature])
[32]:
#'Temperature, water'
# errors=‘ignore’, invalid dimension conversions will return the NaN.
df = harmonize.harmonize(df, 'Temperature, water', intermediate_columns=True, report=True, errors='ignore')
/opt/hostedtoolcache/Python/3.11.15/x64/lib/python3.11/site-packages/harmonize_wq/convert.py:131: UserWarning: WARNING: 'count' converted to NaN
  warn(f"WARNING: '{unit}' converted to NaN")
-Usable results-
count    151737.000000
mean         16.314754
std           7.267984
min          -9.830000
25%          11.290000
50%          17.300000
75%          21.919000
max         910.000000
dtype: float64
Unusable results: 226
Usable results with inferred units: 217
Results outside threshold (0.0 to 59.922656): 477
[33]:
# Look at what was changed
cols = ['MonitoringLocationIdentifier', 'ResultMeasureValue', 'ResultMeasure/MeasureUnitCode', 'QA_flag', 'Temperature', 'Units']
temperature_results = df.loc[df['CharacteristicName']=='Temperature, water', cols]
temperature_results
[33]:
| MonitoringLocationIdentifier | ResultMeasureValue | ResultMeasure/MeasureUnitCode | QA_flag | Temperature | Units | |
|---|---|---|---|---|---|---|
| 2 | USGS-01116500 | 2.0 | deg C | <NA> | 2.0 degree_Celsius | degC |
| 5 | USGS-01104200 | 1.0 | deg C | <NA> | 1.0 degree_Celsius | degC |
| 13 | USGS-01105500 | 16.5 | deg C | <NA> | 16.5 degree_Celsius | degC |
| 14 | USGS-01100000 | 17.0 | deg C | <NA> | 17.0 degree_Celsius | degC |
| 15 | USGS-01108500 | 17.0 | deg C | <NA> | 17.0 degree_Celsius | degC |
| ... | ... | ... | ... | ... | ... | ... |
| 488877 | USGS-421338071104201 | 16.5 | deg C | <NA> | 16.5 degree_Celsius | degC |
| 488879 | USGS-420136070033501 | 10.0 | deg C | <NA> | 10.0 degree_Celsius | degC |
| 488881 | USGS-420005070464001 | 10.5 | deg C | <NA> | 10.5 degree_Celsius | degC |
| 488883 | USGS-420148070032401 | 14.4 | deg C | <NA> | 14.4 degree_Celsius | degC |
| 488885 | USGS-422138071092601 | 21.1 | deg C | <NA> | 21.1 degree_Celsius | degC |
151963 rows × 6 columns
[34]:
# Examine deg F
temperature_results.loc[df['ResultMeasure/MeasureUnitCode'] == 'deg F']
[34]:
| MonitoringLocationIdentifier | ResultMeasureValue | ResultMeasure/MeasureUnitCode | QA_flag | Temperature | Units | |
|---|---|---|---|---|---|---|
| 10017 | 11NPSWRD_WQX-SAMA_MEQ76_SB01 | 59 | deg F | <NA> | 15.000000000000057 degree_Celsius | degF |
| 10023 | 11NPSWRD_WQX-SAMA_MEQ76_SB02 | 58 | deg F | <NA> | 14.444444444444457 degree_Celsius | degF |
| 10025 | 11NPSWRD_WQX-SAMA_MEQ76_SB02 | 60 | deg F | <NA> | 15.5555555555556 degree_Celsius | degF |
| 10031 | 11NPSWRD_WQX-SAMA_MEQ76_SB03 | 62 | deg F | <NA> | 16.666666666666686 degree_Celsius | degF |
| 10032 | 11NPSWRD_WQX-SAMA_MEQ76_SB03 | 60 | deg F | <NA> | 15.5555555555556 degree_Celsius | degF |
| ... | ... | ... | ... | ... | ... | ... |
| 488273 | 11NPSWRD_WQX-SAIR_DMF11_HS1 | 56 | deg F | <NA> | 13.333333333333371 degree_Celsius | degF |
| 488274 | 11NPSWRD_WQX-SAIR_DMF11_OS3 | 62 | deg F | <NA> | 16.666666666666686 degree_Celsius | degF |
| 488275 | 11NPSWRD_WQX-SAIR_DMF11_OS4 | 61 | deg F | <NA> | 16.111111111111143 degree_Celsius | degF |
| 488281 | 11NPSWRD_WQX-SAIR_DMF11_S2 | 43 | deg F | <NA> | 6.111111111111143 degree_Celsius | degF |
| 488282 | 11NPSWRD_WQX-SAIR_DMF11_OS1 | 59 | deg F | <NA> | 15.000000000000057 degree_Celsius | degF |
695 rows × 6 columns
In the above we can see examples where the results were in deg F and in the result field they’ve been converted into degree_Celsius
[35]:
# Examine missing units
temperature_results.loc[df['ResultMeasure/MeasureUnitCode'].isna()]
[35]:
| MonitoringLocationIdentifier | ResultMeasureValue | ResultMeasure/MeasureUnitCode | QA_flag | Temperature | Units | |
|---|---|---|---|---|---|---|
| 26110 | USGS-414654070002901 | NaN | NaN | ResultMeasureValue: missing (NaN) result; Resu... | NaN | degC |
| 348328 | 11113300-HHPS056 | NaN | NaN | ResultMeasureValue: missing (NaN) result; Resu... | NaN | degC |
| 348335 | 11113300-HHPS055 | NaN | NaN | ResultMeasureValue: missing (NaN) result; Resu... | NaN | degC |
| 348338 | 11113300-HHPS061 | NaN | NaN | ResultMeasureValue: missing (NaN) result; Resu... | NaN | degC |
| 403733 | AQUINNAH-SQUIB # 35 | 0 | NaN | ResultMeasure/MeasureUnitCode: MISSING UNITS, ... | 0.0 degree_Celsius | degC |
| ... | ... | ... | ... | ... | ... | ... |
| 410258 | AQUINNAH-SQUIB # 33 | 0 | NaN | ResultMeasure/MeasureUnitCode: MISSING UNITS, ... | 0.0 degree_Celsius | degC |
| 410259 | AQUINNAH-SQUIB # 33 | 0 | NaN | ResultMeasure/MeasureUnitCode: MISSING UNITS, ... | 0.0 degree_Celsius | degC |
| 410260 | AQUINNAH-SQUIB # 33 | 0 | NaN | ResultMeasure/MeasureUnitCode: MISSING UNITS, ... | 0.0 degree_Celsius | degC |
| 410271 | AQUINNAH-SQUIB # 33 | 0 | NaN | ResultMeasure/MeasureUnitCode: MISSING UNITS, ... | 0.0 degree_Celsius | degC |
| 418077 | AQUINNAH-MEN PND HC | 0 | NaN | ResultMeasure/MeasureUnitCode: MISSING UNITS, ... | 0.0 degree_Celsius | degC |
221 rows × 6 columns
We can see where the units were missing, the results were assumed to be in degree_Celsius already
[36]:
# This is also noted in the QA_flag field
list(temperature_results.loc[df['ResultMeasure/MeasureUnitCode'].isna(), 'QA_flag'])[0]
[36]:
'ResultMeasureValue: missing (NaN) result; ResultMeasure/MeasureUnitCode: MISSING UNITS, degC assumed'
[37]:
# Look for any without usable results
temperature_results.loc[df['Temperature'].isna()]
[37]:
| MonitoringLocationIdentifier | ResultMeasureValue | ResultMeasure/MeasureUnitCode | QA_flag | Temperature | Units | |
|---|---|---|---|---|---|---|
| 26110 | USGS-414654070002901 | NaN | NaN | ResultMeasureValue: missing (NaN) result; Resu... | NaN | degC |
| 77142 | 11NPSWRD_WQX-SAIR_SWC_SR3 | NaN | deg C | ResultMeasureValue: missing (NaN) result | NaN | degC |
| 99995 | 11113300-HHPS073 | NO DATA | deg C | ResultMeasureValue: "NO DATA" result cannot be... | NaN | degC |
| 103299 | 11113300-HHPS058 | NO DATA | deg C | ResultMeasureValue: "NO DATA" result cannot be... | NaN | degC |
| 103348 | 11113300-HHPS071 | NO DATA | deg C | ResultMeasureValue: "NO DATA" result cannot be... | NaN | degC |
| ... | ... | ... | ... | ... | ... | ... |
| 395140 | 11113300-HHPS072 | NO DATA | deg C | ResultMeasureValue: "NO DATA" result cannot be... | NaN | degC |
| 395154 | 11113300-HHPS073 | NO DATA | deg C | ResultMeasureValue: "NO DATA" result cannot be... | NaN | degC |
| 457995 | 11NPSWRD_WQX-SAIR_SWC_SR6 | NaN | deg C | ResultMeasureValue: missing (NaN) result | NaN | degC |
| 458503 | 11NPSWRD_WQX-SAIR_SWC_SR7 | NaN | deg C | ResultMeasureValue: missing (NaN) result | NaN | degC |
| 460223 | 11NPSWRD_WQX-SAIR_SWC_SRT9 | NaN | deg C | ResultMeasureValue: missing (NaN) result | NaN | degC |
226 rows × 6 columns
[38]:
# Aggregate temperature data by station
visualize.station_summary(temperature_results, 'Temperature')
[38]:
| MonitoringLocationIdentifier | cnt | mean | |
|---|---|---|---|
| 0 | 11113300-00-SPB | 21 | 10.909524 |
| 1 | 11113300-00F-KLY | 3 | 20.233333 |
| 2 | 11113300-01-BAK | 10 | 20.600000 |
| 3 | 11113300-01-BVR | 1 | 21.000000 |
| 4 | 11113300-01-CTP | 39 | 24.438462 |
| ... | ... | ... | ... |
| 6563 | WWMD_VA-WWE1149PI | 1 | 18.800000 |
| 6564 | WWMD_VA-WWE1150PI | 1 | 21.300000 |
| 6565 | WWMD_VA-WWE1151PI | 2 | 20.700000 |
| 6566 | WWMD_VA-WWE1152PI | 1 | 20.000000 |
| 6567 | WWMD_VA-WWE1153PI | 1 | 20.800000 |
6568 rows × 3 columns
[39]:
# Map number of usable results at each station
gdf_count = visualize.map_counts(temperature_results, stations_clipped)
gdf_count.plot(column='cnt', cmap='Blues', legend=True, scheme='quantiles', legend_kwds=legend_kwds)
[39]:
<Axes: >
[40]:
# Map average results at each station
gdf_avg = visualize.map_measure(temperature_results, stations_clipped, 'Temperature')
gdf_avg.plot(column='mean', cmap='OrRd', legend=True)
[40]:
<Axes: >

Dissolved Oxygen (DO)
[41]:
# look at Dissolved oxygen (DO), but this time without intermediate fields
df = harmonize.harmonize(df, 'Dissolved oxygen (DO)')
Note: Imediately when we run a harmonization function without the intermediate fields they’re deleted.
[42]:
# Look at what was changed
cols = ['MonitoringLocationIdentifier', 'ResultMeasureValue', 'ResultMeasure/MeasureUnitCode', 'QA_flag', 'DO']
do_res = df.loc[df['CharacteristicName']=='Dissolved oxygen (DO)', cols]
do_res
[42]:
| MonitoringLocationIdentifier | ResultMeasureValue | ResultMeasure/MeasureUnitCode | QA_flag | DO | |
|---|---|---|---|---|---|
| 2617 | 11NPSWRD_WQX-SAMA_EPG_SH13 | 8.0 | mg/L | <NA> | 8.0 milligram / liter |
| 2622 | 11NPSWRD_WQX-SAMA_EPG_SH18 | 8.0 | mg/L | <NA> | 8.0 milligram / liter |
| 2624 | 11NPSWRD_WQX-SAMA_EPG_SH3 | 10.0 | mg/L | <NA> | 10.0 milligram / liter |
| 2628 | 11NPSWRD_WQX-SAMA_EPG_SH1 | 9.0 | mg/L | <NA> | 9.0 milligram / liter |
| 2630 | 11NPSWRD_WQX-SAMA_EPG_SH7 | 4.0 | mg/L | <NA> | 4.0 milligram / liter |
| ... | ... | ... | ... | ... | ... |
| 488272 | 11NPSWRD_WQX-SAIR_DMF11_S1 | 8 | mg/L | <NA> | 8.0 milligram / liter |
| 488276 | 11NPSWRD_WQX-SAIR_DMF11_S3 | 10 | mg/L | <NA> | 10.0 milligram / liter |
| 488277 | 11NPSWRD_WQX-SAIR_DMF11_S4 | 10 | mg/L | <NA> | 10.0 milligram / liter |
| 488279 | 11NPSWRD_WQX-SAIR_DMF11_S5 | 10 | mg/L | <NA> | 10.0 milligram / liter |
| 488284 | 11NPSWRD_WQX-SAIR_DMF11_S3 | 9 | mg/L | <NA> | 9.0 milligram / liter |
95808 rows × 5 columns
[43]:
do_res.loc[do_res['ResultMeasure/MeasureUnitCode']!='mg/l']
[43]:
| MonitoringLocationIdentifier | ResultMeasureValue | ResultMeasure/MeasureUnitCode | QA_flag | DO | |
|---|---|---|---|---|---|
| 2617 | 11NPSWRD_WQX-SAMA_EPG_SH13 | 8.0 | mg/L | <NA> | 8.0 milligram / liter |
| 2622 | 11NPSWRD_WQX-SAMA_EPG_SH18 | 8.0 | mg/L | <NA> | 8.0 milligram / liter |
| 2624 | 11NPSWRD_WQX-SAMA_EPG_SH3 | 10.0 | mg/L | <NA> | 10.0 milligram / liter |
| 2628 | 11NPSWRD_WQX-SAMA_EPG_SH1 | 9.0 | mg/L | <NA> | 9.0 milligram / liter |
| 2630 | 11NPSWRD_WQX-SAMA_EPG_SH7 | 4.0 | mg/L | <NA> | 4.0 milligram / liter |
| ... | ... | ... | ... | ... | ... |
| 488272 | 11NPSWRD_WQX-SAIR_DMF11_S1 | 8 | mg/L | <NA> | 8.0 milligram / liter |
| 488276 | 11NPSWRD_WQX-SAIR_DMF11_S3 | 10 | mg/L | <NA> | 10.0 milligram / liter |
| 488277 | 11NPSWRD_WQX-SAIR_DMF11_S4 | 10 | mg/L | <NA> | 10.0 milligram / liter |
| 488279 | 11NPSWRD_WQX-SAIR_DMF11_S5 | 10 | mg/L | <NA> | 10.0 milligram / liter |
| 488284 | 11NPSWRD_WQX-SAIR_DMF11_S3 | 9 | mg/L | <NA> | 9.0 milligram / liter |
94511 rows × 5 columns
Though there were no results in %, the conversion from percent saturation (%) to mg/l is special. This equation is being improved by integrating tempertaure and pressure instead of assuming STP (see DO_saturation())
[44]:
# Aggregate data by station
visualize.station_summary(do_res, 'DO')
[44]:
| MonitoringLocationIdentifier | cnt | mean | |
|---|---|---|---|
| 0 | 11113300-00F-KLY | 3 | 4.040000 |
| 1 | 11113300-01-BAK | 10 | 5.697000 |
| 2 | 11113300-01-BVR | 1 | 6.700000 |
| 3 | 11113300-01-CTP | 37 | 6.945135 |
| 4 | 11113300-01-GOL | 1 | 4.400000 |
| ... | ... | ... | ... |
| 2875 | WWMD_VA-SR5 | 1 | 10.810000 |
| 2876 | WWMD_VA-WF2 | 2 | 6.800000 |
| 2877 | WWMD_VA-WI1 | 1 | 9.510000 |
| 2878 | WWMD_VA-WR2X | 2 | 6.000000 |
| 2879 | WWMD_VA-WR5 | 1 | 8.355000 |
2880 rows × 3 columns
[45]:
# Map number of usable results at each station
gdf_count = visualize.map_counts(do_res, stations_clipped)
gdf_count.plot(column='cnt', cmap='Blues', legend=True, scheme='quantiles', legend_kwds=legend_kwds)
[45]:
<Axes: >
[46]:
# Map average results at each station
gdf_avg = visualize.map_measure(do_res, stations_clipped, 'DO')
gdf_avg.plot(column='mean', cmap='OrRd', legend=True)
[46]:
<Axes: >
pH
[47]:
# pH, this time looking at a report
df = harmonize.harmonize(df, "pH", errors="ignore", report=True)
-Usable results-
count    23000.000000
mean         6.348784
std          1.260661
min          0.000000
25%          5.700000
50%          6.400000
75%          7.000000
max         63.000000
dtype: float64
Unusable results: 2
Usable results with inferred units: 1452
Results outside threshold (0.0 to 13.912750): 3
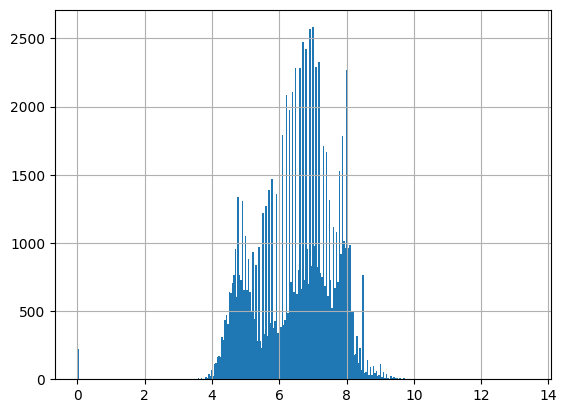
Note the warnings that occur when a unit is not recognized by the package. These occur even when report=False. Future versions could include these as defined units for pH, but here it wouldn’t alter results.
[48]:
df.loc[df['CharacteristicName']=='pH', ['ResultMeasureValue', 'ResultMeasure/MeasureUnitCode', 'QA_flag', 'pH']]
[48]:
| ResultMeasureValue | ResultMeasure/MeasureUnitCode | QA_flag | pH | |
|---|---|---|---|---|
| 1 | 6.7 | std units | <NA> | 6.7 dimensionless |
| 3 | 7.1 | std units | <NA> | 7.1 dimensionless |
| 4 | 6.3 | std units | <NA> | 6.3 dimensionless |
| 6 | 5.7 | std units | <NA> | 5.7 dimensionless |
| 7 | 6.9 | std units | <NA> | 6.9 dimensionless |
| ... | ... | ... | ... | ... |
| 488878 | 7.3 | std units | <NA> | 7.3 dimensionless |
| 488880 | 6.4 | std units | <NA> | 6.4 dimensionless |
| 488882 | 5.8 | std units | <NA> | 5.8 dimensionless |
| 488884 | 6.6 | std units | <NA> | 6.6 dimensionless |
| 488886 | 6.5 | std units | <NA> | 6.5 dimensionless |
23002 rows × 4 columns
‘None’ is uninterpretable and replaced with NaN, which then gets replaced with ‘dimensionless’ since pH is unitless
Salinity
[49]:
# Salinity
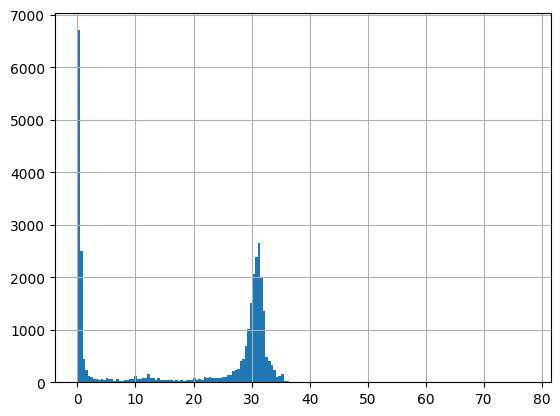
df = harmonize.harmonize(df, 'Salinity', report=True, errors='ignore')
/opt/hostedtoolcache/Python/3.11.15/x64/lib/python3.11/site-packages/harmonize_wq/basis.py:154: UserWarning: Mismatched ResultTemperatureBasisText: updated from 25 deg C to @25C (units)
  warn(f"Mismatched {flag}", UserWarning)
/opt/hostedtoolcache/Python/3.11.15/x64/lib/python3.11/site-packages/harmonize_wq/convert.py:542: UserWarning: WARNING: Increasing salinity density 15.2 by density of water
  warn(f"WARNING: Increasing salinity density {val} by density of water")
/opt/hostedtoolcache/Python/3.11.15/x64/lib/python3.11/site-packages/harmonize_wq/convert.py:542: UserWarning: WARNING: Increasing salinity density 14.95 by density of water
  warn(f"WARNING: Increasing salinity density {val} by density of water")
/opt/hostedtoolcache/Python/3.11.15/x64/lib/python3.11/site-packages/harmonize_wq/convert.py:542: UserWarning: WARNING: Increasing salinity density 20.89 by density of water
  warn(f"WARNING: Increasing salinity density {val} by density of water")
/opt/hostedtoolcache/Python/3.11.15/x64/lib/python3.11/site-packages/harmonize_wq/convert.py:542: UserWarning: WARNING: Increasing salinity density 20.47 by density of water
  warn(f"WARNING: Increasing salinity density {val} by density of water")
/opt/hostedtoolcache/Python/3.11.15/x64/lib/python3.11/site-packages/harmonize_wq/convert.py:542: UserWarning: WARNING: Increasing salinity density 20.56 by density of water
  warn(f"WARNING: Increasing salinity density {val} by density of water")
/opt/hostedtoolcache/Python/3.11.15/x64/lib/python3.11/site-packages/harmonize_wq/convert.py:542: UserWarning: WARNING: Increasing salinity density 20.59 by density of water
  warn(f"WARNING: Increasing salinity density {val} by density of water")
/opt/hostedtoolcache/Python/3.11.15/x64/lib/python3.11/site-packages/harmonize_wq/convert.py:542: UserWarning: WARNING: Increasing salinity density 31.64 by density of water
  warn(f"WARNING: Increasing salinity density {val} by density of water")
/opt/hostedtoolcache/Python/3.11.15/x64/lib/python3.11/site-packages/harmonize_wq/convert.py:542: UserWarning: WARNING: Increasing salinity density 31.54 by density of water
  warn(f"WARNING: Increasing salinity density {val} by density of water")
/opt/hostedtoolcache/Python/3.11.15/x64/lib/python3.11/site-packages/harmonize_wq/convert.py:542: UserWarning: WARNING: Increasing salinity density 22.44 by density of water
  warn(f"WARNING: Increasing salinity density {val} by density of water")
/opt/hostedtoolcache/Python/3.11.15/x64/lib/python3.11/site-packages/harmonize_wq/convert.py:542: UserWarning: WARNING: Increasing salinity density 22.58 by density of water
  warn(f"WARNING: Increasing salinity density {val} by density of water")
/opt/hostedtoolcache/Python/3.11.15/x64/lib/python3.11/site-packages/harmonize_wq/convert.py:542: UserWarning: WARNING: Increasing salinity density 22.8 by density of water
  warn(f"WARNING: Increasing salinity density {val} by density of water")
/opt/hostedtoolcache/Python/3.11.15/x64/lib/python3.11/site-packages/harmonize_wq/convert.py:542: UserWarning: WARNING: Increasing salinity density 22.94 by density of water
  warn(f"WARNING: Increasing salinity density {val} by density of water")
/opt/hostedtoolcache/Python/3.11.15/x64/lib/python3.11/site-packages/harmonize_wq/convert.py:542: UserWarning: WARNING: Increasing salinity density 30.49 by density of water
  warn(f"WARNING: Increasing salinity density {val} by density of water")
/opt/hostedtoolcache/Python/3.11.15/x64/lib/python3.11/site-packages/harmonize_wq/convert.py:542: UserWarning: WARNING: Increasing salinity density 30.72 by density of water
  warn(f"WARNING: Increasing salinity density {val} by density of water")
/opt/hostedtoolcache/Python/3.11.15/x64/lib/python3.11/site-packages/harmonize_wq/convert.py:542: UserWarning: WARNING: Increasing salinity density 31.56 by density of water
  warn(f"WARNING: Increasing salinity density {val} by density of water")
/opt/hostedtoolcache/Python/3.11.15/x64/lib/python3.11/site-packages/harmonize_wq/convert.py:542: UserWarning: WARNING: Increasing salinity density 26.84 by density of water
  warn(f"WARNING: Increasing salinity density {val} by density of water")
/opt/hostedtoolcache/Python/3.11.15/x64/lib/python3.11/site-packages/harmonize_wq/convert.py:542: UserWarning: WARNING: Increasing salinity density 27.0 by density of water
  warn(f"WARNING: Increasing salinity density {val} by density of water")
/opt/hostedtoolcache/Python/3.11.15/x64/lib/python3.11/site-packages/harmonize_wq/convert.py:542: UserWarning: WARNING: Increasing salinity density 32.28 by density of water
  warn(f"WARNING: Increasing salinity density {val} by density of water")
/opt/hostedtoolcache/Python/3.11.15/x64/lib/python3.11/site-packages/harmonize_wq/convert.py:542: UserWarning: WARNING: Increasing salinity density 32.3 by density of water
  warn(f"WARNING: Increasing salinity density {val} by density of water")
/opt/hostedtoolcache/Python/3.11.15/x64/lib/python3.11/site-packages/harmonize_wq/convert.py:542: UserWarning: WARNING: Increasing salinity density 31.8 by density of water
  warn(f"WARNING: Increasing salinity density {val} by density of water")
/opt/hostedtoolcache/Python/3.11.15/x64/lib/python3.11/site-packages/harmonize_wq/convert.py:542: UserWarning: WARNING: Increasing salinity density 32.17 by density of water
  warn(f"WARNING: Increasing salinity density {val} by density of water")
/opt/hostedtoolcache/Python/3.11.15/x64/lib/python3.11/site-packages/harmonize_wq/convert.py:542: UserWarning: WARNING: Increasing salinity density 35.07 by density of water
  warn(f"WARNING: Increasing salinity density {val} by density of water")
/opt/hostedtoolcache/Python/3.11.15/x64/lib/python3.11/site-packages/harmonize_wq/convert.py:542: UserWarning: WARNING: Increasing salinity density 35.3 by density of water
  warn(f"WARNING: Increasing salinity density {val} by density of water")
/opt/hostedtoolcache/Python/3.11.15/x64/lib/python3.11/site-packages/harmonize_wq/convert.py:542: UserWarning: WARNING: Increasing salinity density 21.3 by density of water
  warn(f"WARNING: Increasing salinity density {val} by density of water")
/opt/hostedtoolcache/Python/3.11.15/x64/lib/python3.11/site-packages/harmonize_wq/convert.py:542: UserWarning: WARNING: Increasing salinity density 21.95 by density of water
  warn(f"WARNING: Increasing salinity density {val} by density of water")
/opt/hostedtoolcache/Python/3.11.15/x64/lib/python3.11/site-packages/harmonize_wq/convert.py:542: UserWarning: WARNING: Increasing salinity density 20.22 by density of water
  warn(f"WARNING: Increasing salinity density {val} by density of water")
/opt/hostedtoolcache/Python/3.11.15/x64/lib/python3.11/site-packages/harmonize_wq/convert.py:542: UserWarning: WARNING: Increasing salinity density 19.58 by density of water
  warn(f"WARNING: Increasing salinity density {val} by density of water")
/opt/hostedtoolcache/Python/3.11.15/x64/lib/python3.11/site-packages/harmonize_wq/convert.py:542: UserWarning: WARNING: Increasing salinity density 21.71 by density of water
  warn(f"WARNING: Increasing salinity density {val} by density of water")
/opt/hostedtoolcache/Python/3.11.15/x64/lib/python3.11/site-packages/harmonize_wq/convert.py:542: UserWarning: WARNING: Increasing salinity density 21.84 by density of water
  warn(f"WARNING: Increasing salinity density {val} by density of water")
/opt/hostedtoolcache/Python/3.11.15/x64/lib/python3.11/site-packages/harmonize_wq/convert.py:542: UserWarning: WARNING: Increasing salinity density 34.89 by density of water
  warn(f"WARNING: Increasing salinity density {val} by density of water")
/opt/hostedtoolcache/Python/3.11.15/x64/lib/python3.11/site-packages/harmonize_wq/convert.py:542: UserWarning: WARNING: Increasing salinity density 34.83 by density of water
  warn(f"WARNING: Increasing salinity density {val} by density of water")
/opt/hostedtoolcache/Python/3.11.15/x64/lib/python3.11/site-packages/harmonize_wq/convert.py:542: UserWarning: WARNING: Increasing salinity density 21.13 by density of water
  warn(f"WARNING: Increasing salinity density {val} by density of water")
/opt/hostedtoolcache/Python/3.11.15/x64/lib/python3.11/site-packages/harmonize_wq/convert.py:542: UserWarning: WARNING: Increasing salinity density 21.66 by density of water
  warn(f"WARNING: Increasing salinity density {val} by density of water")
/opt/hostedtoolcache/Python/3.11.15/x64/lib/python3.11/site-packages/harmonize_wq/convert.py:542: UserWarning: WARNING: Increasing salinity density 22.21 by density of water
  warn(f"WARNING: Increasing salinity density {val} by density of water")
/opt/hostedtoolcache/Python/3.11.15/x64/lib/python3.11/site-packages/harmonize_wq/convert.py:542: UserWarning: WARNING: Increasing salinity density 22.34 by density of water
  warn(f"WARNING: Increasing salinity density {val} by density of water")
/opt/hostedtoolcache/Python/3.11.15/x64/lib/python3.11/site-packages/harmonize_wq/convert.py:542: UserWarning: WARNING: Increasing salinity density 1.57 by density of water
  warn(f"WARNING: Increasing salinity density {val} by density of water")
/opt/hostedtoolcache/Python/3.11.15/x64/lib/python3.11/site-packages/harmonize_wq/convert.py:542: UserWarning: WARNING: Increasing salinity density 1.6 by density of water
  warn(f"WARNING: Increasing salinity density {val} by density of water")
/opt/hostedtoolcache/Python/3.11.15/x64/lib/python3.11/site-packages/harmonize_wq/convert.py:542: UserWarning: WARNING: Increasing salinity density 1.18 by density of water
  warn(f"WARNING: Increasing salinity density {val} by density of water")
/opt/hostedtoolcache/Python/3.11.15/x64/lib/python3.11/site-packages/harmonize_wq/convert.py:542: UserWarning: WARNING: Increasing salinity density 1.26 by density of water
  warn(f"WARNING: Increasing salinity density {val} by density of water")
/opt/hostedtoolcache/Python/3.11.15/x64/lib/python3.11/site-packages/harmonize_wq/convert.py:542: UserWarning: WARNING: Increasing salinity density 0.67 by density of water
  warn(f"WARNING: Increasing salinity density {val} by density of water")
/opt/hostedtoolcache/Python/3.11.15/x64/lib/python3.11/site-packages/harmonize_wq/convert.py:542: UserWarning: WARNING: Increasing salinity density 0.95 by density of water
  warn(f"WARNING: Increasing salinity density {val} by density of water")
/opt/hostedtoolcache/Python/3.11.15/x64/lib/python3.11/site-packages/harmonize_wq/convert.py:542: UserWarning: WARNING: Increasing salinity density 7.39 by density of water
  warn(f"WARNING: Increasing salinity density {val} by density of water")
/opt/hostedtoolcache/Python/3.11.15/x64/lib/python3.11/site-packages/harmonize_wq/convert.py:542: UserWarning: WARNING: Increasing salinity density 7.48 by density of water
  warn(f"WARNING: Increasing salinity density {val} by density of water")
/opt/hostedtoolcache/Python/3.11.15/x64/lib/python3.11/site-packages/harmonize_wq/convert.py:542: UserWarning: WARNING: Increasing salinity density 7.46 by density of water
  warn(f"WARNING: Increasing salinity density {val} by density of water")
/opt/hostedtoolcache/Python/3.11.15/x64/lib/python3.11/site-packages/harmonize_wq/convert.py:542: UserWarning: WARNING: Increasing salinity density 6.66 by density of water
  warn(f"WARNING: Increasing salinity density {val} by density of water")
/opt/hostedtoolcache/Python/3.11.15/x64/lib/python3.11/site-packages/harmonize_wq/convert.py:542: UserWarning: WARNING: Increasing salinity density 6.65 by density of water
  warn(f"WARNING: Increasing salinity density {val} by density of water")
/opt/hostedtoolcache/Python/3.11.15/x64/lib/python3.11/site-packages/harmonize_wq/convert.py:542: UserWarning: WARNING: Increasing salinity density 4.04 by density of water
  warn(f"WARNING: Increasing salinity density {val} by density of water")
/opt/hostedtoolcache/Python/3.11.15/x64/lib/python3.11/site-packages/harmonize_wq/convert.py:542: UserWarning: WARNING: Increasing salinity density 4.02 by density of water
  warn(f"WARNING: Increasing salinity density {val} by density of water")
/opt/hostedtoolcache/Python/3.11.15/x64/lib/python3.11/site-packages/harmonize_wq/convert.py:542: UserWarning: WARNING: Increasing salinity density 21.41 by density of water
  warn(f"WARNING: Increasing salinity density {val} by density of water")
/opt/hostedtoolcache/Python/3.11.15/x64/lib/python3.11/site-packages/harmonize_wq/convert.py:542: UserWarning: WARNING: Increasing salinity density 21.56 by density of water
  warn(f"WARNING: Increasing salinity density {val} by density of water")
/opt/hostedtoolcache/Python/3.11.15/x64/lib/python3.11/site-packages/harmonize_wq/convert.py:542: UserWarning: WARNING: Increasing salinity density 19.33 by density of water
  warn(f"WARNING: Increasing salinity density {val} by density of water")
/opt/hostedtoolcache/Python/3.11.15/x64/lib/python3.11/site-packages/harmonize_wq/convert.py:542: UserWarning: WARNING: Increasing salinity density 19.34 by density of water
  warn(f"WARNING: Increasing salinity density {val} by density of water")
/opt/hostedtoolcache/Python/3.11.15/x64/lib/python3.11/site-packages/harmonize_wq/convert.py:542: UserWarning: WARNING: Increasing salinity density 28.98 by density of water
  warn(f"WARNING: Increasing salinity density {val} by density of water")
/opt/hostedtoolcache/Python/3.11.15/x64/lib/python3.11/site-packages/harmonize_wq/convert.py:542: UserWarning: WARNING: Increasing salinity density 29.02 by density of water
  warn(f"WARNING: Increasing salinity density {val} by density of water")
/opt/hostedtoolcache/Python/3.11.15/x64/lib/python3.11/site-packages/harmonize_wq/convert.py:542: UserWarning: WARNING: Increasing salinity density 28.5 by density of water
  warn(f"WARNING: Increasing salinity density {val} by density of water")
/opt/hostedtoolcache/Python/3.11.15/x64/lib/python3.11/site-packages/harmonize_wq/convert.py:542: UserWarning: WARNING: Increasing salinity density 29.14 by density of water
  warn(f"WARNING: Increasing salinity density {val} by density of water")
/opt/hostedtoolcache/Python/3.11.15/x64/lib/python3.11/site-packages/harmonize_wq/convert.py:542: UserWarning: WARNING: Increasing salinity density 23.48 by density of water
  warn(f"WARNING: Increasing salinity density {val} by density of water")
/opt/hostedtoolcache/Python/3.11.15/x64/lib/python3.11/site-packages/harmonize_wq/convert.py:542: UserWarning: WARNING: Increasing salinity density 23.47 by density of water
  warn(f"WARNING: Increasing salinity density {val} by density of water")
/opt/hostedtoolcache/Python/3.11.15/x64/lib/python3.11/site-packages/harmonize_wq/convert.py:542: UserWarning: WARNING: Increasing salinity density 16.52 by density of water
  warn(f"WARNING: Increasing salinity density {val} by density of water")
/opt/hostedtoolcache/Python/3.11.15/x64/lib/python3.11/site-packages/harmonize_wq/convert.py:542: UserWarning: WARNING: Increasing salinity density 18.15 by density of water
  warn(f"WARNING: Increasing salinity density {val} by density of water")
/opt/hostedtoolcache/Python/3.11.15/x64/lib/python3.11/site-packages/harmonize_wq/convert.py:542: UserWarning: WARNING: Increasing salinity density 28.33 by density of water
  warn(f"WARNING: Increasing salinity density {val} by density of water")
/opt/hostedtoolcache/Python/3.11.15/x64/lib/python3.11/site-packages/harmonize_wq/convert.py:542: UserWarning: WARNING: Increasing salinity density 28.28 by density of water
  warn(f"WARNING: Increasing salinity density {val} by density of water")
/opt/hostedtoolcache/Python/3.11.15/x64/lib/python3.11/site-packages/harmonize_wq/convert.py:542: UserWarning: WARNING: Increasing salinity density 27.65 by density of water
  warn(f"WARNING: Increasing salinity density {val} by density of water")
/opt/hostedtoolcache/Python/3.11.15/x64/lib/python3.11/site-packages/harmonize_wq/convert.py:542: UserWarning: WARNING: Increasing salinity density 27.69 by density of water
  warn(f"WARNING: Increasing salinity density {val} by density of water")
/opt/hostedtoolcache/Python/3.11.15/x64/lib/python3.11/site-packages/harmonize_wq/convert.py:542: UserWarning: WARNING: Increasing salinity density 7.33 by density of water
  warn(f"WARNING: Increasing salinity density {val} by density of water")
/opt/hostedtoolcache/Python/3.11.15/x64/lib/python3.11/site-packages/harmonize_wq/convert.py:542: UserWarning: WARNING: Increasing salinity density 7.38 by density of water
  warn(f"WARNING: Increasing salinity density {val} by density of water")
/opt/hostedtoolcache/Python/3.11.15/x64/lib/python3.11/site-packages/harmonize_wq/convert.py:542: UserWarning: WARNING: Increasing salinity density 13.26 by density of water
  warn(f"WARNING: Increasing salinity density {val} by density of water")
/opt/hostedtoolcache/Python/3.11.15/x64/lib/python3.11/site-packages/harmonize_wq/convert.py:542: UserWarning: WARNING: Increasing salinity density 13.52 by density of water
  warn(f"WARNING: Increasing salinity density {val} by density of water")
/opt/hostedtoolcache/Python/3.11.15/x64/lib/python3.11/site-packages/harmonize_wq/convert.py:131: UserWarning: WARNING: 'deg C' converted to NaN
  warn(f"WARNING: '{unit}' converted to NaN")
-Usable results-
count    6.112000e+04
mean     9.713901e+01
std      9.586814e+03
min     -3.000000e+01
25%      1.318000e+01
50%      3.000000e+01
75%      3.150000e+01
max      2.353411e+06
dtype: float64
Unusable results: 228
Usable results with inferred units: 1
Results outside threshold (0.0 to 57618.023949): 2
[50]:
cols = ['ResultMeasureValue', 'ResultMeasure/MeasureUnitCode', 'QA_flag', 'Salinity']
df.loc[df['CharacteristicName']=='Salinity', cols]
[50]:
| ResultMeasureValue | ResultMeasure/MeasureUnitCode | QA_flag | Salinity | |
|---|---|---|---|---|
| 2618 | 31.0 | ppth | <NA> | 31.0 Practical_Salinity_Units |
| 2621 | 27.0 | ppth | <NA> | 27.0 Practical_Salinity_Units |
| 2623 | 33.0 | ppth | <NA> | 33.0 Practical_Salinity_Units |
| 2627 | 30.0 | ppth | <NA> | 30.0 Practical_Salinity_Units |
| 2629 | 32.5 | ppth | <NA> | 32.5 Practical_Salinity_Units |
| ... | ... | ... | ... | ... |
| 488266 | 32.5 | ppth | <NA> | 32.5 Practical_Salinity_Units |
| 488271 | 31.5 | ppth | <NA> | 31.5 Practical_Salinity_Units |
| 488278 | 31.0 | ppth | <NA> | 31.0 Practical_Salinity_Units |
| 488280 | 32.0 | ppth | <NA> | 32.0 Practical_Salinity_Units |
| 488283 | 27.0 | ppth | <NA> | 27.0 Practical_Salinity_Units |
61348 rows × 4 columns
Nitrogen
[51]:
# Nitrogen
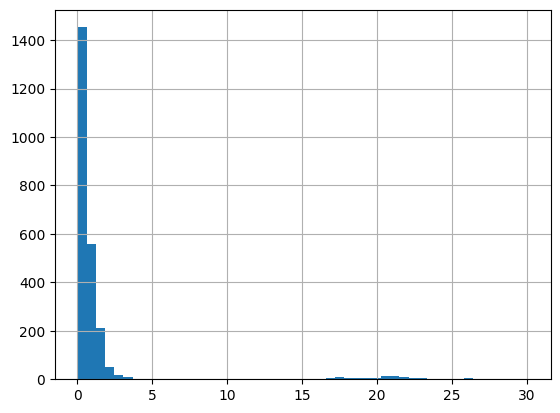
df = harmonize.harmonize(df, 'Nitrogen', report=True)
/opt/hostedtoolcache/Python/3.11.15/x64/lib/python3.11/site-packages/harmonize_wq/basis.py:343: FutureWarning: Setting an item of incompatible dtype is deprecated and will raise an error in a future version of pandas. Value 'as N' has dtype incompatible with float64, please explicitly cast to a compatible dtype first.
  df_out.loc[mask, basis_col] = basis
/opt/hostedtoolcache/Python/3.11.15/x64/lib/python3.11/site-packages/harmonize_wq/wq_data.py:486: FutureWarning: Setting an item of incompatible dtype is deprecated and will raise an error in a future version of pandas. Value '['as N' 'as N' 'as N' ... nan nan nan]' has dtype incompatible with float64, please explicitly cast to a compatible dtype first.
  self.df[c_mask] = basis.basis_from_method_spec(self.df[c_mask])
/opt/hostedtoolcache/Python/3.11.15/x64/lib/python3.11/site-packages/harmonize_wq/wq_data.py:397: UserWarning: WARNING: 'cm3/g' UNDEFINED UNIT for Nitrogen
  warn("WARNING: " + problem)
/opt/hostedtoolcache/Python/3.11.15/x64/lib/python3.11/site-packages/pandas/core/construction.py:627: UnitStrippedWarning: The unit of the quantity is stripped when downcasting to ndarray.
  data = np.asarray(data)
/opt/hostedtoolcache/Python/3.11.15/x64/lib/python3.11/site-packages/pandas/core/construction.py:627: UnitStrippedWarning: The unit of the quantity is stripped when downcasting to ndarray.
  data = np.asarray(data)
/opt/hostedtoolcache/Python/3.11.15/x64/lib/python3.11/site-packages/harmonize_wq/domains.py:277: FutureWarning: Downcasting object dtype arrays on .fillna, .ffill, .bfill is deprecated and will change in a future version. Call result.infer_objects(copy=False) instead. To opt-in to the future behavior, set `pd.set_option('future.no_silent_downcasting', True)`
  sub_df[cols[2]] = sub_df[cols[2]].fillna(sub_df[cols[1]])  # new_fract
-Usable results-
count    2508.000000
mean        6.264310
std       104.802798
min         0.000800
25%         0.078000
50%         0.264375
75%         1.030000
max      2800.000000
dtype: float64
Unusable results: 243
Usable results with inferred units: 0
Results outside threshold (0.0 to 635.081097): 6
[52]:
cols = ['ResultMeasureValue', 'ResultMeasure/MeasureUnitCode', 'QA_flag', 'Nitrogen']
df.loc[df['CharacteristicName']=='Nitrogen', cols]
[52]:
| ResultMeasureValue | ResultMeasure/MeasureUnitCode | QA_flag | Nitrogen | |
|---|---|---|---|---|
| 16469 | .28 | % | <NA> | 2800.000000000001 milligram / liter |
| 16471 | .28 | % | <NA> | 2800.000000000001 milligram / liter |
| 16473 | NaN | % | ResultMeasureValue: missing (NaN) result | NaN |
| 16479 | .11 | % | <NA> | 1100.0000000000002 milligram / liter |
| 16485 | .19 | % | <NA> | 1900.0000000000005 milligram / liter |
| ... | ... | ... | ... | ... |
| 460190 | 109.59 | umol | <NA> | 1.5353559 milligram / liter |
| 460307 | 25.06 | umol | <NA> | 0.3510906 milligram / liter |
| 460316 | 127.71 | umol | <NA> | 1.7892171 milligram / liter |
| 460345 | 16.01 | umol | <NA> | 0.2243001 milligram / liter |
| 460346 | 8.21 | umol | <NA> | 0.1150221 milligram / liter |
2751 rows × 4 columns
Conductivity
[53]:
# Conductivity
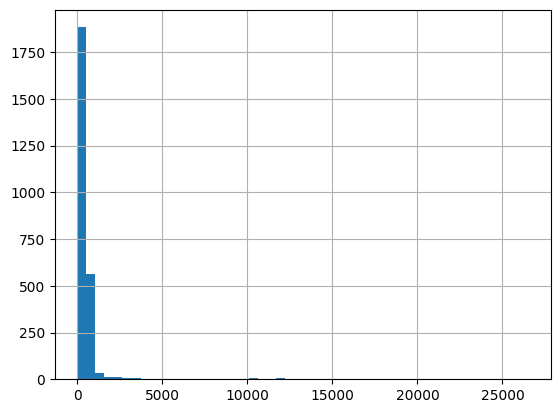
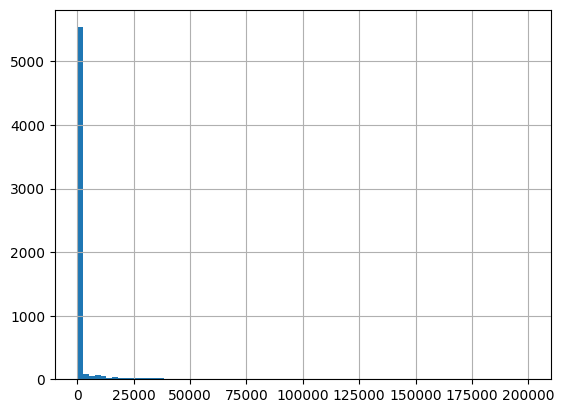
df = harmonize.harmonize(df, 'Conductivity', report=True, errors='ignore')
/opt/hostedtoolcache/Python/3.11.15/x64/lib/python3.11/site-packages/harmonize_wq/convert.py:131: UserWarning: WARNING: 'count' converted to NaN
  warn(f"WARNING: '{unit}' converted to NaN")
-Usable results-
count     13563.000000
mean      27191.912855
std       18509.783617
min           0.000000
25%       16480.300000
50%       30669.300000
75%       41824.300000
max      992000.000000
dtype: float64
Unusable results: 82
Usable results with inferred units: 0
Results outside threshold (0.0 to 138250.614557): 3
[54]:
cols = ['ResultMeasureValue', 'ResultMeasure/MeasureUnitCode', 'QA_flag', 'Conductivity']
df.loc[df['CharacteristicName']=='Conductivity', cols]
[54]:
| ResultMeasureValue | ResultMeasure/MeasureUnitCode | QA_flag | Conductivity | |
|---|---|---|---|---|
| 92666 | 327 | uS/cm | <NA> | 327.0 microsiemens / centimeter |
| 92671 | 127 | uS/cm | <NA> | 127.0 microsiemens / centimeter |
| 92824 | 345 | uS/cm | <NA> | 345.0 microsiemens / centimeter |
| 92826 | 348 | uS/cm | <NA> | 348.0 microsiemens / centimeter |
| 92831 | 344 | uS/cm | <NA> | 344.0 microsiemens / centimeter |
| ... | ... | ... | ... | ... |
| 426642 | 610 | uS/cm | <NA> | 610.0 microsiemens / centimeter |
| 426745 | 150 | uS/cm | <NA> | 150.0 microsiemens / centimeter |
| 427359 | 433 | uS/cm | <NA> | 433.0 microsiemens / centimeter |
| 428081 | 444 | uS/cm | <NA> | 444.0 microsiemens / centimeter |
| 428704 | 424 | uS/cm | <NA> | 424.0 microsiemens / centimeter |
13645 rows × 4 columns
Chlorophyll a
[55]:
# Chlorophyll a
df = harmonize.harmonize(df, 'Chlorophyll a', report=True)
/opt/hostedtoolcache/Python/3.11.15/x64/lib/python3.11/site-packages/harmonize_wq/wq_data.py:397: UserWarning: WARNING: 'ppb' UNDEFINED UNIT for Chlorophyll
  warn("WARNING: " + problem)
/opt/hostedtoolcache/Python/3.11.15/x64/lib/python3.11/site-packages/harmonize_wq/wq_data.py:397: UserWarning: WARNING: 'ug/cm2' UNDEFINED UNIT for Chlorophyll
  warn("WARNING: " + problem)
/opt/hostedtoolcache/Python/3.11.15/x64/lib/python3.11/site-packages/harmonize_wq/wq_data.py:397: UserWarning: WARNING: 'ug/m3' UNDEFINED UNIT for Chlorophyll
  warn("WARNING: " + problem)
-Usable results-
count    14063.000000
mean         0.176261
std          1.805865
min         -0.002400
25%          0.001800
50%          0.003500
75%          0.007300
max         92.900000
dtype: float64
Unusable results: 204
Usable results with inferred units: 9
Results outside threshold (0.0 to 11.011454): 64
[56]:
cols = ['ResultMeasureValue', 'ResultMeasure/MeasureUnitCode', 'QA_flag', 'Chlorophyll']
df.loc[df['CharacteristicName']=='Chlorophyll a', cols]
[56]:
| ResultMeasureValue | ResultMeasure/MeasureUnitCode | QA_flag | Chlorophyll | |
|---|---|---|---|---|
| 10699 | 2.70 | mg/m2 | <NA> | 0.002700000000000001 milligram / liter |
| 10701 | 1.70 | mg/m2 | <NA> | 0.0017000000000000003 milligram / liter |
| 10715 | 0.233 | mg/m2 | <NA> | 0.00023300000000000008 milligram / liter |
| 10721 | 0.200 | mg/m2 | <NA> | 0.00020000000000000006 milligram / liter |
| 10744 | 0.912 | mg/m2 | <NA> | 0.0009120000000000003 milligram / liter |
| ... | ... | ... | ... | ... |
| 479624 | 7.28 | ug/m3 | ResultMeasure/MeasureUnitCode: 'ug/m3' UNDEFIN... | 7.28 milligram / liter |
| 479625 | 12.51 | ug/m3 | ResultMeasure/MeasureUnitCode: 'ug/m3' UNDEFIN... | 12.51 milligram / liter |
| 479626 | 1.46 | ug/m3 | ResultMeasure/MeasureUnitCode: 'ug/m3' UNDEFIN... | 1.46 milligram / liter |
| 479627 | 0.04 | ug/m3 | ResultMeasure/MeasureUnitCode: 'ug/m3' UNDEFIN... | 0.04 milligram / liter |
| 479628 | 4.22 | ug/m3 | ResultMeasure/MeasureUnitCode: 'ug/m3' UNDEFIN... | 4.22 milligram / liter |
14267 rows × 4 columns
Organic Carbon
[57]:
# Organic carbon (%)
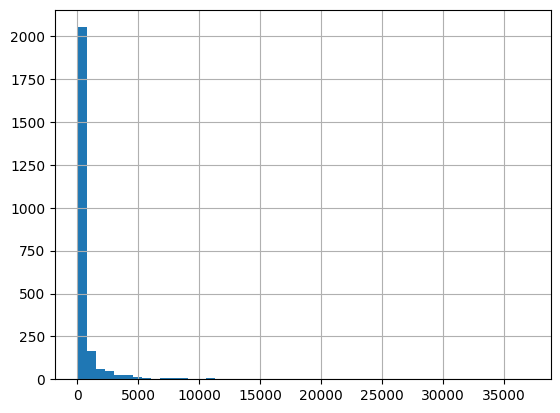
df = harmonize.harmonize(df, 'Organic carbon', report=True, errors='ignore')
/opt/hostedtoolcache/Python/3.11.15/x64/lib/python3.11/site-packages/harmonize_wq/convert.py:131: UserWarning: WARNING: 'umol/L * ρH2O' converted to NaN
  warn(f"WARNING: '{unit}' converted to NaN")
-Usable results-
count      6171.000000
mean       5261.607674
std       35507.595866
min      -90000.000000
25%           1.800000
50%           4.900000
75%           8.900000
max      530000.000000
dtype: float64
Unusable results: 89
Usable results with inferred units: 0
Results outside threshold (0.0 to 218307.182870): 40
[58]:
cols = ['ResultMeasureValue', 'ResultMeasure/MeasureUnitCode', 'QA_flag', 'Carbon']
df.loc[df['CharacteristicName']=='Organic carbon', cols]
[58]:
| ResultMeasureValue | ResultMeasure/MeasureUnitCode | QA_flag | Carbon | |
|---|---|---|---|---|
| 5889 | 5.5 | mg/l | <NA> | 5.5 milligram / liter |
| 6465 | 8.5 | mg/l | <NA> | 8.5 milligram / liter |
| 7311 | 7.0 | mg/l | <NA> | 7.0 milligram / liter |
| 7565 | 4.3 | mg/l | <NA> | 4.3 milligram / liter |
| 7726 | 4.9 | mg/l | <NA> | 4.9 milligram / liter |
| ... | ... | ... | ... | ... |
| 483710 | 63900 | ug/g | <NA> | 63900.000000000015 milligram / liter |
| 484104 | 15200 | ug/g | <NA> | 15200.000000000004 milligram / liter |
| 486691 | 9.3 | mg/l | <NA> | 9.3 milligram / liter |
| 487060 | 0.2 | mg/l | <NA> | 0.2 milligram / liter |
| 487061 | 0.4 | mg/l | <NA> | 0.4 milligram / liter |
6260 rows × 4 columns
Turbidity (NTU)
[59]:
# Turbidity (NTU)
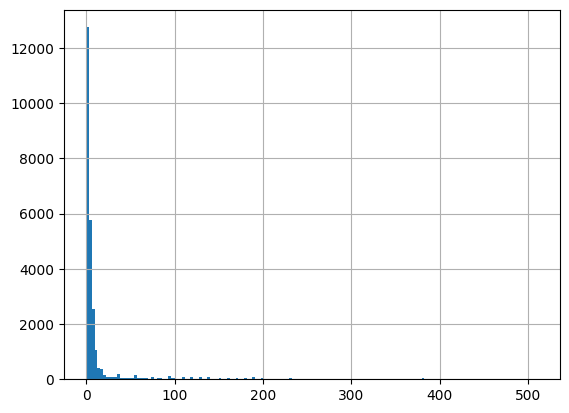
df = harmonize.harmonize(df, 'Turbidity', report=True, errors='ignore')
/opt/hostedtoolcache/Python/3.11.15/x64/lib/python3.11/site-packages/harmonize_wq/harmonize.py:149: UserWarning: Bad Turbidity unit: count
  warn(f"Bad Turbidity unit: {unit}")
/opt/hostedtoolcache/Python/3.11.15/x64/lib/python3.11/site-packages/harmonize_wq/convert.py:131: UserWarning: WARNING: 'count' converted to NaN
  warn(f"WARNING: '{unit}' converted to NaN")
-Usable results-
count    34827.000000
mean        15.519654
std         71.703547
min       -999.000000
25%          1.250000
50%          2.500000
75%          5.700000
max       4100.000000
dtype: float64
Unusable results: 3418
Usable results with inferred units: 275
Results outside threshold (0.0 to 445.740935): 215
[60]:
cols = ['ResultMeasureValue', 'ResultMeasure/MeasureUnitCode', 'QA_flag', 'Turbidity']
df.loc[df['CharacteristicName']=='Turbidity', cols]
[60]:
| ResultMeasureValue | ResultMeasure/MeasureUnitCode | QA_flag | Turbidity | |
|---|---|---|---|---|
| 290 | 1.0 | mg/l SiO2 | <NA> | 7.5701 Nephelometric_Turbidity_Units |
| 522 | 1 | JTU | <NA> | 18.9773 Nephelometric_Turbidity_Units |
| 531 | 30 | JTU | <NA> | 570.7023 Nephelometric_Turbidity_Units |
| 537 | 2 | JTU | <NA> | 38.0023 Nephelometric_Turbidity_Units |
| 542 | 7 | JTU | <NA> | 133.1273 Nephelometric_Turbidity_Units |
| ... | ... | ... | ... | ... |
| 484524 | 4.0 | mg/l SiO2 | <NA> | 30.378500000000003 Nephelometric_Turbidity_Units |
| 487572 | 2.3 | NTU | <NA> | 2.3 Nephelometric_Turbidity_Units |
| 487911 | 1.9 | NTU | <NA> | 1.9 Nephelometric_Turbidity_Units |
| 487949 | 1.7 | NTU | <NA> | 1.7 Nephelometric_Turbidity_Units |
| 487952 | 2 | NTU | <NA> | 2.0 Nephelometric_Turbidity_Units |
38245 rows × 4 columns
Sediment
[61]:
# Sediment
df = harmonize.harmonize(df, 'Sediment', report=False, errors='ignore')
/opt/hostedtoolcache/Python/3.11.15/x64/lib/python3.11/site-packages/harmonize_wq/convert.py:131: UserWarning: WARNING: 'g / ρH2O' converted to NaN
  warn(f"WARNING: '{unit}' converted to NaN")
/opt/hostedtoolcache/Python/3.11.15/x64/lib/python3.11/site-packages/harmonize_wq/convert.py:137: FutureWarning: The behavior of array concatenation with empty entries is deprecated. In a future version, this will no longer exclude empty items when determining the result dtype. To retain the old behavior, exclude the empty entries before the concat operation.
  return pandas.concat(lst_series).sort_index()
[62]:
cols = ['ResultMeasureValue', 'ResultMeasure/MeasureUnitCode', 'QA_flag', 'Sediment']
df.loc[df['CharacteristicName']=='Sediment', cols]
[62]:
| ResultMeasureValue | ResultMeasure/MeasureUnitCode | QA_flag | Sediment | |
|---|---|---|---|---|
| 226071 | 0.0024 | g | <NA> | NaN |
| 226078 | 0.0034 | g | <NA> | NaN |
| 226088 | 0.0016 | g | <NA> | NaN |
| 226099 | 0.0046 | g | <NA> | NaN |
| 226108 | 0.0016 | g | <NA> | NaN |
| ... | ... | ... | ... | ... |
| 332935 | 0.0049 | g | <NA> | NaN |
| 335435 | 0.0070 | g | <NA> | NaN |
| 335680 | 0.0093 | g | <NA> | NaN |
| 337913 | 0.0020 | g | <NA> | NaN |
| 338002 | 0.0049 | g | <NA> | NaN |
4410 rows × 4 columns
Phosphorus
Note: must be merged w/ activities (package runs query by site if not already merged)
[63]:
# Phosphorus
df = harmonize.harmonize(df, 'Phosphorus', errors='ignore')
/opt/hostedtoolcache/Python/3.11.15/x64/lib/python3.11/site-packages/pandas/core/construction.py:627: UnitStrippedWarning: The unit of the quantity is stripped when downcasting to ndarray.
  data = np.asarray(data)
/opt/hostedtoolcache/Python/3.11.15/x64/lib/python3.11/site-packages/pandas/core/construction.py:627: UnitStrippedWarning: The unit of the quantity is stripped when downcasting to ndarray.
  data = np.asarray(data)
/opt/hostedtoolcache/Python/3.11.15/x64/lib/python3.11/site-packages/pandas/core/construction.py:627: UnitStrippedWarning: The unit of the quantity is stripped when downcasting to ndarray.
  data = np.asarray(data)
/opt/hostedtoolcache/Python/3.11.15/x64/lib/python3.11/site-packages/harmonize_wq/convert.py:131: UserWarning: WARNING: 'umol/L * ρH2O' converted to NaN
  warn(f"WARNING: '{unit}' converted to NaN")
2 Phosphorus sample fractions not in frac_dict
2 Phosphorus sample fractions not in frac_dict found in expected domains, mapped to "Other_Phosphorus"
Note: warnings for unexpected characteristic fractions. Fractions are each seperated out into their own result column.
[64]:
# All Phosphorus
cols = ['ResultMeasureValue', 'ResultMeasure/MeasureUnitCode', 'QA_flag', 'TDP_Phosphorus']
df.loc[df['Phosphorus'].notna(), cols]
[64]:
| ResultMeasureValue | ResultMeasure/MeasureUnitCode | QA_flag | TDP_Phosphorus | |
|---|---|---|---|---|
| 1195 | 0.56 | mg/l PO4 | <NA> | NaN |
| 1291 | 0.89 | mg/l PO4 | <NA> | NaN |
| 1311 | 1.7 | mg/l PO4 | <NA> | NaN |
| 1355 | 0.28 | mg/l PO4 | <NA> | NaN |
| 1401 | 0.07 | mg/l PO4 | <NA> | NaN |
| ... | ... | ... | ... | ... |
| 487964 | 0.024 | mg/L | <NA> | NaN |
| 488419 | 0.01 | mg/L | <NA> | NaN |
| 488421 | 0.01 | mg/L | <NA> | NaN |
| 488512 | 0.011 | mg/L | <NA> | NaN |
| 488541 | 0.007 | mg/L | <NA> | NaN |
19507 rows × 4 columns
[65]:
# Total phosphorus
df.loc[df['TP_Phosphorus'].notna(), cols]
[65]:
| ResultMeasureValue | ResultMeasure/MeasureUnitCode | QA_flag | TDP_Phosphorus | |
|---|---|---|---|---|
| 1195 | 0.56 | mg/l PO4 | <NA> | NaN |
| 1291 | 0.89 | mg/l PO4 | <NA> | NaN |
| 1311 | 1.7 | mg/l PO4 | <NA> | NaN |
| 1355 | 0.28 | mg/l PO4 | <NA> | NaN |
| 1401 | 0.07 | mg/l PO4 | <NA> | NaN |
| ... | ... | ... | ... | ... |
| 487964 | 0.024 | mg/L | <NA> | NaN |
| 488419 | 0.01 | mg/L | <NA> | NaN |
| 488421 | 0.01 | mg/L | <NA> | NaN |
| 488512 | 0.011 | mg/L | <NA> | NaN |
| 488541 | 0.007 | mg/L | <NA> | NaN |
14234 rows × 4 columns
[66]:
# Total dissolved phosphorus
df.loc[df['TDP_Phosphorus'].notna(), cols]
[66]:
| ResultMeasureValue | ResultMeasure/MeasureUnitCode | QA_flag | TDP_Phosphorus | |
|---|---|---|---|---|
| 1483 | 0.080 | mg/l as P | <NA> | 0.08 milligram / liter |
| 1490 | 0.040 | mg/l as P | <NA> | 0.04 milligram / liter |
| 1493 | 0.290 | mg/l as P | <NA> | 0.29 milligram / liter |
| 1498 | 0.290 | mg/l as P | <NA> | 0.29 milligram / liter |
| 1503 | 0.110 | mg/l as P | <NA> | 0.11 milligram / liter |
| ... | ... | ... | ... | ... |
| 434788 | 0.03 | mg/L | <NA> | 0.03 milligram / liter |
| 434913 | 0.05 | mg/L | <NA> | 0.05 milligram / liter |
| 434919 | 0.02 | mg/L | <NA> | 0.02 milligram / liter |
| 434964 | 0.03 | mg/L | <NA> | 0.03 milligram / liter |
| 487059 | 0.07 | mg/l as P | <NA> | 0.07 milligram / liter |
4857 rows × 4 columns
[67]:
# All other phosphorus sample fractions
df.loc[df['Other_Phosphorus'].notna(), cols]
[67]:
| ResultMeasureValue | ResultMeasure/MeasureUnitCode | QA_flag | TDP_Phosphorus | |
|---|---|---|---|---|
| 25462 | 140 | mg/kg as P | <NA> | NaN |
| 25464 | 570 | mg/kg as P | <NA> | NaN |
| 25466 | 100 | mg/kg as P | <NA> | NaN |
| 25467 | 630 | mg/kg as P | <NA> | NaN |
| 25469 | 190 | mg/kg as P | <NA> | NaN |
| ... | ... | ... | ... | ... |
| 487046 | 1300 | mg/kg as P | <NA> | NaN |
| 487047 | 800 | mg/kg as P | <NA> | NaN |
| 487048 | 2100 | mg/kg as P | <NA> | NaN |
| 487049 | 1900 | mg/kg as P | <NA> | NaN |
| 487050 | 1700 | mg/kg as P | <NA> | NaN |
416 rows × 4 columns
Bacteria
Some equivalence assumptions are built-in where bacteria counts that are not equivalent are treated as such because there is no standard way to convert from one to another.
Fecal Coliform
[68]:
# Known unit with bad dimensionality ('Colony_Forming_Units * milliliter')
df = harmonize.harmonize(df, 'Fecal Coliform', report=True, errors='ignore')
/opt/hostedtoolcache/Python/3.11.15/x64/lib/python3.11/site-packages/harmonize_wq/convert.py:131: UserWarning: WARNING: 'cfu/100mL' converted to NaN
  warn(f"WARNING: '{unit}' converted to NaN")
/opt/hostedtoolcache/Python/3.11.15/x64/lib/python3.11/site-packages/harmonize_wq/convert.py:131: UserWarning: WARNING: 'CFU/100mL' converted to NaN
  warn(f"WARNING: '{unit}' converted to NaN")
/opt/hostedtoolcache/Python/3.11.15/x64/lib/python3.11/site-packages/harmonize_wq/convert.py:131: UserWarning: WARNING: 'MPN/100mL' converted to NaN
  warn(f"WARNING: '{unit}' converted to NaN")
-Usable results-
count      2462.000000
mean        910.512591
std        6103.365912
min           0.000000
25%          24.000000
50%          93.000000
75%         400.000000
max      250000.000000
dtype: float64
Unusable results: 5815
Usable results with inferred units: 1
Results outside threshold (0.0 to 37530.708061): 7
[69]:
cols = ['ResultMeasureValue', 'ResultMeasure/MeasureUnitCode', 'QA_flag', 'Fecal_Coliform']
df.loc[df['CharacteristicName']=='Fecal Coliform', cols]
[69]:
| ResultMeasureValue | ResultMeasure/MeasureUnitCode | QA_flag | Fecal_Coliform | |
|---|---|---|---|---|
| 0 | 1 | cfu/100ml | <NA> | 1.0 Colony_Forming_Units / milliliter |
| 1466 | 4200 | cfu/100ml | <NA> | 4200.0 Colony_Forming_Units / milliliter |
| 1542 | 410 | cfu/100ml | <NA> | 410.0 Colony_Forming_Units / milliliter |
| 1543 | 10000 | cfu/100ml | <NA> | 10000.0 Colony_Forming_Units / milliliter |
| 1548 | 10000 | cfu/100ml | <NA> | 10000.0 Colony_Forming_Units / milliliter |
| ... | ... | ... | ... | ... |
| 487960 | 400 | #/100mL | <NA> | NaN |
| 487961 | 300 | #/100mL | <NA> | NaN |
| 487962 | 24000 | #/100mL | <NA> | NaN |
| 488286 | NaN | #/100mL | ResultMeasureValue: missing (NaN) result | NaN |
| 488569 | 180 | #/100mL | <NA> | NaN |
8277 rows × 4 columns
Excherichia Coli
[70]:
# Known unit with bad dimensionality ('Colony_Forming_Units * milliliter')
df = harmonize.harmonize(df, 'Escherichia coli', report=True, errors='ignore')
/opt/hostedtoolcache/Python/3.11.15/x64/lib/python3.11/site-packages/harmonize_wq/wq_data.py:397: UserWarning: WARNING: 'CFUcol/100mL' UNDEFINED UNIT for E_coli
  warn("WARNING: " + problem)
/opt/hostedtoolcache/Python/3.11.15/x64/lib/python3.11/site-packages/harmonize_wq/convert.py:131: UserWarning: WARNING: 'cfu/100mL' converted to NaN
  warn(f"WARNING: '{unit}' converted to NaN")
/opt/hostedtoolcache/Python/3.11.15/x64/lib/python3.11/site-packages/harmonize_wq/convert.py:131: UserWarning: WARNING: 'count' converted to NaN
  warn(f"WARNING: '{unit}' converted to NaN")
/opt/hostedtoolcache/Python/3.11.15/x64/lib/python3.11/site-packages/harmonize_wq/convert.py:131: UserWarning: WARNING: 'CFU/100mL' converted to NaN
  warn(f"WARNING: '{unit}' converted to NaN")
/opt/hostedtoolcache/Python/3.11.15/x64/lib/python3.11/site-packages/harmonize_wq/convert.py:131: UserWarning: WARNING: '%' converted to NaN
  warn(f"WARNING: '{unit}' converted to NaN")
/opt/hostedtoolcache/Python/3.11.15/x64/lib/python3.11/site-packages/harmonize_wq/convert.py:131: UserWarning: WARNING: 'MPN/100mL' converted to NaN
  warn(f"WARNING: '{unit}' converted to NaN")
-Usable results-
count     5190.000000
mean       245.858339
std       1752.146999
min          0.000000
25%          0.500000
50%         30.000000
75%        127.750000
max      72000.000000
dtype: float64
Unusable results: 27996
Usable results with inferred units: 0
Results outside threshold (0.0 to 10758.740332): 14
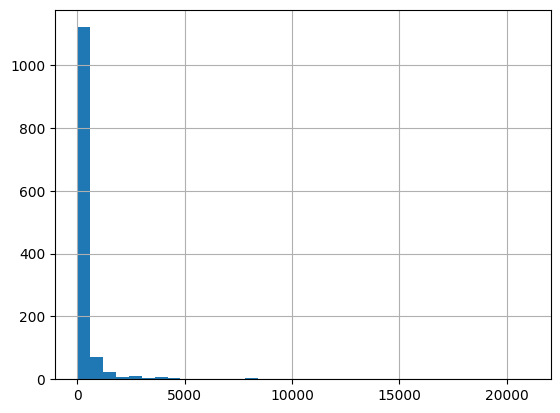
[71]:
cols = ['ResultMeasureValue', 'ResultMeasure/MeasureUnitCode', 'QA_flag', 'E_coli']
df.loc[df['CharacteristicName']=='Escherichia coli', cols]
[71]:
| ResultMeasureValue | ResultMeasure/MeasureUnitCode | QA_flag | E_coli | |
|---|---|---|---|---|
| 26654 | 930 | MPN/100mL | <NA> | NaN |
| 26768 | 430 | MPN/100mL | <NA> | NaN |
| 27894 | 430 | MPN/100mL | <NA> | NaN |
| 30004 | 40 | MPN/100mL | <NA> | NaN |
| 30012 | 90 | MPN/100mL | <NA> | NaN |
| ... | ... | ... | ... | ... |
| 475009 | 89 | #/100mL | <NA> | NaN |
| 475014 | 59 | #/100mL | <NA> | NaN |
| 475066 | 1 | #/100mL | <NA> | NaN |
| 475158 | 17 | #/100mL | <NA> | NaN |
| 475231 | 5 | #/100mL | <NA> | NaN |
33186 rows × 4 columns
Combining Salinity and Conductivity
Convert module has various functions to convert from one unit or characteristic to another. Some of these are used within a single characteristic during harmonization (e.g. DO saturation to concentration) while others are intended to model one characteristic as an indicator of another (e.g. estimate salinity from conductivity).
Note: this should only be done after both characteristic fields have been harmonized. Results before and after should be inspected, thresholds for outliers applied, and consider adding a QA_flag for modeled data.
Explore Salinity results:
[72]:
from harmonize_wq import convert
[73]:
# First note initial Salinity info
lst = [x.magnitude for x in list(df['Salinity'].dropna())]
q_sum = sum(lst)
print('Range: {} to {}'.format(min(lst), max(lst)))
print('Results: {} \nMean: {} PSU'.format(len(lst), q_sum/len(lst)))
Range: -30.0 to 2353411.35076
Results: 61120
Mean: 97.13901178910143 PSU
[74]:
# Identify extreme outliers
[x for x in lst if x >3200]
[74]:
[2353411.35076,
 24194.37887,
 23861.737250000002,
 31751.2528,
 31194.43736,
 31313.76893,
 31353.54444,
 45941.83208,
 45810.40456,
 33804.70568,
 33990.063630000004,
 34281.30126,
 34466.609300000004,
 44429.73173,
 44732.27128,
 45836.69098,
 45836.69098,
 39620.71727,
 39831.82757,
 46782.69821,
 46808.96773,
 46152.092430000004,
 46638.20765,
 50442.82954,
 50744.15562,
 32294.64946,
 33155.80126,
 30862.92099,
 30013.97503,
 32837.88507,
 33010.09661,
 50206.96576000001,
 50128.33604,
 32069.3581,
 32771.6455,
 33500.14717,
 33672.295320000005,
 6014.64368,
 6054.66579,
 5494.42166,
 5601.12346,
 4814.34137,
 4814.34137,
 5187.686659999999,
 5187.686659999999,
 13783.9303,
 13904.064310000002,
 13783.9303,
 13877.36806,
 12809.43281,
 12796.08268,
 9311.3677,
 9284.66554,
 32440.411480000002,
 32639.159120000004,
 29682.253500000003,
 29695.52346,
 42442.0254,
 42494.71251,
 41809.642770000006,
 42652.76323,
 35181.18554,
 35167.9553,
 25949.9177,
 28115.77097,
 41585.61329,
 41519.716250000005,
 40689.180210000006,
 40741.92548,
 13703.83969,
 13770.58193,
 21611.873320000002,
 21958.138479999998]
Other fields like units and QA_flag may help understand what caused high values and what results might need to be dropped from consideration
[75]:
# Columns to focus on
cols = ['ResultMeasureValue', 'ResultMeasure/MeasureUnitCode', 'QA_flag', 'Salinity']
[76]:
# Look at important fields for max 5 values
salinity_series = df['Salinity'][df['Salinity'].notna()]
salinity_series.sort_values(ascending=False, inplace=True)
df[cols][df['Salinity'].isin(salinity_series[0:5])]
[76]:
| ResultMeasureValue | ResultMeasure/MeasureUnitCode | QA_flag | Salinity | |
|---|---|---|---|---|
| 63038 | 4980 | mg/mL @25C | ResultTemperatureBasisText: updated from 25 de... | 2353411.35076 Practical_Salinity_Units |
| 347884 | 35.07 | g/L | <NA> | 50442.82954 Practical_Salinity_Units |
| 347885 | 35.3 | g/L | <NA> | 50744.15562 Practical_Salinity_Units |
| 348267 | 34.89 | g/L | <NA> | 50206.96576000001 Practical_Salinity_Units |
| 348270 | 34.83 | g/L | <NA> | 50128.33604 Practical_Salinity_Units |
Detection limits may help understand what caused low values and what results might need to be dropped or updated
[77]:
df = wrangle.add_detection(df, 'Salinity')
cols+=['ResultDetectionConditionText',
       'DetectionQuantitationLimitTypeName',
       'DetectionQuantitationLimitMeasure/MeasureValue',
       'DetectionQuantitationLimitMeasure/MeasureUnitCode']
[78]:
# Look at important fields for min 5 values (often multiple 0.0)
df[cols][df['Salinity'].isin(salinity_series[-5:])]
[78]:
| ResultMeasureValue | ResultMeasure/MeasureUnitCode | QA_flag | Salinity | ResultDetectionConditionText | DetectionQuantitationLimitTypeName | DetectionQuantitationLimitMeasure/MeasureValue | DetectionQuantitationLimitMeasure/MeasureUnitCode | |
|---|---|---|---|---|---|---|---|---|
| 22302 | 0 | ppth | <NA> | 0.0 Practical_Salinity_Units | NaN | NaN | NaN | NaN |
| 22303 | 0 | ppth | <NA> | 0.0 Practical_Salinity_Units | NaN | NaN | NaN | NaN |
| 22309 | 0 | ppth | <NA> | 0.0 Practical_Salinity_Units | NaN | NaN | NaN | NaN |
| 22331 | 0 | ppth | <NA> | 0.0 Practical_Salinity_Units | NaN | NaN | NaN | NaN |
| 22335 | 0 | ppth | <NA> | 0.0 Practical_Salinity_Units | NaN | NaN | NaN | NaN |
| ... | ... | ... | ... | ... | ... | ... | ... | ... |
| 471310 | 0 | ppt | <NA> | 0.0 Practical_Salinity_Units | NaN | Reporting limit | 0.0 | ppt |
| 471539 | 0 | ppt | <NA> | 0.0 Practical_Salinity_Units | NaN | Reporting limit | 0.0 | ppt |
| 472174 | 0 | ppt | <NA> | 0.0 Practical_Salinity_Units | NaN | Reporting limit | 0.0 | ppt |
| 472287 | 0 | ppt | <NA> | 0.0 Practical_Salinity_Units | NaN | Reporting limit | 0.0 | ppt |
| 472675 | 0 | ppt | <NA> | 0.0 Practical_Salinity_Units | NaN | Reporting limit | 0.0 | ppt |
876 rows × 8 columns
Explore conductivity results:
[79]:
# Create series for Conductivity values
cond_series = df['Conductivity'].dropna()
cond_series
[79]:
92666     327.0 microsiemens / centimeter
92671     127.0 microsiemens / centimeter
92824     345.0 microsiemens / centimeter
92826     348.0 microsiemens / centimeter
92831     344.0 microsiemens / centimeter
                       ...
426642    610.0 microsiemens / centimeter
426745    150.0 microsiemens / centimeter
427359    433.0 microsiemens / centimeter
428081    444.0 microsiemens / centimeter
428704    424.0 microsiemens / centimeter
Name: Conductivity, Length: 13563, dtype: object
Conductivity thresholds from Freshwater Explorer: 10 > x < 5000 us/cm, use a higher threshold for coastal waters
[80]:
# Sort and check other relevant columns before converting (e.g. Salinity)
cols = ['ResultMeasureValue', 'ResultMeasure/MeasureUnitCode', 'QA_flag', 'Salinity', 'Conductivity']
df.sort_values(by=['Conductivity'], ascending=False, inplace=True)
df.loc[df['Conductivity'].notna(), cols]
[80]:
| ResultMeasureValue | ResultMeasure/MeasureUnitCode | QA_flag | Salinity | Conductivity | |
|---|---|---|---|---|---|
| 351772 | 992 | mS/cm | <NA> | NaN | 992000.0 microsiemens / centimeter |
| 351782 | 270.2 | mS/cm | <NA> | NaN | 270200.0 microsiemens / centimeter |
| 352325 | 241.1 | mS/cm | <NA> | NaN | 241100.0 microsiemens / centimeter |
| 418403 | 57700 | uS/cm | <NA> | NaN | 57700.0 microsiemens / centimeter |
| 316795 | 52.418 | mS/cm | <NA> | NaN | 52418.0 microsiemens / centimeter |
| ... | ... | ... | ... | ... | ... |
| 345650 | 0 | uS/cm | <NA> | NaN | 0.0 microsiemens / centimeter |
| 379776 | 0 | mS/cm | <NA> | NaN | 0.0 microsiemens / centimeter |
| 346313 | 0 | uS/cm | <NA> | NaN | 0.0 microsiemens / centimeter |
| 170032 | 0 | uS/cm | <NA> | NaN | 0.0 microsiemens / centimeter |
| 343655 | 0 | uS/cm | <NA> | NaN | 0.0 microsiemens / centimeter |
13563 rows × 5 columns
[81]:
# Convert values to PSU and write to Salinity
cond_series = cond_series.apply(str)  # Convert to string to convert to dimensionless (PSU)
df.loc[df['Conductivity'].notna(), 'Salinity'] = cond_series.apply(convert.conductivity_to_PSU)
df.loc[df['Conductivity'].notna(), 'Salinity']
[81]:
351772    3226.305 dimensionless
351782      269.94 dimensionless
352325      227.97 dimensionless
418403      38.468 dimensionless
316795      34.521 dimensionless
                   ...
345650       0.012 dimensionless
379776       0.012 dimensionless
346313       0.012 dimensionless
170032       0.012 dimensionless
343655       0.012 dimensionless
Name: Salinity, Length: 13563, dtype: object
Datetime
datetime() formats time using dataretrieval and ActivityStart
[82]:
# First inspect the existing unformated fields
cols = ['ActivityStartDate', 'ActivityStartTime/Time', 'ActivityStartTime/TimeZoneCode']
df[cols]
[82]:
| ActivityStartDate | ActivityStartTime/Time | ActivityStartTime/TimeZoneCode | |
|---|---|---|---|
| 351772 | 2025-08-13 | 10:29:00 | EDT |
| 351782 | 2025-08-13 | 10:55:00 | EDT |
| 352325 | 2025-09-02 | 09:36:00 | EDT |
| 418403 | 2021-06-21 | NaN | NaN |
| 316795 | 2022-08-09 | 12:58:00 | EST |
| ... | ... | ... | ... |
| 488897 | 1956-08-16 | NaN | NaN |
| 488898 | 1956-06-16 | NaN | NaN |
| 488899 | 1956-07-01 | NaN | NaN |
| 488900 | 1955-08-16 | NaN | NaN |
| 488901 | 1952-08-16 | NaN | NaN |
488902 rows × 3 columns
[83]:
# 'ActivityStartDate' presserves date where 'Activity_datetime' is NAT due to no time zone
df = clean.datetime(df)
df[['ActivityStartDate', 'Activity_datetime']]
[83]:
| ActivityStartDate | Activity_datetime | |
|---|---|---|
| 351772 | 2025-08-13 | 2025-08-13 14:29:00+00:00 |
| 351782 | 2025-08-13 | 2025-08-13 14:55:00+00:00 |
| 352325 | 2025-09-02 | 2025-09-02 13:36:00+00:00 |
| 418403 | 2021-06-21 | NaT |
| 316795 | 2022-08-09 | 2022-08-09 17:58:00+00:00 |
| ... | ... | ... |
| 488897 | 1956-08-16 | NaT |
| 488898 | 1956-06-16 | NaT |
| 488899 | 1956-07-01 | NaT |
| 488900 | 1955-08-16 | NaT |
| 488901 | 1952-08-16 | NaT |
488902 rows × 2 columns
Activity_datetime combines all three time component columns into UTC. If time is missing this is NaT so a ActivityStartDate column is used to preserve date only.
Depth
Note: Data are often lacking sample depth metadata
[84]:
# Depth of sample (default units='meter')
df = clean.harmonize_depth(df)
#df.loc[df['ResultDepthHeightMeasure/MeasureValue'].dropna(), "Depth"]
df['ResultDepthHeightMeasure/MeasureValue'].dropna()
[84]:
118602    0.15
117407    0.15
109466    0.15
108414    0.15
117441    0.15
          ...
472946    0.15
472961    0.15
472963    0.15
472966    0.15
472968    0.15
Name: ResultDepthHeightMeasure/MeasureValue, Length: 23775, dtype: float64
Characteristic to Column (long to wide format)
[85]:
# Split single QA column into multiple by characteristic (rename the result to preserve these QA_flags)
df2 = wrangle.split_col(df)
df2
[85]:
| OrganizationIdentifier | OrganizationFormalName | ActivityIdentifier | ActivityStartDate | ActivityStartTime/Time | ActivityStartTime/TimeZoneCode | MonitoringLocationIdentifier | ResultIdentifier | DataLoggerLine | ResultDetectionConditionText | ... | QA_TP_Phosphorus | QA_TDP_Phosphorus | QA_Other_Phosphorus | QA_Nitrogen | QA_DO | QA_Chlorophyll | QA_Conductivity | QA_E_coli | QA_Fecal_Coliform | QA_Secchi | |
|---|---|---|---|---|---|---|---|---|---|---|---|---|---|---|---|---|---|---|---|---|---|
| 351772 | SSCW | Salem Sound Coastwatch (Volunteer) | SSCW-552 (P3):20250813:1029:FM:WB:0.5 | 2025-08-13 | 10:29:00 | EDT | SSCW-552 (P3) | STORET-1102951305 | NaN | NaN | ... | <NA> | <NA> | <NA> | <NA> | <NA> | <NA> | <NA> | <NA> | <NA> | <NA> |
| 351782 | SSCW | Salem Sound Coastwatch (Volunteer) | SSCW-P2:20250813:1055:FM:WB:0.5 | 2025-08-13 | 10:55:00 | EDT | SSCW-P2 | STORET-1102951334 | NaN | NaN | ... | <NA> | <NA> | <NA> | <NA> | <NA> | <NA> | <NA> | <NA> | <NA> | <NA> |
| 352325 | SSCW | Salem Sound Coastwatch (Volunteer) | SSCW-P2:20250902:0936:FM:WB:0.5 | 2025-09-02 | 09:36:00 | EDT | SSCW-P2 | STORET-1102951403 | NaN | NaN | ... | <NA> | <NA> | <NA> | <NA> | <NA> | <NA> | <NA> | <NA> | <NA> | <NA> |
| 418403 | NARS_WQX | EPA National Aquatic Resources Survey (NARS) | NARS_WQX-185450_2021 | 2021-06-21 | NaN | NaN | NARS_WQX-NWC_RI-10033 | STORET-1040684142 | NaN | NaN | ... | <NA> | <NA> | <NA> | <NA> | <NA> | <NA> | <NA> | <NA> | <NA> | <NA> |
| 316795 | WTGHA | Wompanoag Tribe of Gay Head Aquinnah (Tribal) | WTGHA-P3:20220809125800:FM:B | 2022-08-09 | 12:58:00 | EST | WTGHA-P3 | STORET-1041330082 | NaN | NaN | ... | <NA> | <NA> | <NA> | <NA> | <NA> | <NA> | <NA> | <NA> | <NA> | <NA> |
| ... | ... | ... | ... | ... | ... | ... | ... | ... | ... | ... | ... | ... | ... | ... | ... | ... | ... | ... | ... | ... | ... |
| 488896 | 11NPSWRD_WQX | National Park Service Water Resources Division | 11NPSWRD_WQX-CACO_DUCK_W_19570701_731710 | 1957-07-01 | NaN | NaN | 11NPSWRD_WQX-CACO_DUCK_W | STORET-740598867 | NaN | NaN | ... | <NA> | <NA> | <NA> | <NA> | <NA> | <NA> | <NA> | <NA> | <NA> | <NA> |
| 488897 | 11NPSWRD_WQX | National Park Service Water Resources Division | 11NPSWRD_WQX-CACO_DUCK_W_19560816_731708 | 1956-08-16 | NaN | NaN | 11NPSWRD_WQX-CACO_DUCK_W | STORET-740598866 | NaN | NaN | ... | <NA> | <NA> | <NA> | <NA> | <NA> | <NA> | <NA> | <NA> | <NA> | <NA> |
| 488898 | 11NPSWRD_WQX | National Park Service Water Resources Division | 11NPSWRD_WQX-CACO_DUCK_W_19560616_731704 | 1956-06-16 | NaN | NaN | 11NPSWRD_WQX-CACO_DUCK_W | STORET-740598862 | NaN | NaN | ... | <NA> | <NA> | <NA> | <NA> | <NA> | <NA> | <NA> | <NA> | <NA> | <NA> |
| 488899 | 11NPSWRD_WQX | National Park Service Water Resources Division | 11NPSWRD_WQX-CACO_DUCK_W_19560701_731705 | 1956-07-01 | NaN | NaN | 11NPSWRD_WQX-CACO_DUCK_W | STORET-740598863 | NaN | NaN | ... | <NA> | <NA> | <NA> | <NA> | <NA> | <NA> | <NA> | <NA> | <NA> | <NA> |
| 488900 | 11NPSWRD_WQX | National Park Service Water Resources Division | 11NPSWRD_WQX-CACO_GREAT_W_19550816_731703 | 1955-08-16 | NaN | NaN | 11NPSWRD_WQX-CACO_GREAT_W | STORET-740649462 | NaN | NaN | ... | <NA> | <NA> | <NA> | <NA> | <NA> | <NA> | <NA> | <NA> | <NA> | <NA> |
438394 rows × 121 columns
[86]:
# This expands the single col (QA_flag) out to a number of new columns based on the unique characteristicNames and speciation
print('{} new columns'.format(len(df2.columns) - len(df.columns)))
15 new columns
[87]:
# Note: there are fewer rows because NAN results are also dropped in this step
print('{} fewer rows'.format(len(df)-len(df2)))
50508 fewer rows
[88]:
#Examine Carbon flags from earlier in notebook (note these are empty now because NAN is dropped)
cols = ['ResultMeasureValue', 'ResultMeasure/MeasureUnitCode', 'Carbon', 'QA_Carbon']
df2.loc[df2['QA_Carbon'].notna(), cols]
[88]:
| ResultMeasureValue | ResultMeasure/MeasureUnitCode | Carbon | QA_Carbon |
|---|
Next the table is divided into the columns of interest (main_df) and characteristic specific metadata (chars_df)
[89]:
# split table into main and characteristics tables
main_df, chars_df = wrangle.split_table(df2)
[90]:
# Columns still in main table
main_df.columns
[90]:
Index(['OrganizationIdentifier', 'OrganizationFormalName',
       'ActivityIdentifier', 'MonitoringLocationIdentifier', 'ProviderName',
       'ActivityStartDateTime', 'AnalysisStartDateTime', 'AnalysisEndDateTime',
       'Secchi', 'Temperature', 'DO', 'pH', 'Salinity', 'Nitrogen',
       'Speciation', 'TOTAL NITROGEN_ MIXED FORMS', 'Conductivity',
       'Chlorophyll', 'Carbon', 'Turbidity', 'Sediment', 'Phosphorus',
       'TP_Phosphorus', 'TDP_Phosphorus', 'Other_Phosphorus', 'Fecal_Coliform',
       'E_coli', 'DetectionQuantitationLimitTypeName',
       'DetectionQuantitationLimitMeasure/MeasureValue',
       'DetectionQuantitationLimitMeasure/MeasureUnitCode',
       'Activity_datetime', 'Depth', 'QA_Turbidity', 'QA_Temperature',
       'QA_Carbon', 'QA_pH', 'QA_Salinity', 'QA_Sediment', 'QA_TP_Phosphorus',
       'QA_TDP_Phosphorus', 'QA_Other_Phosphorus', 'QA_Nitrogen', 'QA_DO',
       'QA_Chlorophyll', 'QA_Conductivity', 'QA_E_coli', 'QA_Fecal_Coliform',
       'QA_Secchi'],
      dtype='object')
[91]:
# look at main table results (first 5)
main_df.head()
[91]:
| OrganizationIdentifier | OrganizationFormalName | ActivityIdentifier | MonitoringLocationIdentifier | ProviderName | ActivityStartDateTime | AnalysisStartDateTime | AnalysisEndDateTime | Secchi | Temperature | ... | QA_TP_Phosphorus | QA_TDP_Phosphorus | QA_Other_Phosphorus | QA_Nitrogen | QA_DO | QA_Chlorophyll | QA_Conductivity | QA_E_coli | QA_Fecal_Coliform | QA_Secchi | |
|---|---|---|---|---|---|---|---|---|---|---|---|---|---|---|---|---|---|---|---|---|---|
| 351772 | SSCW | Salem Sound Coastwatch (Volunteer) | SSCW-552 (P3):20250813:1029:FM:WB:0.5 | SSCW-552 (P3) | STORET | 2025-08-13 14:29:00+00:00 | NaT | NaT | NaN | NaN | ... | <NA> | <NA> | <NA> | <NA> | <NA> | <NA> | <NA> | <NA> | <NA> | <NA> |
| 351782 | SSCW | Salem Sound Coastwatch (Volunteer) | SSCW-P2:20250813:1055:FM:WB:0.5 | SSCW-P2 | STORET | 2025-08-13 14:55:00+00:00 | NaT | NaT | NaN | NaN | ... | <NA> | <NA> | <NA> | <NA> | <NA> | <NA> | <NA> | <NA> | <NA> | <NA> |
| 352325 | SSCW | Salem Sound Coastwatch (Volunteer) | SSCW-P2:20250902:0936:FM:WB:0.5 | SSCW-P2 | STORET | 2025-09-02 13:36:00+00:00 | NaT | NaT | NaN | NaN | ... | <NA> | <NA> | <NA> | <NA> | <NA> | <NA> | <NA> | <NA> | <NA> | <NA> |
| 418403 | NARS_WQX | EPA National Aquatic Resources Survey (NARS) | NARS_WQX-185450_2021 | NARS_WQX-NWC_RI-10033 | STORET | NaT | NaT | NaT | NaN | NaN | ... | <NA> | <NA> | <NA> | <NA> | <NA> | <NA> | <NA> | <NA> | <NA> | <NA> |
| 316795 | WTGHA | Wompanoag Tribe of Gay Head Aquinnah (Tribal) | WTGHA-P3:20220809125800:FM:B | WTGHA-P3 | STORET | 2022-08-09 17:58:00+00:00 | NaT | NaT | NaN | NaN | ... | <NA> | <NA> | <NA> | <NA> | <NA> | <NA> | <NA> | <NA> | <NA> | <NA> |
5 rows × 48 columns
[92]:
# Empty columns that could be dropped (Mostly QA columns)
cols = list(main_df.columns)
x = main_df.dropna(axis=1, how='all')
[col for col in cols if col not in x.columns]
[92]:
['AnalysisStartDateTime',
 'AnalysisEndDateTime',
 'Sediment',
 'QA_Carbon',
 'QA_Sediment',
 'QA_TDP_Phosphorus',
 'QA_DO',
 'QA_Conductivity']
[93]:
# Map average results at each station
gdf_avg = visualize.map_measure(main_df, stations_clipped, 'Temperature')
gdf_avg.plot(column='mean', cmap='OrRd', legend=True)
[93]:
<Axes: >