Tampa Bay, FL - Detailed step-by-step
Standardize, clean and wrangle Water Quality Portal data in Tampa Bay, FL into more analytic-ready formats using the harmonize_wq package
US EPA’s Water Quality Portal (WQP) aggregates water quality, biological, and physical data provided by many organizations and has become an essential resource with tools to query and retrieval data using python or R. Given the variety of data and variety of data originators, using the data in analysis often requires data cleaning to ensure it meets the required quality standards and data wrangling to get it in a more analytic-ready format. Recognizing the definition of analysis-ready varies depending on the analysis, the harmonixe_wq package is intended to be a flexible water quality specific framework to help:
Identify differences in data units (including speciation and basis)
Identify differences in sampling or analytic methods
Resolve data errors using transparent assumptions
Reduce data to the columns that are most commonly needed
Transform data from long to wide format
Domain experts must decide what data meets their quality standards for data comparability and any thresholds for acceptance or rejection.
Detailed step-by-step workflow
This example workflow takes a deeper dive into some of the expanded functionality to examine results for different water quality parameters in Tampa Bay, FL
Install and import the required libraries
[1]:
import sys
#!python -m pip uninstall harmonize-wq --yes
# Use pip to install the package from pypi or the latest from github
#!{sys.executable} -m pip install harmonize-wq
# For latest dev version
#!{sys.executable} -m pip install git+https://github.com/USEPA/harmonize-wq.git@new_release_0-3-8
[2]:
import dataretrieval.wqp as wqp
from harmonize_wq import wrangle
from harmonize_wq import location
from harmonize_wq import harmonize
from harmonize_wq import visualize
from harmonize_wq import clean
Download location data using dataretrieval
[3]:
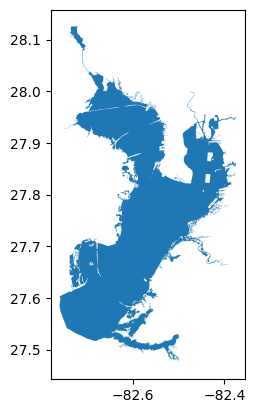
# Read geometry for Area of Interest from geojson file url and plot
aoi_url = r'https://github.com/USEPA/Coastal_Ecological_Indicators/raw/master/DGGS_Coastal/temperature_data/TampaBay.geojson'
# geoJSON should be WGS1984 standard, but this one isn't
aoi_gdf = wrangle.as_gdf(aoi_url).to_crs(epsg=4326)
aoi_gdf.plot()
[3]:
<Axes: >
[4]:
# Build query with characteristicNames and the AOI extent
query = {'characteristicName': ['Phosphorus',
                                'Temperature, water',
                                'Depth, Secchi disk depth',
                                'Dissolved oxygen (DO)',
                                'Salinity',
                                'pH',
                                'Nitrogen',
                                'Conductivity',
                                'Organic carbon',
                                'Chlorophyll a',
                                'Turbidity',
                                'Sediment',
                                'Fecal Coliform',
                                'Escherichia coli']}
query['bBox'] =wrangle.get_bounding_box(aoi_gdf)
[5]:
# Query stations (can be slow)
stations, site_md = wqp.what_sites(**query)
[6]:
# Rows and columns for results
stations.shape
[6]:
(16539, 37)
[7]:
# First 5 rows
stations.head()
[7]:
| OrganizationIdentifier | OrganizationFormalName | MonitoringLocationIdentifier | MonitoringLocationName | MonitoringLocationTypeName | MonitoringLocationDescriptionText | HUCEightDigitCode | DrainageAreaMeasure/MeasureValue | DrainageAreaMeasure/MeasureUnitCode | ContributingDrainageAreaMeasure/MeasureValue | ... | AquiferName | LocalAqfrName | FormationTypeText | AquiferTypeName | ConstructionDateText | WellDepthMeasure/MeasureValue | WellDepthMeasure/MeasureUnitCode | WellHoleDepthMeasure/MeasureValue | WellHoleDepthMeasure/MeasureUnitCode | ProviderName | |
|---|---|---|---|---|---|---|---|---|---|---|---|---|---|---|---|---|---|---|---|---|---|
| 0 | USGS-FL | USGS Florida Water Science Center | USGS-02300009 | MANATEE RIVER AT DEVILS ELBOW NEAR FT HAMER FL | Estuary | NaN | 03100202 | 139.0 | sq mi | NaN | ... | NaN | NaN | NaN | NaN | NaN | NaN | NaN | NaN | NaN | NWIS |
| 1 | USGS-FL | USGS Florida Water Science Center | USGS-02300018 | GAMBLE CREEK NEAR PARRISH FL | Stream | NaN | 03100202 | 50.6 | sq mi | NaN | ... | NaN | NaN | NaN | NaN | NaN | NaN | NaN | NaN | NaN | NWIS |
| 2 | USGS-FL | USGS Florida Water Science Center | USGS-02300021 | MANATEE RIVER AT FORT HAMER FL | Estuary | NaN | 03100202 | 216.0 | sq mi | NaN | ... | NaN | NaN | NaN | NaN | NaN | NaN | NaN | NaN | NaN | NWIS |
| 3 | USGS-FL | USGS Florida Water Science Center | USGS-02300062 | GLEN CREEK NEAR BRADENTON FL | Stream | NaN | 03100202 | 2.5 | sq mi | NaN | ... | NaN | NaN | NaN | NaN | NaN | NaN | NaN | NaN | NaN | NWIS |
| 4 | USGS-FL | USGS Florida Water Science Center | USGS-02300064 | BRADEN RIVER AT BRADENTON FL | Stream | NaN | 03100202 | 83.0 | sq mi | NaN | ... | NaN | NaN | NaN | NaN | NaN | NaN | NaN | NaN | NaN | NWIS |
5 rows × 37 columns
[8]:
# Columns used for an example row
stations.iloc[0][['HorizontalCoordinateReferenceSystemDatumName', 'LatitudeMeasure', 'LongitudeMeasure']]
[8]:
HorizontalCoordinateReferenceSystemDatumName        NAD83
LatitudeMeasure                                 27.520872
LongitudeMeasure                                -82.40176
Name: 0, dtype: object
[9]:
# Harmonize location datums to 4326 (Note we keep intermediate columns using intermediate_columns=True)
stations_gdf = location.harmonize_locations(stations, outEPSG=4326, intermediate_columns=True)
[10]:
# Every function has a dostring to help understand input/output and what it does
location.harmonize_locations?
[11]:
# Rows and columns for results after running the function (5 new columns, only 2 new if intermediate_columns=False)
stations_gdf.shape
[11]:
(16539, 42)
[12]:
# Example results for the new columns
stations_gdf.iloc[0][['geom_orig', 'EPSG', 'QA_flag', 'geom', 'geometry']]
[12]:
geom_orig         (-82.4017604, 27.5208719)
EPSG                                 4269.0
QA_flag                                <NA>
geom         POINT (-82.4017604 27.5208719)
geometry     POINT (-82.4017604 27.5208719)
Name: 0, dtype: object
[13]:
# geom and geometry look the same but geometry is a special datatype
stations_gdf['geometry'].dtype
[13]:
<geopandas.array.GeometryDtype at 0x7f342e951a10>
[14]:
# Look at the different QA_flag flags that have been assigned,
# e.g., for bad datums or limited decimal precision
set(stations_gdf.loc[stations_gdf['QA_flag'].notna()]['QA_flag'])
[14]:
{'HorizontalCoordinateReferenceSystemDatumName: Bad datum OTHER, EPSG:4326 assumed',
 'HorizontalCoordinateReferenceSystemDatumName: Bad datum UNKWN, EPSG:4326 assumed',
 'LatitudeMeasure: Imprecise: lessthan3decimaldigits',
 'LatitudeMeasure: Imprecise: lessthan3decimaldigits; HorizontalCoordinateReferenceSystemDatumName: Bad datum UNKWN, EPSG:4326 assumed',
 'LatitudeMeasure: Imprecise: lessthan3decimaldigits; LongitudeMeasure: Imprecise: lessthan3decimaldigits',
 'LongitudeMeasure: Imprecise: lessthan3decimaldigits',
 'LongitudeMeasure: Imprecise: lessthan3decimaldigits; HorizontalCoordinateReferenceSystemDatumName: Bad datum OTHER, EPSG:4326 assumed'}
[15]:
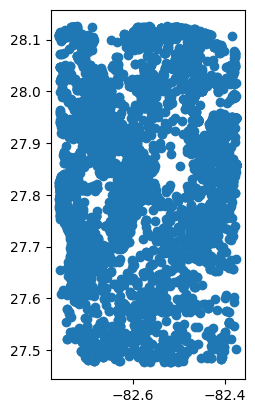
# Map it
stations_gdf.plot()
[15]:
<Axes: >
[16]:
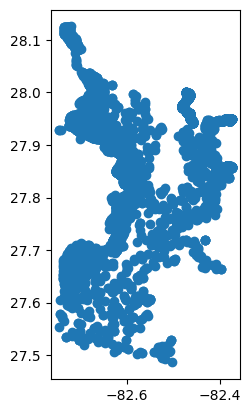
# Clip it to area of interest
stations_clipped = wrangle.clip_stations(stations_gdf, aoi_gdf)
[17]:
# Map it
stations_clipped.plot()
[17]:
<Axes: >
[18]:
# How many stations now?
len(stations_clipped)
[18]:
10930
[19]:
# To save the results to a shapefile
#import os
#path = ''  #specify the path (folder/directory) to save it to
#stations_clipped.to_file(os.path.join(path, 'Tampa_stations.shp'))
Retrieve Characteristic Data
[20]:
# Now query for results
query['dataProfile'] = 'narrowResult'
res_narrow, md_narrow = wqp.get_results(**query)
[21]:
df = res_narrow
df
[21]:
| OrganizationIdentifier | OrganizationFormalName | ActivityIdentifier | ActivityStartDate | ActivityStartTime/Time | ActivityStartTime/TimeZoneCode | MonitoringLocationIdentifier | ResultIdentifier | DataLoggerLine | ResultDetectionConditionText | ... | ResultDetectionQuantitationLimitUrl | LaboratoryAccreditationIndicator | LaboratoryAccreditationAuthorityName | TaxonomistAccreditationIndicator | TaxonomistAccreditationAuthorityName | LabSamplePreparationUrl | ProviderName | ActivityStartDateTime | AnalysisStartDateTime | AnalysisEndDateTime | |
|---|---|---|---|---|---|---|---|---|---|---|---|---|---|---|---|---|---|---|---|---|---|
| 0 | USGS-FL | USGS Florida Water Science Center | nwisfl.01.94202446 | 1942-04-14 | 12:00:00 | EDT | USGS-275840082305601 | NWIS-6769611 | NaN | NaN | ... | NaN | NaN | NaN | NaN | NaN | NaN | NWIS | 1942-04-14 16:00:00+00:00 | NaT | NaT |
| 1 | USGS-FL | USGS Florida Water Science Center | nwisfl.01.94202447 | 1942-05-05 | 12:00:00 | EDT | USGS-275850082310101 | NWIS-6769631 | NaN | NaN | ... | NaN | NaN | NaN | NaN | NaN | NaN | NWIS | 1942-05-05 16:00:00+00:00 | NaT | NaT |
| 2 | USGS-FL | USGS Florida Water Science Center | nwisfl.01.94202443 | 1942-05-13 | 12:00:00 | EDT | USGS-275823082312101 | NWIS-6769559 | NaN | NaN | ... | NaN | NaN | NaN | NaN | NaN | NaN | NWIS | 1942-05-13 16:00:00+00:00 | NaT | NaT |
| 3 | USGS-FL | USGS Florida Water Science Center | nwisfl.01.94202444 | 1942-05-13 | 12:00:00 | EDT | USGS-275826082312901 | NWIS-6769579 | NaN | NaN | ... | NaN | NaN | NaN | NaN | NaN | NaN | NWIS | 1942-05-13 16:00:00+00:00 | NaT | NaT |
| 4 | USGS-FL | USGS Florida Water Science Center | nwisfl.01.94202445 | 1942-05-13 | 12:00:00 | EDT | USGS-275835082313501 | NWIS-6769593 | NaN | NaN | ... | NaN | NaN | NaN | NaN | NaN | NaN | NWIS | 1942-05-13 16:00:00+00:00 | NaT | NaT |
| ... | ... | ... | ... | ... | ... | ... | ... | ... | ... | ... | ... | ... | ... | ... | ... | ... | ... | ... | ... | ... | ... |
| 1357452 | USGS-FL | USGS Florida Water Science Center | nwisfl.01.95500739 | 1955-03-25 | NaN | NaN | USGS-273236082335801 | NWIS-6842169 | NaN | NaN | ... | NaN | NaN | NaN | NaN | NaN | NaN | NWIS | NaT | NaT | NaT |
| 1357453 | USGS-FL | USGS Florida Water Science Center | nwisfl.01.95500762 | 1955-04-08 | NaN | NaN | USGS-273926082304501 | NWIS-6842541 | NaN | NaN | ... | NaN | NaN | NaN | NaN | NaN | NaN | NWIS | NaT | NaT | NaT |
| 1357454 | USGS-FL | USGS Florida Water Science Center | nwisfl.01.95500762 | 1955-04-08 | NaN | NaN | USGS-273926082304501 | NWIS-6842544 | NaN | NaN | ... | NaN | NaN | NaN | NaN | NaN | NaN | NWIS | NaT | NaT | NaT |
| 1357455 | USGS-FL | USGS Florida Water Science Center | nwisfl.01.95500782 | 1955-04-08 | NaN | NaN | USGS-274455082253601 | NWIS-6842941 | NaN | NaN | ... | NaN | NaN | NaN | NaN | NaN | NaN | NWIS | NaT | NaT | NaT |
| 1357456 | USGS-FL | USGS Florida Water Science Center | nwisfl.01.95500782 | 1955-04-08 | NaN | NaN | USGS-274455082253601 | NWIS-6842944 | NaN | NaN | ... | NaN | NaN | NaN | NaN | NaN | NaN | NWIS | NaT | NaT | NaT |
1357457 rows × 81 columns
[22]:
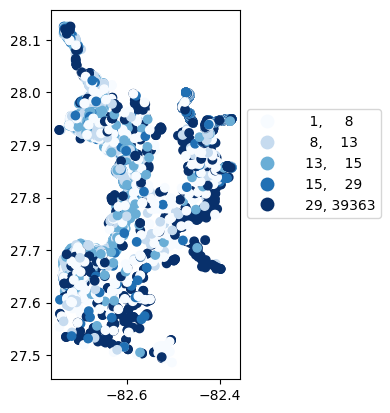
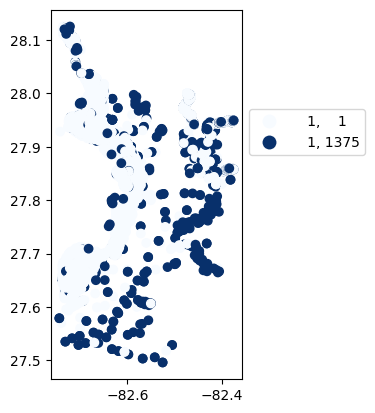
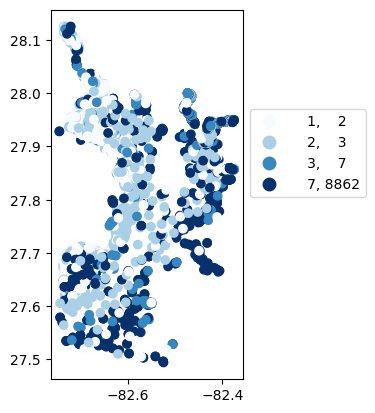
# Map number of usable results at each station
gdf_count = visualize.map_counts(df, stations_clipped)
legend_kwds = {"fmt": "{:.0f}", 'bbox_to_anchor':(1, 0.75)}
gdf_count.plot(column='cnt', cmap='Blues', legend=True, scheme='quantiles', legend_kwds=legend_kwds)
[22]:
<Axes: >
Harmonize Characteristic Results
Two options for functions to harmonize characteristics: harmonize_all() or harmonize(). harmonize_all runs functions on all characteristics and lets you specify how to handle errors harmonize runs functions only on the characteristic specified with char_val and lets you also choose output units, to keep intermediate columns and to do a quick report summarizing changes.
[23]:
# See Documentation
#harmonize.harmonize_all?
#harmonize.harmonize?
secchi disk depth
[24]:
# Each harmonize function has optional params, e.g., char_val is the characticName column value to use so we can send the entire df.
# Optional params: units='m', char_val='Depth, Secchi disk depth', out_col='Secchi', report=False)

# We start by demonstrating on secchi disk depth (units default to m, keep intermediate fields, see report)
df = harmonize.harmonize(df, 'Depth, Secchi disk depth', intermediate_columns=True, report=True)
-Usable results-
count    92675.000000
mean         1.472673
std          0.908834
min         -9.000000
25%          0.900000
50%          1.300000
75%          1.900000
max         32.004000
dtype: float64
Unusable results: 281
Usable results with inferred units: 1
Results outside threshold (0.0 to 6.925675): 55
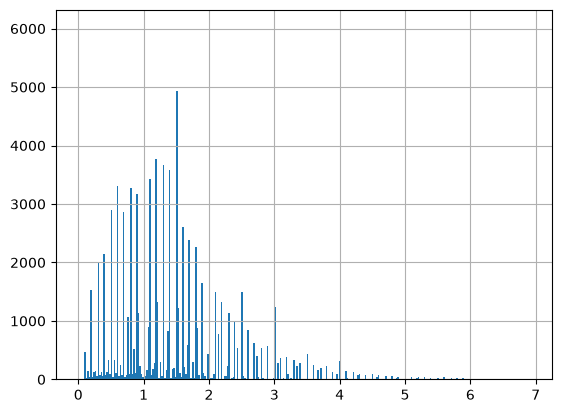
The threshold is based on standard deviations and is currently only used in the histogram.
[25]:
# Look at a table of just Secchi results and focus on subset of columns
cols = ['MonitoringLocationIdentifier', 'ResultMeasureValue', 'ResultMeasure/MeasureUnitCode', 'QA_flag', 'Units']
sechi_results = df.loc[df['CharacteristicName']=='Depth, Secchi disk depth', cols + ['Secchi']]
sechi_results
[25]:
| MonitoringLocationIdentifier | ResultMeasureValue | ResultMeasure/MeasureUnitCode | QA_flag | Units | Secchi | |
|---|---|---|---|---|---|---|
| 14656 | USGS-273630082420001 | 36.0 | in | <NA> | in | 0.9144 meter |
| 14667 | USGS-273630082420002 | 60.0 | in | <NA> | in | 1.524 meter |
| 14679 | USGS-273630082420004 | 36.0 | in | <NA> | in | 0.9144 meter |
| 14689 | USGS-273630082420005 | 18.0 | in | <NA> | in | 0.4572 meter |
| 14698 | USGS-273630082420006 | 24.0 | in | <NA> | in | 0.6095999999999999 meter |
| ... | ... | ... | ... | ... | ... | ... |
| 1357121 | USGS-274415082391203 | 11.0 | in | <NA> | in | 0.2794 meter |
| 1357122 | USGS-274415082391206 | 10.0 | in | <NA> | in | 0.254 meter |
| 1357123 | USGS-274415082391202 | 10.0 | in | <NA> | in | 0.254 meter |
| 1357124 | USGS-274415082391205 | 10.0 | in | <NA> | in | 0.254 meter |
| 1357127 | USGS-274415082391204 | 10.0 | in | <NA> | in | 0.254 meter |
92956 rows × 6 columns
[26]:
# Look at unusable(NAN) results
sechi_results.loc[df['Secchi'].isna()]
[26]:
| MonitoringLocationIdentifier | ResultMeasureValue | ResultMeasure/MeasureUnitCode | QA_flag | Units | Secchi | |
|---|---|---|---|---|---|---|
| 40354 | USGS-02306014 | NaN | NaN | ResultMeasureValue: missing (NaN) result; Resu... | m | NaN |
| 42887 | USGS-02306014 | NaN | NaN | ResultMeasureValue: missing (NaN) result; Resu... | m | NaN |
| 43179 | USGS-275100082280500 | NaN | NaN | ResultMeasureValue: missing (NaN) result; Resu... | m | NaN |
| 43185 | USGS-275100082280500 | NaN | NaN | ResultMeasureValue: missing (NaN) result; Resu... | m | NaN |
| 43204 | USGS-275530082383300 | NaN | NaN | ResultMeasureValue: missing (NaN) result; Resu... | m | NaN |
| ... | ... | ... | ... | ... | ... | ... |
| 1256169 | 21FLHILL_WQX-622 | Not Reported | m | ResultMeasureValue: "Not Reported" result cann... | m | NaN |
| 1256198 | 21FLHILL_WQX-506 | Not Reported | m | ResultMeasureValue: "Not Reported" result cann... | m | NaN |
| 1256215 | 21FLHILL_WQX-630 | Not Reported | m | ResultMeasureValue: "Not Reported" result cann... | m | NaN |
| 1256221 | 21FLHILL_WQX-616 | Not Reported | m | ResultMeasureValue: "Not Reported" result cann... | m | NaN |
| 1256916 | 21FLHILL_WQX-158 | Not Reported | m | ResultMeasureValue: "Not Reported" result cann... | m | NaN |
281 rows × 6 columns
[27]:
# look at the QA flag for first row from above
list(sechi_results.loc[df['Secchi'].isna()]['QA_flag'])[0]
[27]:
'ResultMeasureValue: missing (NaN) result; ResultMeasure/MeasureUnitCode: MISSING UNITS, m assumed'
[28]:
# All cases where there was a QA flag
sechi_results.loc[df['QA_flag'].notna()]
[28]:
| MonitoringLocationIdentifier | ResultMeasureValue | ResultMeasure/MeasureUnitCode | QA_flag | Units | Secchi | |
|---|---|---|---|---|---|---|
| 40354 | USGS-02306014 | NaN | NaN | ResultMeasureValue: missing (NaN) result; Resu... | m | NaN |
| 42887 | USGS-02306014 | NaN | NaN | ResultMeasureValue: missing (NaN) result; Resu... | m | NaN |
| 43179 | USGS-275100082280500 | NaN | NaN | ResultMeasureValue: missing (NaN) result; Resu... | m | NaN |
| 43185 | USGS-275100082280500 | NaN | NaN | ResultMeasureValue: missing (NaN) result; Resu... | m | NaN |
| 43204 | USGS-275530082383300 | NaN | NaN | ResultMeasureValue: missing (NaN) result; Resu... | m | NaN |
| ... | ... | ... | ... | ... | ... | ... |
| 1256198 | 21FLHILL_WQX-506 | Not Reported | m | ResultMeasureValue: "Not Reported" result cann... | m | NaN |
| 1256215 | 21FLHILL_WQX-630 | Not Reported | m | ResultMeasureValue: "Not Reported" result cann... | m | NaN |
| 1256221 | 21FLHILL_WQX-616 | Not Reported | m | ResultMeasureValue: "Not Reported" result cann... | m | NaN |
| 1256916 | 21FLHILL_WQX-158 | Not Reported | m | ResultMeasureValue: "Not Reported" result cann... | m | NaN |
| 1262856 | NARS_WQX-NCCA10-1674 | -9 | NaN | ResultMeasure/MeasureUnitCode: MISSING UNITS, ... | m | -9.0 meter |
282 rows × 6 columns
If both value and unit are missing nothing can be done, a unitless (NaN) value is assumed as to be in default units but a QA_flag is added
[29]:
# Aggregate secchi data by station
visualize.station_summary(sechi_results, 'Secchi')
[29]:
| MonitoringLocationIdentifier | cnt | mean | |
|---|---|---|---|
| 0 | 21FLBRA-1530-A | 2 | 0.375000 |
| 1 | 21FLBRA-1541B-A | 3 | 1.166667 |
| 2 | 21FLBRA-1574-A | 1 | 0.250000 |
| 3 | 21FLBRA-1574A-A | 2 | 0.250000 |
| 4 | 21FLBRA-1574A-B | 1 | 1.250000 |
| ... | ... | ... | ... |
| 12165 | USGS-280630082350900 | 3 | 1.966667 |
| 12166 | USGS-280635082322100 | 2 | 2.100000 |
| 12167 | USGS-280640082434700 | 3 | 2.302933 |
| 12168 | USGS-280719082291400 | 2 | 1.000000 |
| 12169 | USGS-280730082431800 | 3 | 1.947333 |
12170 rows × 3 columns
[30]:
# Map number of usable results at each station
gdf_count = visualize.map_counts(sechi_results, stations_clipped)
gdf_count.plot(column='cnt', cmap='Blues', legend=True, scheme='quantiles', legend_kwds=legend_kwds)
/opt/hostedtoolcache/Python/3.11.15/x64/lib/python3.11/site-packages/mapclassify/classifiers.py:1767: UserWarning: Not enough unique values in array to form 5 classes. Setting k to 2.
  self.bins = quantile(y, k=k)
[30]:
<Axes: >
[31]:
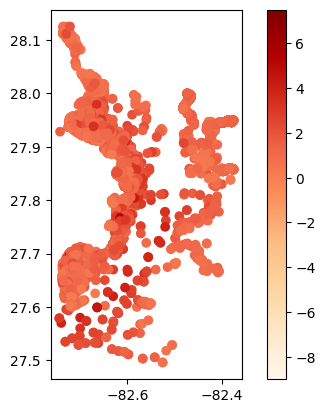
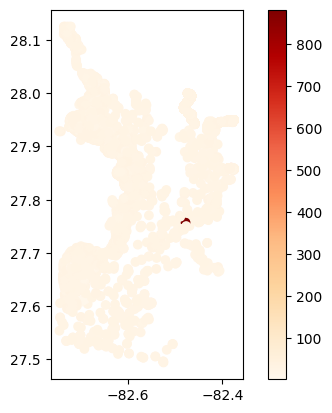
# Map average results at each station
gdf_avg = visualize.map_measure(sechi_results, stations_clipped, 'Secchi')
gdf_avg.plot(column='mean', cmap='OrRd', legend=True)
[31]:
<Axes: >
Temperature
The default error=’raise’, makes it so that there is an error when there is a dimensionality error (i.e. when units can’t be converted). Here we would get the error: DimensionalityError: Cannot convert from ‘count’ (dimensionless) to ‘degree_Celsius’ ([temperature])
[32]:
#'Temperature, water'
# Note: Default errors='raise'
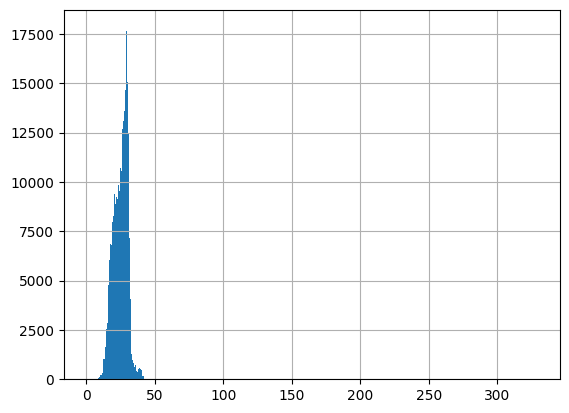
df = harmonize.harmonize(df, 'Temperature, water', intermediate_columns=True, report=True)
-Usable results-
count    313146.000000
mean         25.280097
std          78.216584
min          -2.900000
25%          21.200000
50%          25.860000
75%          29.200000
max       43696.000000
dtype: float64
Unusable results: 174
Usable results with inferred units: 0
Results outside threshold (0.0 to 494.579598): 2
[33]:
# Look at what was changed
cols = ['MonitoringLocationIdentifier', 'ResultMeasureValue', 'ResultMeasure/MeasureUnitCode', 'QA_flag', 'Temperature', 'Units']
temperature_results = df.loc[df['CharacteristicName']=='Temperature, water', cols]
temperature_results
[33]:
| MonitoringLocationIdentifier | ResultMeasureValue | ResultMeasure/MeasureUnitCode | QA_flag | Temperature | Units | |
|---|---|---|---|---|---|---|
| 11 | USGS-02304500 | 24.7 | deg C | <NA> | 24.7 degree_Celsius | degC |
| 14 | USGS-274406082240701 | 24.7 | deg C | <NA> | 24.7 degree_Celsius | degC |
| 15 | USGS-274446082260601 | 25.6 | deg C | <NA> | 25.6 degree_Celsius | degC |
| 17 | USGS-280118082274000 | 24.0 | deg C | <NA> | 24.0 degree_Celsius | degC |
| 28 | USGS-275734082274301 | 24.7 | deg C | <NA> | 24.7 degree_Celsius | degC |
| ... | ... | ... | ... | ... | ... | ... |
| 1357442 | USGS-273217082335701 | 28.9 | deg C | <NA> | 28.9 degree_Celsius | degC |
| 1357445 | USGS-274322082245501 | 24.4 | deg C | <NA> | 24.4 degree_Celsius | degC |
| 1357450 | USGS-274302082280801 | 25.0 | deg C | <NA> | 25.0 degree_Celsius | degC |
| 1357453 | USGS-273926082304501 | 25.7 | deg C | <NA> | 25.7 degree_Celsius | degC |
| 1357455 | USGS-274455082253601 | 26.1 | deg C | <NA> | 26.1 degree_Celsius | degC |
313320 rows × 6 columns
In the above we can see examples where the results were in deg F and in the result field they’ve been converted into degree_Celsius
[34]:
# Examine missing units
temperature_results.loc[df['ResultMeasure/MeasureUnitCode'].isna()]
[34]:
| MonitoringLocationIdentifier | ResultMeasureValue | ResultMeasure/MeasureUnitCode | QA_flag | Temperature | Units | |
|---|---|---|---|---|---|---|
| 40816 | USGS-02306028 | NaN | NaN | ResultMeasureValue: missing (NaN) result; Resu... | NaN | degC |
| 40820 | USGS-02306028 | NaN | NaN | ResultMeasureValue: missing (NaN) result; Resu... | NaN | degC |
| 1009661 | 21FLPDEM_WQX-35-04 | Not Reported | NaN | ResultMeasureValue: "Not Reported" result cann... | NaN | degC |
| 1014902 | 21FLPDEM_WQX-19-13 | Not Reported | NaN | ResultMeasureValue: "Not Reported" result cann... | NaN | degC |
| 1014930 | 21FLPDEM_WQX-19-08 | Not Reported | NaN | ResultMeasureValue: "Not Reported" result cann... | NaN | degC |
| ... | ... | ... | ... | ... | ... | ... |
| 1132468 | 21FLPDEM_WQX-23-08 | Not Reported | NaN | ResultMeasureValue: "Not Reported" result cann... | NaN | degC |
| 1135851 | 21FLPDEM_WQX-23-08 | Not Reported | NaN | ResultMeasureValue: "Not Reported" result cann... | NaN | degC |
| 1136562 | 21FLPDEM_WQX-35-01 | Not Reported | NaN | ResultMeasureValue: "Not Reported" result cann... | NaN | degC |
| 1140892 | 21FLPDEM_WQX-23-08 | Not Reported | NaN | ResultMeasureValue: "Not Reported" result cann... | NaN | degC |
| 1355412 | USGS-280228082343000 | NaN | NaN | ResultMeasureValue: missing (NaN) result; Resu... | NaN | degC |
87 rows × 6 columns
We can see where the units were missing, the results were assumed to be in degree_Celsius already
[35]:
# This is also noted in the QA_flag field
list(temperature_results.loc[df['ResultMeasure/MeasureUnitCode'].isna(), 'QA_flag'])[0]
[35]:
'ResultMeasureValue: missing (NaN) result; ResultMeasure/MeasureUnitCode: MISSING UNITS, degC assumed'
[36]:
# Look for any without usable results
temperature_results.loc[df['Temperature'].isna()]
[36]:
| MonitoringLocationIdentifier | ResultMeasureValue | ResultMeasure/MeasureUnitCode | QA_flag | Temperature | Units | |
|---|---|---|---|---|---|---|
| 40816 | USGS-02306028 | NaN | NaN | ResultMeasureValue: missing (NaN) result; Resu... | NaN | degC |
| 40820 | USGS-02306028 | NaN | NaN | ResultMeasureValue: missing (NaN) result; Resu... | NaN | degC |
| 1009661 | 21FLPDEM_WQX-35-04 | Not Reported | NaN | ResultMeasureValue: "Not Reported" result cann... | NaN | degC |
| 1014902 | 21FLPDEM_WQX-19-13 | Not Reported | NaN | ResultMeasureValue: "Not Reported" result cann... | NaN | degC |
| 1014930 | 21FLPDEM_WQX-19-08 | Not Reported | NaN | ResultMeasureValue: "Not Reported" result cann... | NaN | degC |
| ... | ... | ... | ... | ... | ... | ... |
| 1234351 | 21FLPDEM_WQX-10-06 | Not Reported | deg C | ResultMeasureValue: "Not Reported" result cann... | NaN | degC |
| 1235344 | 21FLPDEM_WQX-14-10 | Not Reported | deg C | ResultMeasureValue: "Not Reported" result cann... | NaN | degC |
| 1239696 | 21FLPDEM_WQX-10-06 | Not Reported | deg C | ResultMeasureValue: "Not Reported" result cann... | NaN | degC |
| 1241010 | 21FLPDEM_WQX-12-02 | Not Reported | deg C | ResultMeasureValue: "Not Reported" result cann... | NaN | degC |
| 1355412 | USGS-280228082343000 | NaN | NaN | ResultMeasureValue: missing (NaN) result; Resu... | NaN | degC |
174 rows × 6 columns
[37]:
# Aggregate temperature data by station
visualize.station_summary(temperature_results, 'Temperature')
[37]:
| MonitoringLocationIdentifier | cnt | mean | |
|---|---|---|---|
| 0 | 21FLBRA-1530-A | 12 | 27.593333 |
| 1 | 21FLBRA-1530-B | 7 | 26.290000 |
| 2 | 21FLBRA-1541A-A | 6 | 26.016667 |
| 3 | 21FLBRA-1541B-A | 6 | 26.743333 |
| 4 | 21FLBRA-1574-A | 5 | 27.890000 |
| ... | ... | ... | ... |
| 15334 | USGS-280726082313300 | 4 | 28.025000 |
| 15335 | USGS-280728082301101 | 54 | 25.083333 |
| 15336 | USGS-280729082313501 | 1 | 27.400000 |
| 15337 | USGS-280730082313201 | 1 | 24.700000 |
| 15338 | USGS-280730082431800 | 11 | 22.018182 |
15339 rows × 3 columns
[38]:
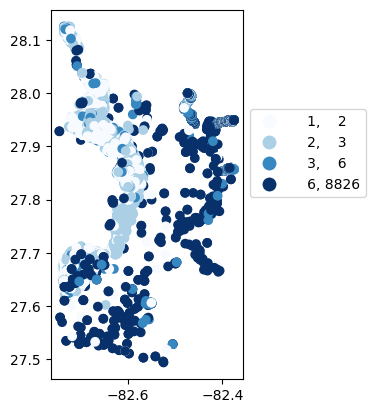
# Map number of usable results at each station
gdf_count = visualize.map_counts(temperature_results, stations_clipped)
gdf_count.plot(column='cnt', cmap='Blues', legend=True, scheme='quantiles', legend_kwds=legend_kwds)
/opt/hostedtoolcache/Python/3.11.15/x64/lib/python3.11/site-packages/mapclassify/classifiers.py:1767: UserWarning: Not enough unique values in array to form 5 classes. Setting k to 4.
  self.bins = quantile(y, k=k)
[38]:
<Axes: >
[39]:
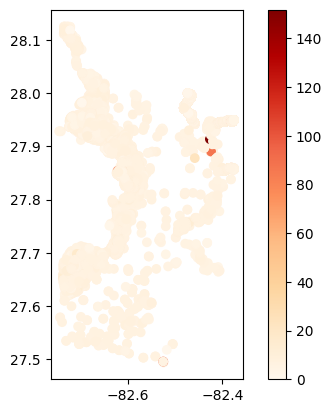
# Map average results at each station
gdf_avg = visualize.map_measure(temperature_results, stations_clipped, 'Temperature')
gdf_avg.plot(column='mean', cmap='OrRd', legend=True)
[39]:
<Axes: >
Dissolved oxygen
[40]:
# look at Dissolved oxygen (DO), but this time without intermediate fields
df = harmonize.harmonize(df, 'Dissolved oxygen (DO)')
Note: Imediately when we run a harmonization function without the intermediate fields they’re deleted.
[41]:
# Look at what was changed
cols = ['MonitoringLocationIdentifier', 'ResultMeasureValue', 'ResultMeasure/MeasureUnitCode', 'QA_flag', 'DO']
do_res = df.loc[df['CharacteristicName']=='Dissolved oxygen (DO)', cols]
do_res
[41]:
| MonitoringLocationIdentifier | ResultMeasureValue | ResultMeasure/MeasureUnitCode | QA_flag | DO | |
|---|---|---|---|---|---|
| 22986 | 21FLBSG-12 | 4.5 | mg/l | <NA> | 4.5 milligram / liter |
| 22987 | 21FLBSG-12 | 9.1 | mg/l | <NA> | 9.1 milligram / liter |
| 22988 | 21FLBSG-12 | 5.4 | mg/l | <NA> | 5.4 milligram / liter |
| 22990 | 21FLBSG-13 | 8.3 | mg/l | <NA> | 8.3 milligram / liter |
| 22992 | 21FLBSG-13 | 6.9 | mg/l | <NA> | 6.9 milligram / liter |
| ... | ... | ... | ... | ... | ... |
| 1353594 | 21FLMANA-449 | 6.4 | mg/l | <NA> | 6.4 milligram / liter |
| 1353613 | 21FLMANA-386 | 6.8 | mg/l | <NA> | 6.8 milligram / liter |
| 1353614 | 21FLMANA-LM3 | 8 | mg/l | <NA> | 8.0 milligram / liter |
| 1353615 | 21FLMANA-400 | 6.8 | mg/l | <NA> | 6.8 milligram / liter |
| 1353700 | 21FLMANA-421 | 6.8 | mg/l | <NA> | 6.8 milligram / liter |
282694 rows × 5 columns
[42]:
do_res.loc[do_res['ResultMeasure/MeasureUnitCode']!='mg/l']
[42]:
| MonitoringLocationIdentifier | ResultMeasureValue | ResultMeasure/MeasureUnitCode | QA_flag | DO | |
|---|---|---|---|---|---|
| 179852 | 21FLSWFD_WQX-22664 | 7.06 | mg/L | <NA> | 7.06 milligram / liter |
| 179854 | 21FLSWFD_WQX-22666 | 8.5 | mg/L | <NA> | 8.5 milligram / liter |
| 179858 | 21FLSWFD_WQX-22663 | 10.29 | mg/L | <NA> | 10.29 milligram / liter |
| 179860 | 21FLSWFD_WQX-22665 | 8.75 | mg/L | <NA> | 8.75 milligram / liter |
| 179871 | 21FLSWFD_WQX-22674 | 6.04 | mg/L | <NA> | 6.04 milligram / liter |
| ... | ... | ... | ... | ... | ... |
| 1352896 | 21FLMANA_WQX-532 | 8.9 | mg/L | <NA> | 8.9 milligram / liter |
| 1352900 | 21FLMANA_WQX-458 | 6.4 | mg/L | <NA> | 6.4 milligram / liter |
| 1352902 | 21FLMANA_WQX-400 | 6.8 | mg/L | <NA> | 6.8 milligram / liter |
| 1352906 | 21FLMANA_WQX-LM4 | 7.2 | mg/L | <NA> | 7.2 milligram / liter |
| 1352908 | 21FLMANA_WQX-464 | 7.2 | mg/L | <NA> | 7.2 milligram / liter |
185705 rows × 5 columns
Though there were no results in %, the conversion from percent saturation (%) to mg/l is special. This equation is being improved by integrating tempertaure and pressure instead of assuming STP (see DO_saturation())
[43]:
# Aggregate data by station
visualize.station_summary(do_res, 'DO')
[43]:
| MonitoringLocationIdentifier | cnt | mean | |
|---|---|---|---|
| 0 | 21FLBRA-1530-A | 12 | 2.785000 |
| 1 | 21FLBRA-1530-B | 7 | 4.042857 |
| 2 | 21FLBRA-1541A-A | 6 | 4.721667 |
| 3 | 21FLBRA-1541B-A | 6 | 6.600000 |
| 4 | 21FLBRA-1574-A | 5 | 4.378000 |
| ... | ... | ... | ... |
| 13907 | NARS_WQX-NCCA10-1672 | 8 | 5.437500 |
| 13908 | NARS_WQX-NCCA10-1673 | 20 | 4.115000 |
| 13909 | NARS_WQX-NCCA10-1674 | 6 | 2.466667 |
| 13910 | NARS_WQX-NLA_FL-10008 | 5 | 6.500000 |
| 13911 | NARS_WQX-NLA_FL-10127 | 3 | 9.033333 |
13912 rows × 3 columns
[44]:
# Map number of usable results at each station
gdf_count = visualize.map_counts(do_res, stations_clipped)
gdf_count.plot(column='cnt', cmap='Blues', legend=True, scheme='quantiles', legend_kwds=legend_kwds)
/opt/hostedtoolcache/Python/3.11.15/x64/lib/python3.11/site-packages/mapclassify/classifiers.py:1767: UserWarning: Not enough unique values in array to form 5 classes. Setting k to 4.
  self.bins = quantile(y, k=k)
[44]:
<Axes: >
[45]:
# Map average results at each station
gdf_avg = visualize.map_measure(do_res, stations_clipped, 'DO')
gdf_avg.plot(column='mean', cmap='OrRd', legend=True)
[45]:
<Axes: >
pH
[46]:
# pH, this time looking at a report
df = harmonize.harmonize(df, 'pH', report=True)
-Usable results-
count    109141.000000
mean          7.777128
std           0.474314
min           0.800000
25%           7.600000
50%           7.890000
75%           8.060000
max          11.620000
dtype: float64
Unusable results: 2
Usable results with inferred units: 90622
Results outside threshold (0.0 to 10.623011): 4
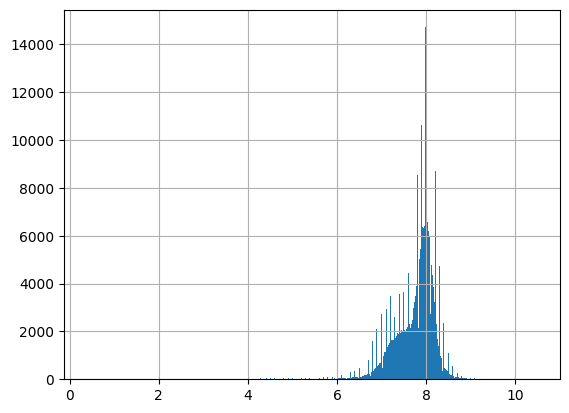
Note the warnings that occur when a unit is not recognized by the package. These occur even when report=False. Future versions could include these as defined units for pH, but here it wouldn’t alter results.
[47]:
df.loc[df['CharacteristicName']=='pH', ['ResultMeasureValue', 'ResultMeasure/MeasureUnitCode', 'QA_flag', 'pH']]
[47]:
| ResultMeasureValue | ResultMeasure/MeasureUnitCode | QA_flag | pH | |
|---|---|---|---|---|
| 0 | 7.5 | std units | <NA> | 7.5 dimensionless |
| 1 | 7.7 | std units | <NA> | 7.7 dimensionless |
| 2 | 7.7 | std units | <NA> | 7.7 dimensionless |
| 3 | 7.7 | std units | <NA> | 7.7 dimensionless |
| 4 | 7.2 | std units | <NA> | 7.2 dimensionless |
| ... | ... | ... | ... | ... |
| 1357449 | 6.8 | std units | <NA> | 6.8 dimensionless |
| 1357451 | 7.9 | std units | <NA> | 7.9 dimensionless |
| 1357452 | 7.3 | std units | <NA> | 7.3 dimensionless |
| 1357454 | 7.8 | std units | <NA> | 7.8 dimensionless |
| 1357456 | 7.6 | std units | <NA> | 7.6 dimensionless |
109143 rows × 4 columns
‘None’ is uninterpretable and replaced with NaN, which then gets replaced with ‘dimensionless’ since pH is unitless
Salinity
[48]:
# Salinity
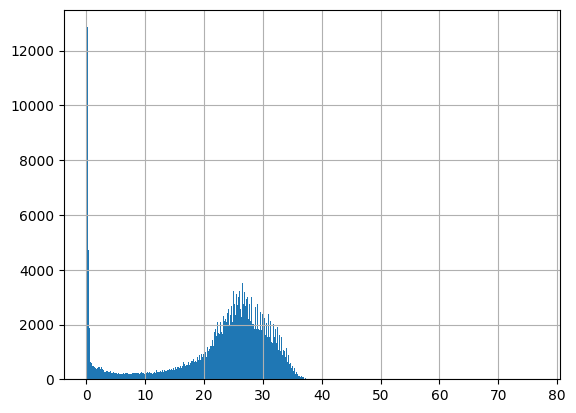
df = harmonize.harmonize(df, 'Salinity', report=True, errors='ignore')
/opt/hostedtoolcache/Python/3.11.15/x64/lib/python3.11/site-packages/harmonize_wq/basis.py:343: FutureWarning: Setting an item of incompatible dtype is deprecated and will raise an error in a future version of pandas. Value '@25C' has dtype incompatible with float64, please explicitly cast to a compatible dtype first.
  df_out.loc[mask, basis_col] = basis
/opt/hostedtoolcache/Python/3.11.15/x64/lib/python3.11/site-packages/harmonize_wq/wq_data.py:512: FutureWarning: Setting an item of incompatible dtype is deprecated and will raise an error in a future version of pandas. Value '[nan nan nan ... nan nan nan]' has dtype incompatible with float64, please explicitly cast to a compatible dtype first.
  self.df[c_mask] = basis.update_result_basis(
-Usable results-
count    279633.000000
mean         21.577041
std          93.242129
min          -0.020000
25%          17.700000
50%          24.870000
75%          28.650000
max       48930.000000
dtype: float64
Unusable results: 1275
Usable results with inferred units: 0
Results outside threshold (0.0 to 581.029816): 4
[49]:
cols = ['ResultMeasureValue', 'ResultMeasure/MeasureUnitCode', 'QA_flag', 'Salinity']
df.loc[df['CharacteristicName']=='Salinity', cols]
[49]:
| ResultMeasureValue | ResultMeasure/MeasureUnitCode | QA_flag | Salinity | |
|---|---|---|---|---|
| 17997 | 21.44 | PSS | <NA> | 21.44 Practical_Salinity_Units |
| 17999 | 21.51 | PSS | <NA> | 21.51 Practical_Salinity_Units |
| 18001 | 21.51 | PSS | <NA> | 21.51 Practical_Salinity_Units |
| 18002 | 21.51 | PSS | <NA> | 21.51 Practical_Salinity_Units |
| 18054 | 24.73 | PSS | <NA> | 24.73 Practical_Salinity_Units |
| ... | ... | ... | ... | ... |
| 1353595 | 20 | ppth | <NA> | 20.0 Practical_Salinity_Units |
| 1353623 | 26 | ppth | <NA> | 26.0 Practical_Salinity_Units |
| 1353624 | 27 | ppth | <NA> | 27.0 Practical_Salinity_Units |
| 1353659 | 28 | ppth | <NA> | 28.0 Practical_Salinity_Units |
| 1353665 | 16 | ppth | <NA> | 16.0 Practical_Salinity_Units |
280908 rows × 4 columns
Nitrogen
[50]:
# Nitrogen
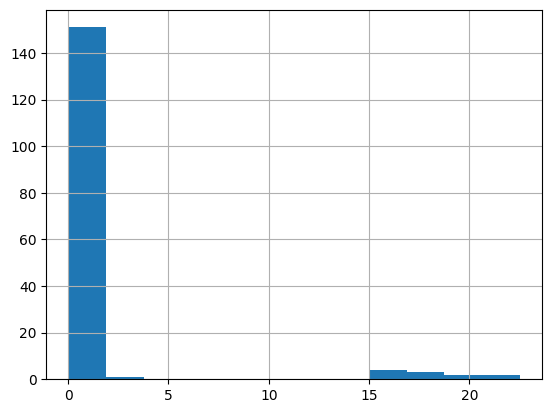
df = harmonize.harmonize(df, 'Nitrogen', report=True)
/opt/hostedtoolcache/Python/3.11.15/x64/lib/python3.11/site-packages/harmonize_wq/basis.py:343: FutureWarning: Setting an item of incompatible dtype is deprecated and will raise an error in a future version of pandas. Value 'as N' has dtype incompatible with float64, please explicitly cast to a compatible dtype first.
  df_out.loc[mask, basis_col] = basis
/opt/hostedtoolcache/Python/3.11.15/x64/lib/python3.11/site-packages/harmonize_wq/wq_data.py:486: FutureWarning: Setting an item of incompatible dtype is deprecated and will raise an error in a future version of pandas. Value '[nan nan nan nan nan nan nan nan nan nan nan nan nan nan nan nan nan nan
 nan nan nan nan nan nan nan nan nan nan nan nan nan nan nan nan nan nan
 nan nan nan nan nan nan nan nan nan 'as N' 'as N' 'as N' 'as N' 'as N'
 'as N' 'as N' 'as N' nan nan nan nan nan nan nan nan nan nan nan nan nan
 nan nan nan nan nan nan nan nan nan nan nan nan nan nan nan nan nan nan
 nan nan nan nan nan nan nan nan nan nan nan nan nan nan nan 'as N' nan
 nan nan 'as N' nan nan nan nan nan nan nan nan nan nan nan nan nan nan
 nan nan nan nan nan nan nan nan 'as N' nan 'as N' nan nan nan nan nan nan
 nan nan nan nan nan nan nan nan nan nan nan 'as N' nan nan nan nan 'as N'
 nan nan nan nan nan nan nan nan nan nan nan 'as N' 'as N']' has dtype incompatible with float64, please explicitly cast to a compatible dtype first.
  self.df[c_mask] = basis.basis_from_method_spec(self.df[c_mask])
/opt/hostedtoolcache/Python/3.11.15/x64/lib/python3.11/site-packages/harmonize_wq/domains.py:277: FutureWarning: Downcasting object dtype arrays on .fillna, .ffill, .bfill is deprecated and will change in a future version. Call result.infer_objects(copy=False) instead. To opt-in to the future behavior, set `pd.set_option('future.no_silent_downcasting', True)`
  sub_df[cols[2]] = sub_df[cols[2]].fillna(sub_df[cols[1]])  # new_fract
-Usable results-
count    163.000000
mean       1.575389
std        4.532429
min        0.024000
25%        0.202720
50%        0.315560
75%        0.500170
max       22.500000
dtype: float64
Unusable results: 2
Usable results with inferred units: 0
Results outside threshold (0.0 to 28.769965): 0
[51]:
cols = ['ResultMeasureValue', 'ResultMeasure/MeasureUnitCode', 'QA_flag', 'Nitrogen']
df.loc[df['CharacteristicName']=='Nitrogen', cols]
[51]:
| ResultMeasureValue | ResultMeasure/MeasureUnitCode | QA_flag | Nitrogen | |
|---|---|---|---|---|
| 280189 | 0.073 | mg/l | <NA> | 0.073 milligram / liter |
| 283649 | 0.036 | mg/l | <NA> | 0.036 milligram / liter |
| 287060 | 0.124 | mg/l | <NA> | 0.124 milligram / liter |
| 291014 | 0.144 | mg/l | <NA> | 0.144 milligram / liter |
| 294607 | 0.191 | mg/l | <NA> | 0.191 milligram / liter |
| ... | ... | ... | ... | ... |
| 1306679 | 0.416 | mg/L | <NA> | 0.416 milligram / liter |
| 1307318 | 0.451 | mg/L | <NA> | 0.451 milligram / liter |
| 1307996 | 0.2163 | mg/L | <NA> | 0.2163 milligram / liter |
| 1327101 | 1.68 | mg/L | <NA> | 1.68 milligram / liter |
| 1331339 | 1.57 | mg/L | <NA> | 1.57 milligram / liter |
165 rows × 4 columns
Conductivity
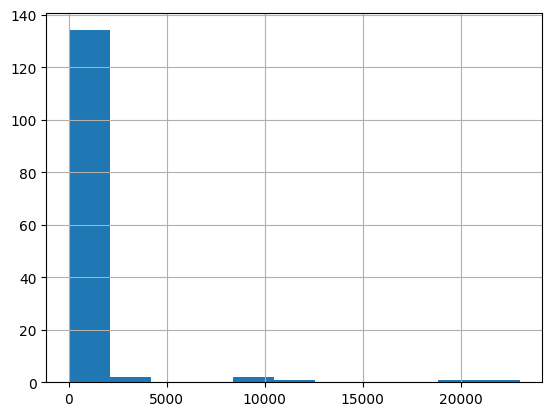
[52]:
# Conductivity
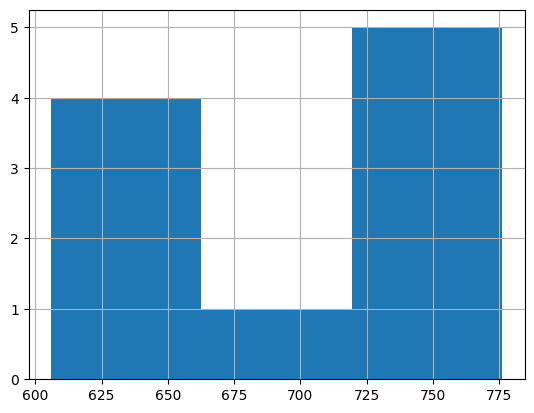
df = harmonize.harmonize(df, 'Conductivity', report=True)
-Usable results-
count       11.000000
mean      2503.363636
std       5969.279978
min        606.000000
25%        629.500000
50%        775.000000
75%        776.000000
max      20500.000000
dtype: float64
Unusable results: 8
Usable results with inferred units: 0
Results outside threshold (0.0 to 38319.043504): 0
[53]:
cols = ['ResultMeasureValue', 'ResultMeasure/MeasureUnitCode', 'QA_flag', 'Conductivity']
df.loc[df['CharacteristicName']=='Conductivity', cols]
[53]:
| ResultMeasureValue | ResultMeasure/MeasureUnitCode | QA_flag | Conductivity | |
|---|---|---|---|---|
| 1262650 | NaN | uS/cm | ResultMeasureValue: missing (NaN) result | NaN |
| 1262664 | NaN | uS/cm | ResultMeasureValue: missing (NaN) result | NaN |
| 1262667 | NaN | uS/cm | ResultMeasureValue: missing (NaN) result | NaN |
| 1262675 | NaN | uS/cm | ResultMeasureValue: missing (NaN) result | NaN |
| 1262679 | NaN | uS/cm | ResultMeasureValue: missing (NaN) result | NaN |
| 1262683 | NaN | uS/cm | ResultMeasureValue: missing (NaN) result | NaN |
| 1262690 | NaN | uS/cm | ResultMeasureValue: missing (NaN) result | NaN |
| 1262725 | NaN | uS/cm | ResultMeasureValue: missing (NaN) result | NaN |
| 1262731 | 626 | uS/cm | <NA> | 626.0 microsiemens / centimeter |
| 1262735 | 688 | uS/cm | <NA> | 688.0 microsiemens / centimeter |
| 1262742 | 606 | uS/cm | <NA> | 606.0 microsiemens / centimeter |
| 1262743 | 606 | uS/cm | <NA> | 606.0 microsiemens / centimeter |
| 1262746 | 633 | uS/cm | <NA> | 633.0 microsiemens / centimeter |
| 1263223 | 776 | uS/cm | <NA> | 776.0 microsiemens / centimeter |
| 1263226 | 776 | uS/cm | <NA> | 776.0 microsiemens / centimeter |
| 1263227 | 775 | uS/cm | <NA> | 775.0 microsiemens / centimeter |
| 1263232 | 776 | uS/cm | <NA> | 776.0 microsiemens / centimeter |
| 1263236 | 775 | uS/cm | <NA> | 775.0 microsiemens / centimeter |
| 1266569 | 20500 | uS/cm | <NA> | 20500.0 microsiemens / centimeter |
Chlorophyll a
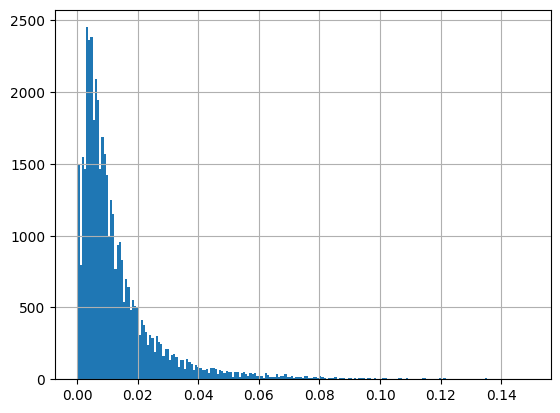
[54]:
# Chlorophyll a
df = harmonize.harmonize(df, 'Chlorophyll a', report=True)
-Usable results-
count    43334.000000
mean         0.014368
std          0.022741
min         -0.000506
25%          0.004600
50%          0.008725
75%          0.016360
max          1.552000
dtype: float64
Unusable results: 1115
Usable results with inferred units: 4
Results outside threshold (0.0 to 0.150814): 197
[55]:
cols = ['ResultMeasureValue', 'ResultMeasure/MeasureUnitCode', 'QA_flag', 'Chlorophyll']
df.loc[df['CharacteristicName']=='Chlorophyll a', cols]
[55]:
| ResultMeasureValue | ResultMeasure/MeasureUnitCode | QA_flag | Chlorophyll | |
|---|---|---|---|---|
| 16181 | 1.0 | ug/l | <NA> | 0.001 milligram / liter |
| 16186 | NaN | NaN | ResultMeasureValue: missing (NaN) result; Resu... | NaN |
| 16193 | 1.4 | ug/l | <NA> | 0.0014 milligram / liter |
| 16196 | 0.2 | ug/l | <NA> | 0.0002 milligram / liter |
| 18057 | 21.69 | ug/l | <NA> | 0.02169 milligram / liter |
| ... | ... | ... | ... | ... |
| 1356931 | 4 | ug/l | <NA> | 0.004 milligram / liter |
| 1356934 | 3 | ug/l | <NA> | 0.003 milligram / liter |
| 1356936 | 4 | ug/l | <NA> | 0.004 milligram / liter |
| 1356937 | 5 | ug/l | <NA> | 0.005 milligram / liter |
| 1356938 | 6 | ug/l | <NA> | 0.006 milligram / liter |
44449 rows × 4 columns
Organic Carbon
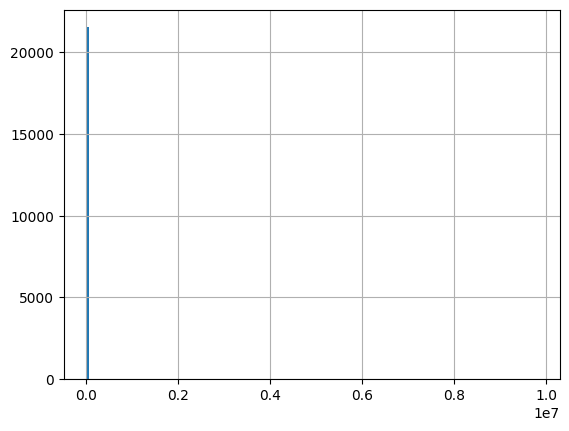
[56]:
# Organic carbon (%)
df = harmonize.harmonize(df, 'Organic carbon', report=True)
-Usable results-
count    2.407400e+04
mean     2.206620e+04
std      1.803432e+06
min      0.000000e+00
25%      4.540000e+00
50%      7.000000e+00
75%      1.200000e+01
max      2.000000e+08
dtype: float64
Unusable results: 1956
Usable results with inferred units: 0
Results outside threshold (0.0 to 10842655.304856): 8
[57]:
cols = ['ResultMeasureValue', 'ResultMeasure/MeasureUnitCode', 'QA_flag', 'Carbon']
df.loc[df['CharacteristicName']=='Organic carbon', cols]
[57]:
| ResultMeasureValue | ResultMeasure/MeasureUnitCode | QA_flag | Carbon | |
|---|---|---|---|---|
| 447 | 19.0 | mg/l | <NA> | 19.0 milligram / liter |
| 451 | 83.0 | mg/l | <NA> | 83.0 milligram / liter |
| 457 | 15.0 | mg/l | <NA> | 15.0 milligram / liter |
| 458 | 21.0 | mg/l | <NA> | 21.0 milligram / liter |
| 475 | 46.0 | mg/l | <NA> | 46.0 milligram / liter |
| ... | ... | ... | ... | ... |
| 1355407 | 12.0 | mg/l | <NA> | 12.0 milligram / liter |
| 1355414 | 4.5 | mg/l | <NA> | 4.5 milligram / liter |
| 1355460 | 9.0 | mg/l | <NA> | 9.0 milligram / liter |
| 1355464 | 6.0 | mg/l | <NA> | 6.0 milligram / liter |
| 1357142 | 9.0 | mg/l | <NA> | 9.0 milligram / liter |
26030 rows × 4 columns
Turbidity (NTU)
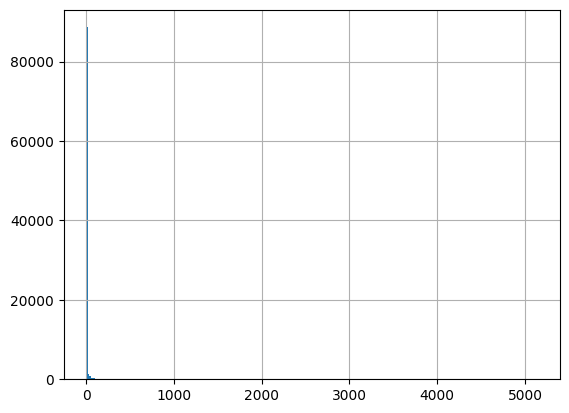
[58]:
# Turbidity (NTU)
df = harmonize.harmonize(df, 'Turbidity', report=True, errors='ignore')
-Usable results-
count     96756.000000
mean         15.624784
std         851.847429
min          -0.047700
25%           1.500000
50%           2.500000
75%           4.100000
max      200000.000000
dtype: float64
Unusable results: 1149
Usable results with inferred units: 0
Results outside threshold (0.0 to 5126.709355): 157
[59]:
cols = ['ResultMeasureValue', 'ResultMeasure/MeasureUnitCode', 'QA_flag', 'Turbidity']
df.loc[df['CharacteristicName']=='Turbidity', cols]
[59]:
| ResultMeasureValue | ResultMeasure/MeasureUnitCode | QA_flag | Turbidity | |
|---|---|---|---|---|
| 79 | 1.0 | mg/l SiO2 | <NA> | 7.5701 Nephelometric_Turbidity_Units |
| 83 | 9.4 | mg/l SiO2 | <NA> | 71.43362 Nephelometric_Turbidity_Units |
| 86 | 25 | mg/l SiO2 | <NA> | 190.0373 Nephelometric_Turbidity_Units |
| 90 | 5.6 | mg/l SiO2 | <NA> | 42.54298 Nephelometric_Turbidity_Units |
| 93 | 20 | mg/l SiO2 | <NA> | 152.0233 Nephelometric_Turbidity_Units |
| ... | ... | ... | ... | ... |
| 1353655 | 1.9 | NTU | <NA> | 1.9 Nephelometric_Turbidity_Units |
| 1354588 | 1 | JTU | <NA> | 18.9773 Nephelometric_Turbidity_Units |
| 1355017 | 2 | JTU | <NA> | 38.0023 Nephelometric_Turbidity_Units |
| 1357119 | 5 | JTU | <NA> | 95.0773 Nephelometric_Turbidity_Units |
| 1357125 | 5 | JTU | <NA> | 95.0773 Nephelometric_Turbidity_Units |
97905 rows × 4 columns
Sediment
[60]:
# Sediment
df = harmonize.harmonize(df, 'Sediment', report=False)
[61]:
cols = ['ResultMeasureValue', 'ResultMeasure/MeasureUnitCode', 'QA_flag', 'Sediment']
df.loc[df['CharacteristicName']=='Sediment', cols]
[61]:
| ResultMeasureValue | ResultMeasure/MeasureUnitCode | QA_flag | Sediment |
|---|
Phosphorus
Note: must be merged w/ activities (package runs query by site if not already merged)
[62]:
# Phosphorus
df = harmonize.harmonize(df, 'Phosphorus')
2 Phosphorus sample fractions not in frac_dict
2 Phosphorus sample fractions not in frac_dict found in expected domains, mapped to "Other_Phosphorus"
Note: warnings for unexpected characteristic fractions. Fractions are each seperated out into their own result column.
[63]:
# All Phosphorus
cols = ['ResultMeasureValue', 'ResultMeasure/MeasureUnitCode', 'QA_flag', 'TDP_Phosphorus']
df.loc[df['Phosphorus'].notna(), cols]
[63]:
| ResultMeasureValue | ResultMeasure/MeasureUnitCode | QA_flag | TDP_Phosphorus | |
|---|---|---|---|---|
| 300 | 0.20 | mg/l PO4 | <NA> | 0.2 milligram / liter |
| 306 | 0.03 | mg/l PO4 | <NA> | NaN |
| 308 | 0.30 | mg/l PO4 | <NA> | 0.3 milligram / liter |
| 417 | 0.45 | mg/l PO4 | <NA> | 0.45 milligram / liter |
| 420 | 0.04 | mg/l PO4 | <NA> | 0.04 milligram / liter |
| ... | ... | ... | ... | ... |
| 1357138 | 0.010 | mg/l as P | <NA> | NaN |
| 1357139 | 0.010 | mg/l as P | <NA> | 0.01 milligram / liter |
| 1357146 | 1.20 | mg/l as P | <NA> | NaN |
| 1357147 | 0.730 | mg/l as P | <NA> | NaN |
| 1357150 | 1.40 | mg/l as P | <NA> | NaN |
35664 rows × 4 columns
[64]:
# Total phosphorus
df.loc[df['TP_Phosphorus'].notna(), cols]
[64]:
| ResultMeasureValue | ResultMeasure/MeasureUnitCode | QA_flag | TDP_Phosphorus | |
|---|---|---|---|---|
| 306 | 0.03 | mg/l PO4 | <NA> | NaN |
| 495 | 1.4 | mg/l PO4 | <NA> | NaN |
| 502 | 1.3 | mg/l PO4 | <NA> | NaN |
| 511 | 1.1 | mg/l PO4 | <NA> | NaN |
| 516 | 0.41 | mg/l PO4 | <NA> | NaN |
| ... | ... | ... | ... | ... |
| 1357134 | 0.070 | mg/l as P | <NA> | NaN |
| 1357138 | 0.010 | mg/l as P | <NA> | NaN |
| 1357146 | 1.20 | mg/l as P | <NA> | NaN |
| 1357147 | 0.730 | mg/l as P | <NA> | NaN |
| 1357150 | 1.40 | mg/l as P | <NA> | NaN |
33701 rows × 4 columns
[65]:
# Total dissolved phosphorus
df.loc[df['TDP_Phosphorus'].notna(), cols]
[65]:
| ResultMeasureValue | ResultMeasure/MeasureUnitCode | QA_flag | TDP_Phosphorus | |
|---|---|---|---|---|
| 300 | 0.20 | mg/l PO4 | <NA> | 0.2 milligram / liter |
| 308 | 0.30 | mg/l PO4 | <NA> | 0.3 milligram / liter |
| 417 | 0.45 | mg/l PO4 | <NA> | 0.45 milligram / liter |
| 420 | 0.04 | mg/l PO4 | <NA> | 0.04 milligram / liter |
| 593 | 2.0 | mg/l PO4 | <NA> | 2.0 milligram / liter |
| ... | ... | ... | ... | ... |
| 1307585 | 0.029 | mg/L | <NA> | 0.029 milligram / liter |
| 1357131 | 0.040 | mg/l as P | <NA> | 0.04 milligram / liter |
| 1357133 | 0.040 | mg/l as P | <NA> | 0.04 milligram / liter |
| 1357135 | 0.060 | mg/l as P | <NA> | 0.06 milligram / liter |
| 1357139 | 0.010 | mg/l as P | <NA> | 0.01 milligram / liter |
1099 rows × 4 columns
[66]:
# All other phosphorus sample fractions
df.loc[df['Other_Phosphorus'].notna(), cols]
[66]:
| ResultMeasureValue | ResultMeasure/MeasureUnitCode | QA_flag | TDP_Phosphorus | |
|---|---|---|---|---|
| 3675 | 420 | mg/kg as P | <NA> | NaN |
| 3682 | 170 | mg/kg as P | <NA> | NaN |
| 3688 | 340 | mg/kg as P | <NA> | NaN |
| 3697 | 160 | mg/kg as P | <NA> | NaN |
| 3699 | 1400 | mg/kg as P | <NA> | NaN |
| ... | ... | ... | ... | ... |
| 1262860 | 0.16950375 | mg/L | <NA> | NaN |
| 1262894 | 0.03524375 | mg/L | <NA> | NaN |
| 1262897 | 0.09624125 | mg/L | <NA> | NaN |
| 1262922 | 0.051395 | mg/L | <NA> | NaN |
| 1262934 | 0.0295125 | mg/L | <NA> | NaN |
864 rows × 4 columns
Bacteria
Some equivalence assumptions are built-in where bacteria counts that are not equivalent are treated as such because there is no standard way to convert from one to another.
Fecal Coliform
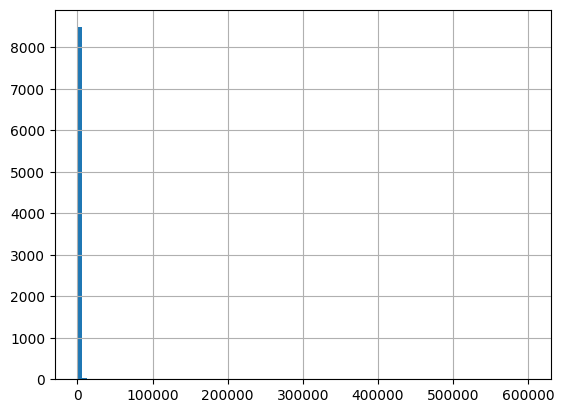
[67]:
# Known unit with bad dimensionality ('Colony_Forming_Units * milliliter')
df = harmonize.harmonize(df, 'Fecal Coliform', report=True, errors='ignore')
/opt/hostedtoolcache/Python/3.11.15/x64/lib/python3.11/site-packages/harmonize_wq/convert.py:131: UserWarning: WARNING: 'cfu/100mL' converted to NaN
  warn(f"WARNING: '{unit}' converted to NaN")
/opt/hostedtoolcache/Python/3.11.15/x64/lib/python3.11/site-packages/harmonize_wq/convert.py:131: UserWarning: WARNING: 'MPN/100mL' converted to NaN
  warn(f"WARNING: '{unit}' converted to NaN")
/opt/hostedtoolcache/Python/3.11.15/x64/lib/python3.11/site-packages/harmonize_wq/convert.py:131: UserWarning: WARNING: 'CFU/100mL' converted to NaN
  warn(f"WARNING: '{unit}' converted to NaN")
-Usable results-
count    8.647000e+03
mean     4.903257e+03
std      1.318438e+05
min      0.000000e+00
25%      3.000000e+00
50%      1.100000e+01
75%      6.000000e+01
max      1.000000e+07
dtype: float64
Unusable results: 57146
Usable results with inferred units: 5
Results outside threshold (0.0 to 795966.124299): 8
[68]:
cols = ['ResultMeasureValue', 'ResultMeasure/MeasureUnitCode', 'QA_flag', 'Fecal_Coliform']
df.loc[df['CharacteristicName']=='Fecal Coliform', cols]
[68]:
| ResultMeasureValue | ResultMeasure/MeasureUnitCode | QA_flag | Fecal_Coliform | |
|---|---|---|---|---|
| 1691 | 0.0 | cfu/100ml | <NA> | 0.0 Colony_Forming_Units / milliliter |
| 1707 | 0.0 | cfu/100ml | <NA> | 0.0 Colony_Forming_Units / milliliter |
| 1732 | 0.0 | cfu/100ml | <NA> | 0.0 Colony_Forming_Units / milliliter |
| 1755 | 0.0 | cfu/100ml | <NA> | 0.0 Colony_Forming_Units / milliliter |
| 1764 | 46 | cfu/100ml | <NA> | 46.0 Colony_Forming_Units / milliliter |
| ... | ... | ... | ... | ... |
| 1355424 | 1700 | cfu/100ml | <NA> | 1700.0 Colony_Forming_Units / milliliter |
| 1355459 | 0.0 | cfu/100ml | <NA> | 0.0 Colony_Forming_Units / milliliter |
| 1355477 | 3500 | cfu/100ml | <NA> | 3500.0 Colony_Forming_Units / milliliter |
| 1355493 | 2 | cfu/100ml | <NA> | 2.0 Colony_Forming_Units / milliliter |
| 1357200 | 2 | cfu/100ml | <NA> | 2.0 Colony_Forming_Units / milliliter |
65793 rows × 4 columns
Excherichia Coli
[69]:
# Known unit with bad dimensionality ('Colony_Forming_Units * milliliter')
df = harmonize.harmonize(df, 'Escherichia coli', report=True, errors='ignore')
/opt/hostedtoolcache/Python/3.11.15/x64/lib/python3.11/site-packages/harmonize_wq/convert.py:131: UserWarning: WARNING: 'cfu/100mL' converted to NaN
  warn(f"WARNING: '{unit}' converted to NaN")
/opt/hostedtoolcache/Python/3.11.15/x64/lib/python3.11/site-packages/harmonize_wq/convert.py:131: UserWarning: WARNING: 'MPN/100mL' converted to NaN
  warn(f"WARNING: '{unit}' converted to NaN")
/opt/hostedtoolcache/Python/3.11.15/x64/lib/python3.11/site-packages/harmonize_wq/convert.py:131: UserWarning: WARNING: 'CFU/100mL' converted to NaN
  warn(f"WARNING: '{unit}' converted to NaN")
-Usable results-
count      142.000000
mean       976.669014
std       4473.446618
min          0.000000
25%         21.000000
50%         46.000000
75%        120.000000
max      41000.000000
dtype: float64
Unusable results: 7603
Usable results with inferred units: 0
Results outside threshold (0.0 to 27817.348725): 1
[70]:
cols = ['ResultMeasureValue', 'ResultMeasure/MeasureUnitCode', 'QA_flag', 'E_coli']
df.loc[df['CharacteristicName']=='Escherichia coli', cols]
[70]:
| ResultMeasureValue | ResultMeasure/MeasureUnitCode | QA_flag | E_coli | |
|---|---|---|---|---|
| 225609 | 14 | #/100mL | <NA> | NaN |
| 226542 | 56 | #/100mL | <NA> | NaN |
| 226552 | 70 | #/100mL | <NA> | NaN |
| 226842 | 400 | #/100mL | <NA> | NaN |
| 226934 | 310 | #/100mL | <NA> | NaN |
| ... | ... | ... | ... | ... |
| 1309884 | *Non-detect | NaN | ResultMeasureValue: "*Non-detect" result canno... | NaN |
| 1309887 | 760 | #/100mL | <NA> | NaN |
| 1309892 | 400 | #/100mL | <NA> | NaN |
| 1309913 | 200 | #/100mL | <NA> | NaN |
| 1309998 | 300 | #/100mL | <NA> | NaN |
7745 rows × 4 columns
Combining Salinity and Conductivity
Convert module has various functions to convert from one unit or characteristic to another. Some of these are used within a single characteristic during harmonization (e.g. DO saturation to concentration) while others are intended to model one characteristic as an indicator of another (e.g. estimate salinity from conductivity).
Note: this should only be done after both characteristic fields have been harmonized. Results before and after should be inspected, thresholds for outliers applied, and consider adding a QA_flag for modeled data.
Explore Salinity results:
[71]:
from harmonize_wq import convert
[72]:
# Salinity summary statistics
lst = [x.magnitude for x in list(df['Salinity'].dropna())]
q_sum = sum(lst)
print('Range: {} to {}'.format(min(lst), max(lst)))
print('Results: {} \nMean: {} PSU'.format(len(lst), q_sum/len(lst)))
Range: -0.02 to 48930.0
Results: 279633
Mean: 21.577040689454932 PSU
[73]:
# Identify extreme outliers
[x for x in lst if x >3200]
[73]:
[48930.0]
Other fields like units and QA_flag may help understand what caused high values and what results might need to be dropped from consideration
[74]:
# Columns to focus on
cols = ['ResultMeasureValue', 'ResultMeasure/MeasureUnitCode', 'QA_flag', 'Salinity']
[75]:
# Look at important fields for max 5 values
salinity_series = df['Salinity'][df['Salinity'].notna()]
salinity_series.sort_values(ascending=False, inplace=True)
df[cols][df['Salinity'].isin(salinity_series[0:5])]
[75]:
| ResultMeasureValue | ResultMeasure/MeasureUnitCode | QA_flag | Salinity | |
|---|---|---|---|---|
| 509576 | 76.57 | ppth | <NA> | 76.57 Practical_Salinity_Units |
| 611948 | 68 | ppth | <NA> | 68.0 Practical_Salinity_Units |
| 630336 | 2976 | ppth | <NA> | 2976.0 Practical_Salinity_Units |
| 950168 | 48930 | ppth | <NA> | 48930.0 Practical_Salinity_Units |
| 996386 | 54.8 | ppth | <NA> | 54.8 Practical_Salinity_Units |
Detection limits may help understand what caused low values and what results might need to be dropped or updated
[76]:
df = wrangle.add_detection(df, 'Salinity')
cols+=['ResultDetectionConditionText',
       'DetectionQuantitationLimitTypeName',
       'DetectionQuantitationLimitMeasure/MeasureValue',
       'DetectionQuantitationLimitMeasure/MeasureUnitCode']
/opt/hostedtoolcache/Python/3.11.15/x64/lib/python3.11/site-packages/harmonize_wq/wrangle.py:501: FutureWarning: The behavior of DataFrame concatenation with empty or all-NA entries is deprecated. In a future version, this will no longer exclude empty or all-NA columns when determining the result dtypes. To retain the old behavior, exclude the relevant entries before the concat operation.
  detection_df = pandas.concat(detection_list).drop_duplicates()
[77]:
# Look at important fields for min 5 values (often multiple 0.0)
df[cols][df['Salinity'].isin(salinity_series[-5:])]
[77]:
| ResultMeasureValue | ResultMeasure/MeasureUnitCode | QA_flag | Salinity | ResultDetectionConditionText | DetectionQuantitationLimitTypeName | DetectionQuantitationLimitMeasure/MeasureValue | DetectionQuantitationLimitMeasure/MeasureUnitCode | |
|---|---|---|---|---|---|---|---|---|
| 199137 | 0 | ppth | <NA> | 0.0 Practical_Salinity_Units | NaN | NaN | NaN | NaN |
| 199141 | 0 | ppth | <NA> | 0.0 Practical_Salinity_Units | NaN | NaN | NaN | NaN |
| 199145 | 0 | ppth | <NA> | 0.0 Practical_Salinity_Units | NaN | NaN | NaN | NaN |
| 199152 | 0 | ppth | <NA> | 0.0 Practical_Salinity_Units | NaN | NaN | NaN | NaN |
| 199155 | 0 | ppth | <NA> | 0.0 Practical_Salinity_Units | NaN | NaN | NaN | NaN |
| 199159 | 0 | ppth | <NA> | 0.0 Practical_Salinity_Units | NaN | NaN | NaN | NaN |
| 199161 | 0 | ppth | <NA> | 0.0 Practical_Salinity_Units | NaN | NaN | NaN | NaN |
| 199167 | 0 | ppth | <NA> | 0.0 Practical_Salinity_Units | NaN | NaN | NaN | NaN |
| 199172 | 0 | ppth | <NA> | 0.0 Practical_Salinity_Units | NaN | NaN | NaN | NaN |
| 199207 | 0 | ppth | <NA> | 0.0 Practical_Salinity_Units | NaN | NaN | NaN | NaN |
| 199221 | 0 | ppth | <NA> | 0.0 Practical_Salinity_Units | NaN | NaN | NaN | NaN |
| 199229 | 0 | ppth | <NA> | 0.0 Practical_Salinity_Units | NaN | NaN | NaN | NaN |
| 199242 | 0 | ppth | <NA> | 0.0 Practical_Salinity_Units | NaN | NaN | NaN | NaN |
| 199259 | 0 | ppth | <NA> | 0.0 Practical_Salinity_Units | NaN | NaN | NaN | NaN |
| 199264 | 0 | ppth | <NA> | 0.0 Practical_Salinity_Units | NaN | NaN | NaN | NaN |
| 199269 | 0 | ppth | <NA> | 0.0 Practical_Salinity_Units | NaN | NaN | NaN | NaN |
| 199271 | 0 | ppth | <NA> | 0.0 Practical_Salinity_Units | NaN | NaN | NaN | NaN |
| 199285 | 0 | ppth | <NA> | 0.0 Practical_Salinity_Units | NaN | NaN | NaN | NaN |
| 199293 | 0 | ppth | <NA> | 0.0 Practical_Salinity_Units | NaN | NaN | NaN | NaN |
| 199297 | 0 | ppth | <NA> | 0.0 Practical_Salinity_Units | NaN | NaN | NaN | NaN |
| 199303 | 0 | ppth | <NA> | 0.0 Practical_Salinity_Units | NaN | NaN | NaN | NaN |
| 199306 | 0 | ppth | <NA> | 0.0 Practical_Salinity_Units | NaN | NaN | NaN | NaN |
| 199313 | 0 | ppth | <NA> | 0.0 Practical_Salinity_Units | NaN | NaN | NaN | NaN |
| 284453 | 0 | ppth | <NA> | 0.0 Practical_Salinity_Units | NaN | NaN | NaN | NaN |
| 287102 | 0 | ppth | <NA> | 0.0 Practical_Salinity_Units | NaN | NaN | NaN | NaN |
| 287105 | 0 | ppth | <NA> | 0.0 Practical_Salinity_Units | NaN | NaN | NaN | NaN |
| 288806 | 0 | ppth | <NA> | 0.0 Practical_Salinity_Units | NaN | NaN | NaN | NaN |
| 288844 | 0 | ppth | <NA> | 0.0 Practical_Salinity_Units | NaN | NaN | NaN | NaN |
| 297138 | 0.00 | ppth | <NA> | 0.0 Practical_Salinity_Units | NaN | NaN | NaN | NaN |
| 297364 | -0.01 | ppth | <NA> | -0.01 Practical_Salinity_Units | NaN | NaN | NaN | NaN |
| 306469 | 0.00 | ppth | <NA> | 0.0 Practical_Salinity_Units | NaN | NaN | NaN | NaN |
| 326433 | 0.00 | ppth | <NA> | 0.0 Practical_Salinity_Units | NaN | NaN | NaN | NaN |
| 326440 | 0.00 | ppth | <NA> | 0.0 Practical_Salinity_Units | NaN | NaN | NaN | NaN |
| 326452 | 0.00 | ppth | <NA> | 0.0 Practical_Salinity_Units | NaN | NaN | NaN | NaN |
| 454221 | -0.02 | ppth | <NA> | -0.02 Practical_Salinity_Units | NaN | NaN | NaN | NaN |
| 495273 | 0 | ppth | <NA> | 0.0 Practical_Salinity_Units | NaN | NaN | NaN | NaN |
| 495284 | 0 | ppth | <NA> | 0.0 Practical_Salinity_Units | NaN | NaN | NaN | NaN |
| 645979 | 0 | ppth | <NA> | 0.0 Practical_Salinity_Units | NaN | NaN | NaN | NaN |
| 857951 | 0.0 | ppth | <NA> | 0.0 Practical_Salinity_Units | NaN | Lower Quantitation Limit | 5.0 | ppth |
| 857952 | 0.0 | ppth | <NA> | 0.0 Practical_Salinity_Units | NaN | Method Detection Level | 1.0 | ppth |
| 870475 | 0.0 | ppth | <NA> | 0.0 Practical_Salinity_Units | NaN | Lower Quantitation Limit | 5.0 | ppth |
| 870476 | 0.0 | ppth | <NA> | 0.0 Practical_Salinity_Units | NaN | Method Detection Level | 1.0 | ppth |
| 1252232 | 0 | PSS | <NA> | 0.0 Practical_Salinity_Units | NaN | NaN | NaN | NaN |
| 1346327 | 0 | ppth | <NA> | 0.0 Practical_Salinity_Units | NaN | NaN | NaN | NaN |
| 1346808 | 0 | ppth | <NA> | 0.0 Practical_Salinity_Units | NaN | NaN | NaN | NaN |
Explore Conductivity results:
[78]:
# Create series and inspect Conductivity values
cond_series = df['Conductivity'].dropna()
cond_series
[78]:
1266375      626.0 microsiemens / centimeter
1266379      688.0 microsiemens / centimeter
1266386      606.0 microsiemens / centimeter
1266387      606.0 microsiemens / centimeter
1266390      633.0 microsiemens / centimeter
1266867      776.0 microsiemens / centimeter
1266870      776.0 microsiemens / centimeter
1266871      775.0 microsiemens / centimeter
1266876      776.0 microsiemens / centimeter
1266880      775.0 microsiemens / centimeter
1270213    20500.0 microsiemens / centimeter
Name: Conductivity, dtype: object
Conductivity thresholds from Freshwater Explorer: 10 > x < 5000 us/cm, use a higher threshold for coastal waters
[79]:
# Sort and check other relevant columns before converting (e.g. Salinity)
cols = ['ResultMeasureValue', 'ResultMeasure/MeasureUnitCode', 'QA_flag', 'Salinity', 'Conductivity']
df.sort_values(by=['Conductivity'], ascending=False, inplace=True)
df.loc[df['Conductivity'].notna(), cols]
[79]:
| ResultMeasureValue | ResultMeasure/MeasureUnitCode | QA_flag | Salinity | Conductivity | |
|---|---|---|---|---|---|
| 1270213 | 20500 | uS/cm | <NA> | NaN | 20500.0 microsiemens / centimeter |
| 1266867 | 776 | uS/cm | <NA> | NaN | 776.0 microsiemens / centimeter |
| 1266870 | 776 | uS/cm | <NA> | NaN | 776.0 microsiemens / centimeter |
| 1266876 | 776 | uS/cm | <NA> | NaN | 776.0 microsiemens / centimeter |
| 1266871 | 775 | uS/cm | <NA> | NaN | 775.0 microsiemens / centimeter |
| 1266880 | 775 | uS/cm | <NA> | NaN | 775.0 microsiemens / centimeter |
| 1266379 | 688 | uS/cm | <NA> | NaN | 688.0 microsiemens / centimeter |
| 1266390 | 633 | uS/cm | <NA> | NaN | 633.0 microsiemens / centimeter |
| 1266375 | 626 | uS/cm | <NA> | NaN | 626.0 microsiemens / centimeter |
| 1266386 | 606 | uS/cm | <NA> | NaN | 606.0 microsiemens / centimeter |
| 1266387 | 606 | uS/cm | <NA> | NaN | 606.0 microsiemens / centimeter |
[80]:
# Convert values to PSU and write to Salinity
cond_series = cond_series.apply(str)  # Convert to string to convert to dimensionless (PSU)
df.loc[df['Conductivity'].notna(), 'Salinity'] = cond_series.apply(convert.conductivity_to_PSU)
df.loc[df['Conductivity'].notna(), 'Salinity']
[80]:
1270213    12.242 dimensionless
1266867     0.379 dimensionless
1266870     0.379 dimensionless
1266876     0.379 dimensionless
1266871     0.379 dimensionless
1266880     0.379 dimensionless
1266379     0.335 dimensionless
1266390     0.308 dimensionless
1266375     0.304 dimensionless
1266386     0.294 dimensionless
1266387     0.294 dimensionless
Name: Salinity, dtype: object
Datetime
datetime() formats time using dataretrieval and ActivityStart
[81]:
# First inspect the existing unformated fields
cols = ['ActivityStartDate', 'ActivityStartTime/Time', 'ActivityStartTime/TimeZoneCode']
df[cols]
[81]:
| ActivityStartDate | ActivityStartTime/Time | ActivityStartTime/TimeZoneCode | |
|---|---|---|---|
| 1270213 | 2021-09-17 | NaN | NaN |
| 1266867 | 2007-08-15 | NaN | NaN |
| 1266870 | 2007-08-15 | NaN | NaN |
| 1266876 | 2007-08-15 | NaN | NaN |
| 1266871 | 2007-08-15 | NaN | NaN |
| ... | ... | ... | ... |
| 1361096 | 1955-03-25 | NaN | NaN |
| 1361097 | 1955-04-08 | NaN | NaN |
| 1361098 | 1955-04-08 | NaN | NaN |
| 1361099 | 1955-04-08 | NaN | NaN |
| 1361100 | 1955-04-08 | NaN | NaN |
1361101 rows × 3 columns
[82]:
# 'ActivityStartDate' presserves date where 'Activity_datetime' is NAT due to no time zone
df = clean.datetime(df)
df[['ActivityStartDate', 'Activity_datetime']]
[82]:
| ActivityStartDate | Activity_datetime | |
|---|---|---|
| 1270213 | 2021-09-17 | NaT |
| 1266867 | 2007-08-15 | NaT |
| 1266870 | 2007-08-15 | NaT |
| 1266876 | 2007-08-15 | NaT |
| 1266871 | 2007-08-15 | NaT |
| ... | ... | ... |
| 1361096 | 1955-03-25 | NaT |
| 1361097 | 1955-04-08 | NaT |
| 1361098 | 1955-04-08 | NaT |
| 1361099 | 1955-04-08 | NaT |
| 1361100 | 1955-04-08 | NaT |
1361101 rows × 2 columns
Activity_datetime combines all three time component columns into UTC. If time is missing this is NaT so a ActivityStartDate column is used to preserve date only.
Depth
Note: Data are often lacking sample depth metadata
[83]:
# Depth of sample (default units='meter')
df = clean.harmonize_depth(df)
#df.loc[df['ResultDepthHeightMeasure/MeasureValue'].dropna(), "Depth"]
df['ResultDepthHeightMeasure/MeasureValue'].dropna()
[83]:
1266379    0.95
1266390    0.50
1266375    0.00
529304     2.00
529307     2.00
           ...
1266376    0.95
1266384    0.50
1266388    0.95
1266391    0.00
1266392    0.50
Name: ResultDepthHeightMeasure/MeasureValue, Length: 314, dtype: float64
Characteristic to Column (long to wide format)
[84]:
# Split single QA column into multiple by characteristic (rename the result to preserve these QA_flags)
df2 = wrangle.split_col(df)
df2
[84]:
| OrganizationIdentifier | OrganizationFormalName | ActivityIdentifier | ActivityStartDate | ActivityStartTime/Time | ActivityStartTime/TimeZoneCode | MonitoringLocationIdentifier | ResultIdentifier | DataLoggerLine | ResultDetectionConditionText | ... | QA_Chlorophyll | QA_pH | QA_E_coli | QA_Nitrogen | QA_TP_Phosphorus | QA_TDP_Phosphorus | QA_Other_Phosphorus | QA_Fecal_Coliform | QA_Conductivity | QA_Carbon | |
|---|---|---|---|---|---|---|---|---|---|---|---|---|---|---|---|---|---|---|---|---|---|
| 1270213 | NARS_WQX | EPA National Aquatic Resources Survey (NARS) | NARS_WQX-192970_2021 | 2021-09-17 | NaN | NaN | NARS_WQX-NWC_FL-10535 | STORET-1040690254 | NaN | NaN | ... | <NA> | <NA> | <NA> | <NA> | <NA> | <NA> | <NA> | <NA> | <NA> | <NA> |
| 1266867 | NARS_WQX | EPA National Aquatic Resources Survey (NARS) | NARS_WQX-PRF:0161:1:070815:3.3 | 2007-08-15 | NaN | NaN | NARS_WQX-NLA_FL-10008 | STORET-1055145219 | NaN | NaN | ... | <NA> | <NA> | <NA> | <NA> | <NA> | <NA> | <NA> | <NA> | <NA> | <NA> |
| 1266870 | NARS_WQX | EPA National Aquatic Resources Survey (NARS) | NARS_WQX-PRF:0161:1:070815:3 | 2007-08-15 | NaN | NaN | NARS_WQX-NLA_FL-10008 | STORET-1055145215 | NaN | NaN | ... | <NA> | <NA> | <NA> | <NA> | <NA> | <NA> | <NA> | <NA> | <NA> | <NA> |
| 1266876 | NARS_WQX | EPA National Aquatic Resources Survey (NARS) | NARS_WQX-PRF:0161:1:070815:2 | 2007-08-15 | NaN | NaN | NARS_WQX-NLA_FL-10008 | STORET-1055145209 | NaN | NaN | ... | <NA> | <NA> | <NA> | <NA> | <NA> | <NA> | <NA> | <NA> | <NA> | <NA> |
| 1266871 | NARS_WQX | EPA National Aquatic Resources Survey (NARS) | NARS_WQX-PRF:0161:1:070815:1 | 2007-08-15 | NaN | NaN | NARS_WQX-NLA_FL-10008 | STORET-1055145207 | NaN | NaN | ... | <NA> | <NA> | <NA> | <NA> | <NA> | <NA> | <NA> | <NA> | <NA> | <NA> |
| ... | ... | ... | ... | ... | ... | ... | ... | ... | ... | ... | ... | ... | ... | ... | ... | ... | ... | ... | ... | ... | ... |
| 1361096 | USGS-FL | USGS Florida Water Science Center | nwisfl.01.95500739 | 1955-03-25 | NaN | NaN | USGS-273236082335801 | NWIS-6842169 | NaN | NaN | ... | <NA> | <NA> | <NA> | <NA> | <NA> | <NA> | <NA> | <NA> | <NA> | <NA> |
| 1361097 | USGS-FL | USGS Florida Water Science Center | nwisfl.01.95500762 | 1955-04-08 | NaN | NaN | USGS-273926082304501 | NWIS-6842541 | NaN | NaN | ... | <NA> | <NA> | <NA> | <NA> | <NA> | <NA> | <NA> | <NA> | <NA> | <NA> |
| 1361098 | USGS-FL | USGS Florida Water Science Center | nwisfl.01.95500762 | 1955-04-08 | NaN | NaN | USGS-273926082304501 | NWIS-6842544 | NaN | NaN | ... | <NA> | <NA> | <NA> | <NA> | <NA> | <NA> | <NA> | <NA> | <NA> | <NA> |
| 1361099 | USGS-FL | USGS Florida Water Science Center | nwisfl.01.95500782 | 1955-04-08 | NaN | NaN | USGS-274455082253601 | NWIS-6842941 | NaN | NaN | ... | <NA> | <NA> | <NA> | <NA> | <NA> | <NA> | <NA> | <NA> | <NA> | <NA> |
| 1361100 | USGS-FL | USGS Florida Water Science Center | nwisfl.01.95500782 | 1955-04-08 | NaN | NaN | USGS-274455082253601 | NWIS-6842944 | NaN | NaN | ... | <NA> | <NA> | <NA> | <NA> | <NA> | <NA> | <NA> | <NA> | <NA> | <NA> |
1289234 rows × 120 columns
[85]:
# This expands the single col (QA_flag) out to a number of new columns based on the unique characteristicNames and speciation
print('{} new columns'.format(len(df2.columns) - len(df.columns)))
14 new columns
[86]:
# Note: there are fewer rows because NAN results are also dropped in this step
print('{} fewer rows'.format(len(df)-len(df2)))
71867 fewer rows
[87]:
#Examine Carbon flags from earlier in notebook (note these are empty now because NAN is dropped)
cols = ['ResultMeasureValue', 'ResultMeasure/MeasureUnitCode', 'Carbon', 'QA_Carbon']
df2.loc[df2['QA_Carbon'].notna(), cols]
[87]:
| ResultMeasureValue | ResultMeasure/MeasureUnitCode | Carbon | QA_Carbon |
|---|
Next the table is divided into the columns of interest (main_df) and characteristic specific metadata (chars_df)
[88]:
# split table into main and characteristics tables
main_df, chars_df = wrangle.split_table(df2)
[89]:
# Columns still in main table
main_df.columns
[89]:
Index(['OrganizationIdentifier', 'OrganizationFormalName',
       'ActivityIdentifier', 'MonitoringLocationIdentifier', 'ProviderName',
       'ActivityStartDateTime', 'AnalysisStartDateTime', 'AnalysisEndDateTime',
       'Secchi', 'Temperature', 'DO', 'pH', 'Salinity', 'Nitrogen',
       'Speciation', 'TOTAL NITROGEN_ MIXED FORMS', 'Conductivity',
       'Chlorophyll', 'Carbon', 'Turbidity', 'Sediment', 'Phosphorus',
       'TP_Phosphorus', 'TDP_Phosphorus', 'Other_Phosphorus', 'Fecal_Coliform',
       'E_coli', 'DetectionQuantitationLimitTypeName',
       'DetectionQuantitationLimitMeasure/MeasureValue',
       'DetectionQuantitationLimitMeasure/MeasureUnitCode',
       'Activity_datetime', 'Depth', 'QA_Secchi', 'QA_Temperature', 'QA_DO',
       'QA_Turbidity', 'QA_Salinity', 'QA_Chlorophyll', 'QA_pH', 'QA_E_coli',
       'QA_Nitrogen', 'QA_TP_Phosphorus', 'QA_TDP_Phosphorus',
       'QA_Other_Phosphorus', 'QA_Fecal_Coliform', 'QA_Conductivity',
       'QA_Carbon'],
      dtype='object')
[90]:
# look at main table results (first 5)
main_df.head()
[90]:
| OrganizationIdentifier | OrganizationFormalName | ActivityIdentifier | MonitoringLocationIdentifier | ProviderName | ActivityStartDateTime | AnalysisStartDateTime | AnalysisEndDateTime | Secchi | Temperature | ... | QA_Chlorophyll | QA_pH | QA_E_coli | QA_Nitrogen | QA_TP_Phosphorus | QA_TDP_Phosphorus | QA_Other_Phosphorus | QA_Fecal_Coliform | QA_Conductivity | QA_Carbon | |
|---|---|---|---|---|---|---|---|---|---|---|---|---|---|---|---|---|---|---|---|---|---|
| 1270213 | NARS_WQX | EPA National Aquatic Resources Survey (NARS) | NARS_WQX-192970_2021 | NARS_WQX-NWC_FL-10535 | STORET | NaT | NaT | NaT | NaN | NaN | ... | <NA> | <NA> | <NA> | <NA> | <NA> | <NA> | <NA> | <NA> | <NA> | <NA> |
| 1266867 | NARS_WQX | EPA National Aquatic Resources Survey (NARS) | NARS_WQX-PRF:0161:1:070815:3.3 | NARS_WQX-NLA_FL-10008 | STORET | NaT | NaT | NaT | NaN | NaN | ... | <NA> | <NA> | <NA> | <NA> | <NA> | <NA> | <NA> | <NA> | <NA> | <NA> |
| 1266870 | NARS_WQX | EPA National Aquatic Resources Survey (NARS) | NARS_WQX-PRF:0161:1:070815:3 | NARS_WQX-NLA_FL-10008 | STORET | NaT | NaT | NaT | NaN | NaN | ... | <NA> | <NA> | <NA> | <NA> | <NA> | <NA> | <NA> | <NA> | <NA> | <NA> |
| 1266876 | NARS_WQX | EPA National Aquatic Resources Survey (NARS) | NARS_WQX-PRF:0161:1:070815:2 | NARS_WQX-NLA_FL-10008 | STORET | NaT | NaT | NaT | NaN | NaN | ... | <NA> | <NA> | <NA> | <NA> | <NA> | <NA> | <NA> | <NA> | <NA> | <NA> |
| 1266871 | NARS_WQX | EPA National Aquatic Resources Survey (NARS) | NARS_WQX-PRF:0161:1:070815:1 | NARS_WQX-NLA_FL-10008 | STORET | NaT | NaT | NaT | NaN | NaN | ... | <NA> | <NA> | <NA> | <NA> | <NA> | <NA> | <NA> | <NA> | <NA> | <NA> |
5 rows × 47 columns
[91]:
# Empty columns that could be dropped (Mostly QA columns)
cols = list(main_df.columns)
x = main_df.dropna(axis=1, how='all')
[col for col in cols if col not in x.columns]
[91]:
['AnalysisStartDateTime',
 'AnalysisEndDateTime',
 'Sediment',
 'QA_Temperature',
 'QA_DO',
 'QA_Turbidity',
 'QA_Salinity',
 'QA_E_coli',
 'QA_Nitrogen',
 'QA_TDP_Phosphorus',
 'QA_Other_Phosphorus',
 'QA_Conductivity',
 'QA_Carbon']
[92]:
# Map average temperature at each station
results_gdf = visualize.map_measure(main_df, stations_clipped, 'Temperature')
results_gdf.plot(column='mean', cmap='OrRd', legend=True)
[92]:
<Axes: >
