Gulf of Mexico Estuaries - Try the example workflow in other estuaries
Standardize, clean and wrangle Water Quality Portal data in Gulf of Mexico Estuaries into more analytic-ready formats using the harmonize_wq package.
This demo can be run one estuary at a time, or on all GOM estuaturies (SLOW!), but goes into less detail than the other demo notebooks.
Import the required libraries
[1]:
import sys
#!python -m pip uninstall harmonize-wq --yes
# Use pip to install the package from pypi or the latest from github
#!{sys.executable} -m pip install harmonize-wq
# For latest dev version
#!{sys.executable} -m pip install git+https://github.com/USEPA/harmonize-wq.git
[2]:
import os
import geopandas
import pandas
from harmonize_wq import harmonize
from harmonize_wq import convert
from harmonize_wq import wrangle
from harmonize_wq import clean
from harmonize_wq import location
from harmonize_wq import visualize
import dataretrieval.wqp as wqp
Define Gulf of Mexico Estuaries
[3]:
# Read geometry for Area of Interest from geojson file url
# NOTE: alternatively you can direct it to a local shapefile
aoi_url = r'https://raw.githubusercontent.com/USEPA/harmonize-wq/new_release_0-3-8/harmonize_wq/tests/data/NCCA_dissolved_GOM.geojson'
[4]:
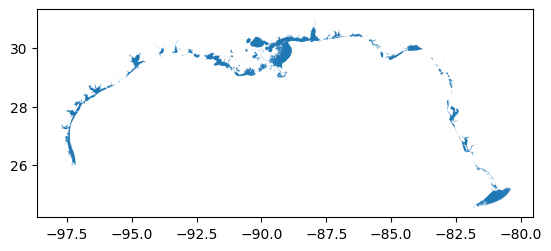
# Plot all the Gulf of Mexico Estuaries (geojson is WGS1984 standard)
wrangle.as_gdf(aoi_url).plot()
[4]:
<Axes: >
Work through select estuary
[5]:
aoi_gdf_all = wrangle.as_gdf(aoi_url)
aoi_gdf_all
[5]:
| FID | EDACDA_NM | Shape_Leng | Shape_Area | geometry | |
|---|---|---|---|---|---|
| 0 | 0 | _CDA_G045 (Big Cypre | 2.459210e+05 | 4.845854e+07 | MULTIPOLYGON (((-81.78476 26.15005, -81.78529 ... |
| 1 | 1 | _CDA_G053 (Charlotte | 3.561144e+05 | 2.114096e+08 | MULTIPOLYGON (((-82.05840 26.46641, -82.05852 ... |
| 2 | 2 | _CDA_G056 (Sarasota | 1.732806e+05 | 2.514034e+07 | MULTIPOLYGON (((-82.25248 26.86147, -82.25213 ... |
| 3 | 3 | _CDA_G074 (Crystal-P | 1.709528e+06 | 3.854249e+08 | MULTIPOLYGON (((-82.73757 28.16579, -82.73827 ... |
| 4 | 4 | _CDA_G078 (Waccasass | 2.614051e+05 | 7.605671e+07 | MULTIPOLYGON (((-82.76983 29.08619, -82.77043 ... |
| 5 | 5 | _CDA_G083 (Waccasass | 2.257102e+05 | 7.069493e+07 | POLYGON ((-83.05707 29.20088, -83.05660 29.201... |
| 6 | 6 | _CDA_G086 (Econfina- | 1.298006e+05 | 2.603907e+07 | MULTIPOLYGON (((-83.31348 29.48099, -83.31419 ... |
| 7 | 7 | _CDA_G095 (New) | 4.171870e+04 | 2.324903e+07 | POLYGON ((-84.44020 29.92805, -84.44102 29.928... |
| 8 | 8 | _CDA_G108 (St. Andre | 1.521129e+05 | 1.893677e+08 | MULTIPOLYGON (((-85.31034 29.83278, -85.30973 ... |
| 9 | 9 | _CDA_G145 (Perdido B | 3.018001e+04 | 1.046314e+07 | POLYGON ((-87.69336 30.25454, -87.69204 30.255... |
| 10 | 10 | _CDA_G268 (Austin-Oy | 4.475770e+04 | 3.038063e+06 | MULTIPOLYGON (((-95.35666 28.95522, -95.35907 ... |
| 11 | 11 | _CDA_S206 (Vero Beac | 6.468599e+05 | 4.109646e+08 | MULTIPOLYGON (((-81.77892 24.57301, -81.77957 ... |
| 12 | 12 | Apalachee Bay | 1.069577e+06 | 9.114576e+08 | MULTIPOLYGON (((-83.50628 29.71970, -83.50541 ... |
| 13 | 13 | Apalachicola Bay | 5.800803e+05 | 6.082343e+08 | POLYGON ((-84.50646 29.91641, -84.50799 29.916... |
| 14 | 14 | Aransas Bay | 5.044692e+05 | 5.960332e+08 | POLYGON ((-96.87502 28.15683, -96.87521 28.157... |
| 15 | 15 | Atchafalaya_Vermilio | 1.691485e+06 | 2.243404e+09 | MULTIPOLYGON (((-91.03496 29.26786, -91.03499 ... |
| 16 | 16 | Barataria Bay | 1.783860e+06 | 8.577051e+08 | MULTIPOLYGON (((-90.14634 29.20032, -90.14680 ... |
| 17 | 17 | Brazos River | 2.456844e+05 | 2.463528e+07 | MULTIPOLYGON (((-95.50778 28.86330, -95.50765 ... |
| 18 | 18 | Breton_Chandeleur So | 2.705574e+06 | 4.387982e+09 | POLYGON ((-88.94898 30.15824, -88.95161 30.162... |
| 19 | 19 | Calcasieu Lake | 5.724963e+05 | 2.800843e+08 | POLYGON ((-93.20251 30.25729, -93.20253 30.257... |
| 20 | 20 | Charlotte Harbor | 1.571643e+06 | 6.379013e+08 | POLYGON ((-81.98701 27.09108, -81.98808 27.091... |
| 21 | 21 | Choctawhatchee Bay | 5.046125e+05 | 3.503682e+08 | POLYGON ((-85.86561 30.49899, -85.86584 30.499... |
| 22 | 22 | Corpus Christi Bay | 4.005122e+05 | 5.026931e+08 | POLYGON ((-97.11660 27.89432, -97.11650 27.894... |
| 23 | 23 | East Mississippi Sou | 5.934189e+05 | 4.126285e+08 | MULTIPOLYGON (((-88.50717 30.35364, -88.50677 ... |
| 24 | 24 | Florida Bay | 1.000807e+06 | 3.245987e+09 | POLYGON ((-80.43996 25.23948, -80.43989 25.239... |
| 25 | 25 | Galveston Bay | 1.254531e+06 | 1.482723e+09 | MULTIPOLYGON (((-94.65310 29.83876, -94.65318 ... |
| 26 | 26 | Lower Laguna Madre | 2.490226e+06 | 1.928478e+09 | MULTIPOLYGON (((-97.31661 26.01005, -97.31729 ... |
| 27 | 27 | Matagorda Bay | 1.055632e+06 | 1.142351e+09 | MULTIPOLYGON (((-95.79432 28.82234, -95.79507 ... |
| 28 | 28 | Mermentau River | 7.028012e+05 | 4.419931e+08 | MULTIPOLYGON (((-92.64804 29.85044, -92.64912 ... |
| 29 | 29 | Mississippi River | 1.485238e+06 | 5.321446e+08 | MULTIPOLYGON (((-89.49636 29.25441, -89.49626 ... |
| 30 | 30 | Mobile Bay | 6.687480e+05 | 1.120881e+09 | POLYGON ((-88.12489 30.28214, -88.13061 30.262... |
| 31 | 31 | North Ten Thousand I | 9.668944e+05 | 2.483397e+08 | MULTIPOLYGON (((-81.22834 25.58434, -81.22854 ... |
| 32 | 32 | Pensacola Bay | 7.071830e+05 | 4.944393e+08 | MULTIPOLYGON (((-87.25782 30.40920, -87.25737 ... |
| 33 | 33 | Perdido Bay | 3.080964e+05 | 1.352332e+08 | POLYGON ((-87.44271 30.51168, -87.44279 30.512... |
| 34 | 34 | Rio Grande | 9.451517e+04 | 5.050264e+06 | POLYGON ((-97.17422 25.96538, -97.17501 25.965... |
| 35 | 35 | Rookery Bay | 2.125044e+05 | 3.169879e+07 | MULTIPOLYGON (((-81.66457 25.98335, -81.66462 ... |
| 36 | 36 | Sabine Lake | 4.711833e+05 | 2.676789e+08 | MULTIPOLYGON (((-94.15691 29.68110, -94.15644 ... |
| 37 | 37 | San Antonio Bay | 5.030440e+05 | 5.627720e+08 | POLYGON ((-96.79074 28.46439, -96.79102 28.464... |
| 38 | 38 | Sarasota Bay | 3.241149e+05 | 1.308481e+08 | POLYGON ((-82.73052 27.53005, -82.72972 27.531... |
| 39 | 39 | South Ten Thousand I | 1.022209e+06 | 2.197916e+08 | MULTIPOLYGON (((-81.12956 25.17610, -81.13017 ... |
| 40 | 40 | St. Andrew Bay | 8.403541e+05 | 2.777813e+08 | POLYGON ((-85.58253 30.32921, -85.58266 30.329... |
| 41 | 41 | Suwannee River | 4.765552e+05 | 1.167668e+08 | MULTIPOLYGON (((-83.16708 29.37686, -83.16719 ... |
| 42 | 42 | Tampa Bay | 1.354578e+06 | 9.527476e+08 | POLYGON ((-82.73872 27.66483, -82.73882 27.664... |
| 43 | 43 | Terrebonne_Timbalier | 2.084834e+06 | 1.240769e+09 | MULTIPOLYGON (((-90.21292 29.23003, -90.21310 ... |
| 44 | 44 | Upper Laguna Madre | 2.890454e+05 | 2.320851e+08 | MULTIPOLYGON (((-97.43237 27.17550, -97.42648 ... |
| 45 | 45 | West Mississippi Sou | 2.115368e+06 | 4.530289e+09 | POLYGON ((-89.09146 30.20230, -89.07073 30.203... |
Choose an index for the estuary to retrieve
[6]:
i = 25
[7]:
# Print reformated estuary name
estuary_name = aoi_gdf_all.iloc[i]['EDACDA_NM']
out_est_name = str(estuary_name).replace(" ", "_")
out_est_name = out_est_name.replace(".", "")
out_est_name = out_est_name.replace("(", "")
out_est_name = out_est_name.replace(")", "")
print('Estuary Name: "{}" -> "{}"'.format(estuary_name, out_est_name))
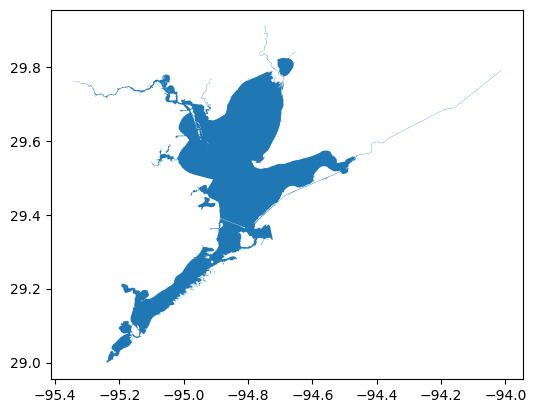
Estuary Name: "Galveston Bay" -> "Galveston_Bay"
[8]:
# Get polygon from polygons
aoi_gdf = aoi_gdf_all.iloc[i:i+1]
[9]:
# Map selection
aoi_gdf.plot()
[9]:
<Axes: >
Build Query
[10]:
# Each estuary may be multi-polygon, so the query will be built around the full extent instead of one row
bBox = wrangle.get_bounding_box(aoi_gdf)
[11]:
# Build query
query = {'characteristicName': ['Phosphorus',
                                'Temperature, water',
                                'Depth, Secchi disk depth',
                                'Dissolved oxygen (DO)',
                                'Salinity',
                                'pH',
                                'Nitrogen',
                                'Conductivity',
                                'Organic carbon',
                                'Chlorophyll a',
                                'Turbidity',
                                'Sediment',
                                'Fecal Coliform',
                                'Escherichia coli']}
query['bBox'] = bBox
Retrieve Data
[12]:
query['dataProfile'] = 'narrowResult'
res_narrow, md_narrow = wqp.get_results(**query)

# dataframe of downloaded results
res_narrow
C:\Users\jbousqui\Local_GIS\Python\v_envs\jupyter-harmonize-39\lib\site-packages\dataretrieval\wqp.py:83: DtypeWarning: Columns (4,5,9,10,15,17,19,22,31,33,34,36,38,61,62,63,70,71) have mixed types. Specify dtype option on import or set low_memory=False.
  df = pd.read_csv(StringIO(response.text), delimiter=',')
[12]:
| OrganizationIdentifier | OrganizationFormalName | ActivityIdentifier | ActivityStartDate | ActivityStartTime/Time | ActivityStartTime/TimeZoneCode | MonitoringLocationIdentifier | ResultIdentifier | DataLoggerLine | ResultDetectionConditionText | ... | AnalysisEndTime/TimeZoneCode | ResultLaboratoryCommentCode | ResultLaboratoryCommentText | ResultDetectionQuantitationLimitUrl | LaboratoryAccreditationIndicator | LaboratoryAccreditationAuthorityName | TaxonomistAccreditationIndicator | TaxonomistAccreditationAuthorityName | LabSamplePreparationUrl | ProviderName | |
|---|---|---|---|---|---|---|---|---|---|---|---|---|---|---|---|---|---|---|---|---|---|
| 0 | TCEQMAIN | Texas Commission on Environmental Quality | TCEQMAIN-13702013 | 2013-04-29 | NaN | NaN | TCEQMAIN-15224 | STORET-422578803 | NaN | NaN | ... | NaN | NaN | NaN | NaN | NaN | NaN | NaN | NaN | NaN | STORET |
| 1 | TCEQMAIN | Texas Commission on Environmental Quality | TCEQMAIN-13947279 | 2013-07-11 | NaN | NaN | TCEQMAIN-11446 | STORET-422881708 | NaN | NaN | ... | NaN | NaN | NaN | NaN | NaN | NaN | NaN | NaN | NaN | STORET |
| 2 | TCEQMAIN | Texas Commission on Environmental Quality | TCEQMAIN-14329114 | 2013-10-08 | NaN | NaN | TCEQMAIN-15906 | STORET-422797456 | NaN | NaN | ... | NaN | NaN | NaN | NaN | NaN | NaN | NaN | NaN | NaN | STORET |
| 3 | TCEQMAIN | Texas Commission on Environmental Quality | TCEQMAIN-13899297 | 2013-08-01 | NaN | NaN | TCEQMAIN-11287 | STORET-422829817 | NaN | NaN | ... | NaN | NaN | NaN | NaN | NaN | NaN | NaN | NaN | NaN | STORET |
| 4 | TCEQMAIN | Texas Commission on Environmental Quality | TCEQMAIN-13702703 | 2013-05-14 | NaN | NaN | TCEQMAIN-15216 | STORET-422577293 | NaN | NaN | ... | NaN | NaN | NaN | NaN | NaN | NaN | NaN | NaN | NaN | STORET |
| ... | ... | ... | ... | ... | ... | ... | ... | ... | ... | ... | ... | ... | ... | ... | ... | ... | ... | ... | ... | ... | ... |
| 249329 | USGS-TX | USGS Texas Water Science Center | nwistx.01.02400657 | 2024-01-25 | 08:35:00 | CST | USGS-08042546 | NWIS-126809215 | NaN | NaN | ... | NaN | NaN | NaN | NaN | NaN | NaN | NaN | NaN | NaN | NWIS |
| 249330 | USGS-TX | USGS Texas Water Science Center | nwistx.01.02400657 | 2024-01-25 | 08:35:00 | CST | USGS-08042546 | NWIS-126809227 | NaN | NaN | ... | NaN | NaN | NaN | NaN | NaN | NaN | NaN | NaN | NaN | NWIS |
| 249331 | USGS-TX | USGS Texas Water Science Center | nwistx.01.02400659 | 2024-01-25 | 12:35:00 | CST | USGS-08042554 | NWIS-126809095 | NaN | NaN | ... | NaN | NaN | NaN | NaN | NaN | NaN | NaN | NaN | NaN | NWIS |
| 249332 | USGS-TX | USGS Texas Water Science Center | nwistx.01.02400659 | 2024-01-25 | 12:35:00 | CST | USGS-08042554 | NWIS-126809105 | NaN | NaN | ... | NaN | NaN | NaN | NaN | NaN | NaN | NaN | NaN | NaN | NWIS |
| 249333 | USGS-TX | USGS Texas Water Science Center | nwistx.01.02400659 | 2024-01-25 | 12:35:00 | CST | USGS-08042554 | NWIS-126809117 | NaN | NaN | ... | NaN | NaN | NaN | NaN | NaN | NaN | NaN | NaN | NaN | NWIS |
249334 rows × 78 columns
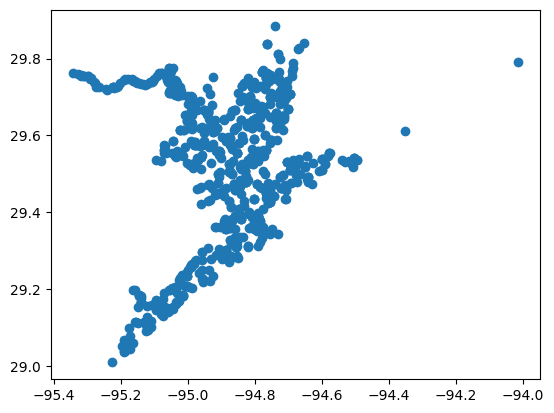
[13]:
# Get harmonized stations clipped to the Area of Interest
stations_gdf, stations, site_md = location.get_harmonized_stations(query, aoi=aoi_gdf)
stations_gdf.plot()
[13]:
<Axes: >
Harmonize characteristic data (all at once)
The harmonize_all() function identifies the characteristics present and uses preset defaults to harmonize each. This function does not has as much flexibility e.g., to keep intermediate columns, produce reports, or convert to non-default units.
[14]:
# Harmonize all results
df_harmonized = harmonize.harmonize_all(res_narrow, errors='ignore')
df_harmonized
C:\Users\jbousqui\Local_GIS\Python\v_envs\jupyter-harmonize-39\lib\site-packages\harmonize_wq\wq_data.py:329: UserWarning: WARNING: 'ug/cm2' UNDEFINED UNIT for Chlorophyll
  warn("WARNING: " + problem)
C:\Users\jbousqui\Local_GIS\Python\v_envs\jupyter-harmonize-39\lib\site-packages\pandas\core\dtypes\cast.py:1784: UnitStrippedWarning: The unit of the quantity is stripped when downcasting to ndarray.
  result[:] = values
C:\Users\jbousqui\Local_GIS\Python\v_envs\jupyter-harmonize-39\lib\site-packages\pandas\core\dtypes\cast.py:1784: UnitStrippedWarning: The unit of the quantity is stripped when downcasting to ndarray.
  result[:] = values
C:\Users\jbousqui\Local_GIS\Python\v_envs\jupyter-harmonize-39\lib\site-packages\pandas\core\dtypes\cast.py:1784: UnitStrippedWarning: The unit of the quantity is stripped when downcasting to ndarray.
  result[:] = values
C:\Users\jbousqui\Local_GIS\Python\v_envs\jupyter-harmonize-39\lib\site-packages\pandas\core\dtypes\cast.py:1784: UnitStrippedWarning: The unit of the quantity is stripped when downcasting to ndarray.
  result[:] = values
C:\Users\jbousqui\Local_GIS\Python\v_envs\jupyter-harmonize-39\lib\site-packages\harmonize_wq\wq_data.py:329: UserWarning: WARNING: 'None' UNDEFINED UNIT for E_coli
  warn("WARNING: " + problem)
C:\Users\jbousqui\Local_GIS\Python\v_envs\jupyter-harmonize-39\lib\site-packages\harmonize_wq\harmonize.py:142: UserWarning: WARNING: 'MPN/100mL' converted to NaN
  warn(f"WARNING: '{unit}' converted to NaN")
C:\Users\jbousqui\Local_GIS\Python\v_envs\jupyter-harmonize-39\lib\site-packages\harmonize_wq\harmonize.py:142: UserWarning: WARNING: 'CFU/100mL' converted to NaN
  warn(f"WARNING: '{unit}' converted to NaN")
C:\Users\jbousqui\Local_GIS\Python\v_envs\jupyter-harmonize-39\lib\site-packages\pandas\core\dtypes\cast.py:1784: UnitStrippedWarning: The unit of the quantity is stripped when downcasting to ndarray.
  result[:] = values
C:\Users\jbousqui\Local_GIS\Python\v_envs\jupyter-harmonize-39\lib\site-packages\harmonize_wq\harmonize.py:142: UserWarning: WARNING: 'hours' converted to NaN
  warn(f"WARNING: '{unit}' converted to NaN")
C:\Users\jbousqui\Local_GIS\Python\v_envs\jupyter-harmonize-39\lib\site-packages\harmonize_wq\wq_data.py:329: UserWarning: WARNING: 'None' UNDEFINED UNIT for Fecal_Coliform
  warn("WARNING: " + problem)
C:\Users\jbousqui\Local_GIS\Python\v_envs\jupyter-harmonize-39\lib\site-packages\pandas\core\dtypes\cast.py:1784: UnitStrippedWarning: The unit of the quantity is stripped when downcasting to ndarray.
  result[:] = values
C:\Users\jbousqui\Local_GIS\Python\v_envs\jupyter-harmonize-39\lib\site-packages\harmonize_wq\harmonize.py:142: UserWarning: WARNING: 'CFU/100mL' converted to NaN
  warn(f"WARNING: '{unit}' converted to NaN")
C:\Users\jbousqui\Local_GIS\Python\v_envs\jupyter-harmonize-39\lib\site-packages\pandas\core\dtypes\cast.py:1784: UnitStrippedWarning: The unit of the quantity is stripped when downcasting to ndarray.
  result[:] = values
C:\Users\jbousqui\Local_GIS\Python\v_envs\jupyter-harmonize-39\lib\site-packages\pandas\core\dtypes\cast.py:1784: UnitStrippedWarning: The unit of the quantity is stripped when downcasting to ndarray.
  result[:] = values
C:\Users\jbousqui\Local_GIS\Python\v_envs\jupyter-harmonize-39\lib\site-packages\pandas\core\dtypes\cast.py:1784: UnitStrippedWarning: The unit of the quantity is stripped when downcasting to ndarray.
  result[:] = values
2 Phosphorus sample fractions not in frac_dict
2 Phosphorus sample fractions not in frac_dict found in expected domains, mapped to "Other_Phosphorus"
C:\Users\jbousqui\Local_GIS\Python\v_envs\jupyter-harmonize-39\lib\site-packages\pandas\core\dtypes\cast.py:1784: UnitStrippedWarning: The unit of the quantity is stripped when downcasting to ndarray.
  result[:] = values
C:\Users\jbousqui\Local_GIS\Python\v_envs\jupyter-harmonize-39\lib\site-packages\harmonize_wq\harmonize.py:142: UserWarning: WARNING: 'nu' converted to NaN
  warn(f"WARNING: '{unit}' converted to NaN")
C:\Users\jbousqui\Local_GIS\Python\v_envs\jupyter-harmonize-39\lib\site-packages\harmonize_wq\harmonize.py:142: UserWarning: WARNING: 'g / H2O' converted to NaN
  warn(f"WARNING: '{unit}' converted to NaN")
C:\Users\jbousqui\Local_GIS\Python\v_envs\jupyter-harmonize-39\lib\site-packages\pandas\core\dtypes\cast.py:1784: UnitStrippedWarning: The unit of the quantity is stripped when downcasting to ndarray.
  result[:] = values
C:\Users\jbousqui\Local_GIS\Python\v_envs\jupyter-harmonize-39\lib\site-packages\harmonize_wq\wq_data.py:329: UserWarning: WARNING: 'None' UNDEFINED UNIT for Turbidity
  warn("WARNING: " + problem)
C:\Users\jbousqui\Local_GIS\Python\v_envs\jupyter-harmonize-39\lib\site-packages\pandas\core\dtypes\cast.py:1784: UnitStrippedWarning: The unit of the quantity is stripped when downcasting to ndarray.
  result[:] = values
C:\Users\jbousqui\Local_GIS\Python\v_envs\jupyter-harmonize-39\lib\site-packages\pandas\core\dtypes\cast.py:1784: UnitStrippedWarning: The unit of the quantity is stripped when downcasting to ndarray.
  result[:] = values
C:\Users\jbousqui\Local_GIS\Python\v_envs\jupyter-harmonize-39\lib\site-packages\harmonize_wq\harmonize.py:142: UserWarning: WARNING: 'nu' converted to NaN
  warn(f"WARNING: '{unit}' converted to NaN")
[14]:
| OrganizationIdentifier | OrganizationFormalName | ActivityIdentifier | ActivityStartDate | ActivityStartTime/Time | ActivityStartTime/TimeZoneCode | MonitoringLocationIdentifier | ResultIdentifier | DataLoggerLine | ResultDetectionConditionText | ... | Carbon | Phosphorus | TP_Phosphorus | TDP_Phosphorus | Other_Phosphorus | Salinity | Sediment | Temperature | Turbidity | pH | |
|---|---|---|---|---|---|---|---|---|---|---|---|---|---|---|---|---|---|---|---|---|---|
| 0 | TCEQMAIN | Texas Commission on Environmental Quality | TCEQMAIN-13702013 | 2013-04-29 | NaN | NaN | TCEQMAIN-15224 | STORET-422578803 | NaN | NaN | ... | NaN | 0.09 milligram / liter | NaN | NaN | 0.09 milligram / liter | NaN | NaN | NaN | NaN | NaN |
| 1 | TCEQMAIN | Texas Commission on Environmental Quality | TCEQMAIN-13947279 | 2013-07-11 | NaN | NaN | TCEQMAIN-11446 | STORET-422881708 | NaN | NaN | ... | NaN | NaN | NaN | NaN | NaN | NaN | NaN | NaN | NaN | 7.9 dimensionless |
| 2 | TCEQMAIN | Texas Commission on Environmental Quality | TCEQMAIN-14329114 | 2013-10-08 | NaN | NaN | TCEQMAIN-15906 | STORET-422797456 | NaN | NaN | ... | NaN | 0.24 milligram / liter | NaN | NaN | 0.24 milligram / liter | NaN | NaN | NaN | NaN | NaN |
| 3 | TCEQMAIN | Texas Commission on Environmental Quality | TCEQMAIN-13899297 | 2013-08-01 | NaN | NaN | TCEQMAIN-11287 | STORET-422829817 | NaN | NaN | ... | NaN | NaN | NaN | NaN | NaN | NaN | NaN | NaN | NaN | NaN |
| 4 | TCEQMAIN | Texas Commission on Environmental Quality | TCEQMAIN-13702703 | 2013-05-14 | NaN | NaN | TCEQMAIN-15216 | STORET-422577293 | NaN | NaN | ... | NaN | NaN | NaN | NaN | NaN | 28.2 Practical_Salinity_Units | NaN | NaN | NaN | NaN |
| ... | ... | ... | ... | ... | ... | ... | ... | ... | ... | ... | ... | ... | ... | ... | ... | ... | ... | ... | ... | ... | ... |
| 249329 | USGS-TX | USGS Texas Water Science Center | nwistx.01.02400657 | 2024-01-25 | 08:35:00 | CST | USGS-08042546 | NWIS-126809215 | NaN | NaN | ... | NaN | NaN | NaN | NaN | NaN | NaN | NaN | NaN | NaN | 6.6 dimensionless |
| 249330 | USGS-TX | USGS Texas Water Science Center | nwistx.01.02400657 | 2024-01-25 | 08:35:00 | CST | USGS-08042546 | NWIS-126809227 | NaN | NaN | ... | NaN | NaN | NaN | NaN | NaN | NaN | NaN | NaN | 57.0 Nephelometric_Turbidity_Units | NaN |
| 249331 | USGS-TX | USGS Texas Water Science Center | nwistx.01.02400659 | 2024-01-25 | 12:35:00 | CST | USGS-08042554 | NWIS-126809095 | NaN | NaN | ... | NaN | NaN | NaN | NaN | NaN | NaN | NaN | 16.0 degree_Celsius | NaN | NaN |
| 249332 | USGS-TX | USGS Texas Water Science Center | nwistx.01.02400659 | 2024-01-25 | 12:35:00 | CST | USGS-08042554 | NWIS-126809105 | NaN | NaN | ... | NaN | NaN | NaN | NaN | NaN | NaN | NaN | NaN | NaN | 6.5 dimensionless |
| 249333 | USGS-TX | USGS Texas Water Science Center | nwistx.01.02400659 | 2024-01-25 | 12:35:00 | CST | USGS-08042554 | NWIS-126809117 | NaN | NaN | ... | NaN | NaN | NaN | NaN | NaN | NaN | NaN | NaN | 49.0 Nephelometric_Turbidity_Units | NaN |
249334 rows × 98 columns
[15]:
# Clean up other columns of data
df_cleaned = clean.datetime(df_harmonized)  # datetime
df_cleaned = clean.harmonize_depth(df_cleaned)  # Sample depth
df_cleaned
C:\Users\jbousqui\Local_GIS\Python\v_envs\jupyter-harmonize-39\lib\site-packages\dataretrieval\utils.py:87: UserWarning: Warning: 217379 incomplete dates found, consider setting datetime_index to False.
  warnings.warn(
C:\Users\jbousqui\Local_GIS\Python\v_envs\jupyter-harmonize-39\lib\site-packages\pandas\core\dtypes\cast.py:1784: UnitStrippedWarning: The unit of the quantity is stripped when downcasting to ndarray.
  result[:] = values
[15]:
| OrganizationIdentifier | OrganizationFormalName | ActivityIdentifier | ActivityStartDate | ActivityStartTime/Time | ActivityStartTime/TimeZoneCode | MonitoringLocationIdentifier | ResultIdentifier | DataLoggerLine | ResultDetectionConditionText | ... | TP_Phosphorus | TDP_Phosphorus | Other_Phosphorus | Salinity | Sediment | Temperature | Turbidity | pH | Activity_datetime | Depth | |
|---|---|---|---|---|---|---|---|---|---|---|---|---|---|---|---|---|---|---|---|---|---|
| 0 | TCEQMAIN | Texas Commission on Environmental Quality | TCEQMAIN-13702013 | 2013-04-29 | NaN | NaN | TCEQMAIN-15224 | STORET-422578803 | NaN | NaN | ... | NaN | NaN | 0.09 milligram / liter | NaN | NaN | NaN | NaN | NaN | NaT | NaN |
| 1 | TCEQMAIN | Texas Commission on Environmental Quality | TCEQMAIN-13947279 | 2013-07-11 | NaN | NaN | TCEQMAIN-11446 | STORET-422881708 | NaN | NaN | ... | NaN | NaN | NaN | NaN | NaN | NaN | NaN | 7.9 dimensionless | NaT | NaN |
| 2 | TCEQMAIN | Texas Commission on Environmental Quality | TCEQMAIN-14329114 | 2013-10-08 | NaN | NaN | TCEQMAIN-15906 | STORET-422797456 | NaN | NaN | ... | NaN | NaN | 0.24 milligram / liter | NaN | NaN | NaN | NaN | NaN | NaT | NaN |
| 3 | TCEQMAIN | Texas Commission on Environmental Quality | TCEQMAIN-13899297 | 2013-08-01 | NaN | NaN | TCEQMAIN-11287 | STORET-422829817 | NaN | NaN | ... | NaN | NaN | NaN | NaN | NaN | NaN | NaN | NaN | NaT | NaN |
| 4 | TCEQMAIN | Texas Commission on Environmental Quality | TCEQMAIN-13702703 | 2013-05-14 | NaN | NaN | TCEQMAIN-15216 | STORET-422577293 | NaN | NaN | ... | NaN | NaN | NaN | 28.2 Practical_Salinity_Units | NaN | NaN | NaN | NaN | NaT | NaN |
| ... | ... | ... | ... | ... | ... | ... | ... | ... | ... | ... | ... | ... | ... | ... | ... | ... | ... | ... | ... | ... | ... |
| 249329 | USGS-TX | USGS Texas Water Science Center | nwistx.01.02400657 | 2024-01-25 | 08:35:00 | -0600 | USGS-08042546 | NWIS-126809215 | NaN | NaN | ... | NaN | NaN | NaN | NaN | NaN | NaN | NaN | 6.6 dimensionless | 2024-01-25 14:35:00+00:00 | NaN |
| 249330 | USGS-TX | USGS Texas Water Science Center | nwistx.01.02400657 | 2024-01-25 | 08:35:00 | -0600 | USGS-08042546 | NWIS-126809227 | NaN | NaN | ... | NaN | NaN | NaN | NaN | NaN | NaN | 57.0 Nephelometric_Turbidity_Units | NaN | 2024-01-25 14:35:00+00:00 | NaN |
| 249331 | USGS-TX | USGS Texas Water Science Center | nwistx.01.02400659 | 2024-01-25 | 12:35:00 | -0600 | USGS-08042554 | NWIS-126809095 | NaN | NaN | ... | NaN | NaN | NaN | NaN | NaN | 16.0 degree_Celsius | NaN | NaN | 2024-01-25 18:35:00+00:00 | NaN |
| 249332 | USGS-TX | USGS Texas Water Science Center | nwistx.01.02400659 | 2024-01-25 | 12:35:00 | -0600 | USGS-08042554 | NWIS-126809105 | NaN | NaN | ... | NaN | NaN | NaN | NaN | NaN | NaN | NaN | 6.5 dimensionless | 2024-01-25 18:35:00+00:00 | NaN |
| 249333 | USGS-TX | USGS Texas Water Science Center | nwistx.01.02400659 | 2024-01-25 | 12:35:00 | -0600 | USGS-08042554 | NWIS-126809117 | NaN | NaN | ... | NaN | NaN | NaN | NaN | NaN | NaN | 49.0 Nephelometric_Turbidity_Units | NaN | 2024-01-25 18:35:00+00:00 | NaN |
249334 rows × 100 columns
Map results
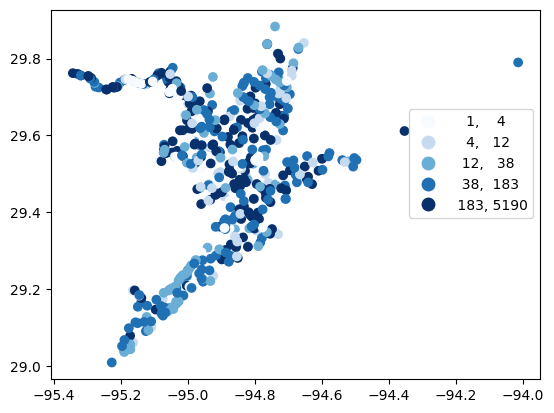
[16]:
# Map number of usable results at each station
gdf_count = visualize.map_counts(df_cleaned, stations_gdf)
legend_kwds = {"fmt": "{:.0f}", 'bbox_to_anchor':(1, 0.75)}
gdf_count.plot(column='cnt', cmap='Blues', legend=True, scheme='quantiles', legend_kwds=legend_kwds)
[16]:
<Axes: >
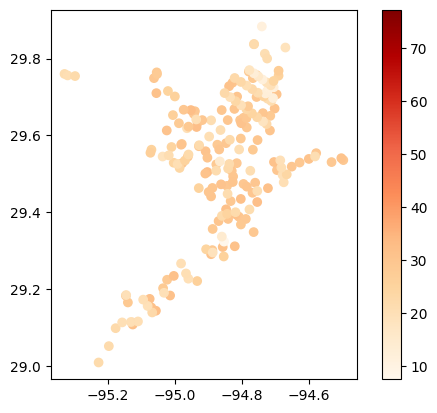
[17]:
# Map average temperature results at each station
gdf_temperature = visualize.map_measure(df_cleaned, stations_gdf, 'Temperature')
gdf_temperature.plot(column='mean', cmap='OrRd', legend=True)
[17]:
<Axes: >
Look through results one parameter at a time
[18]:
# Set standard columns to look through results
cols = ['ResultMeasureValue', 'ResultMeasure/MeasureUnitCode', 'QA_flag']
Note: if there were no results for a given characteristic a result column will not be generated for that characteristic and there will be a keyError when trying to look at results, e.g., ‘KeyError: “[‘Conductivity’] not in index”’ if there are no conductivity results
[19]:
# Secchi
df_cleaned.loc[df_cleaned['CharacteristicName']=='Depth, Secchi disk depth', cols + ['Secchi']]
[19]:
| ResultMeasureValue | ResultMeasure/MeasureUnitCode | QA_flag | Secchi | |
|---|---|---|---|---|
| 13 | 0.41 | m | NaN | 0.41 meter |
| 25 | 0.91 | m | NaN | 0.91 meter |
| 43 | 0.69 | m | NaN | 0.69 meter |
| 51 | 0.20 | m | NaN | 0.2 meter |
| 52 | 0.27 | m | NaN | 0.27 meter |
| ... | ... | ... | ... | ... |
| 249010 | 21.00 | in | NaN | 0.5334 meter |
| 249019 | 0.41 | m | NaN | 0.41 meter |
| 249023 | 0.20 | m | NaN | 0.2 meter |
| 249025 | 0.28 | m | NaN | 0.28 meter |
| 249118 | 14.00 | m | NaN | 14.0 meter |
24848 rows × 4 columns
[20]:
# Temperature
df_cleaned.loc[df_cleaned['CharacteristicName']=='Temperature, water', cols + ['Temperature']]
[20]:
| ResultMeasureValue | ResultMeasure/MeasureUnitCode | QA_flag | Temperature | |
|---|---|---|---|---|
| 11538 | 26.2 | deg C | NaN | 26.2 degree_Celsius |
| 11887 | 25.8 | deg C | NaN | 25.8 degree_Celsius |
| 11982 | 30.5 | deg C | NaN | 30.5 degree_Celsius |
| 12056 | 26.0 | deg C | NaN | 26.0 degree_Celsius |
| 12159 | 30.5 | deg C | NaN | 30.5 degree_Celsius |
| ... | ... | ... | ... | ... |
| 249319 | 16.7 | deg C | NaN | 16.7 degree_Celsius |
| 249322 | 15.8 | deg C | NaN | 15.8 degree_Celsius |
| 249325 | 16.1 | deg C | NaN | 16.1 degree_Celsius |
| 249328 | 15.6 | deg C | NaN | 15.6 degree_Celsius |
| 249331 | 16.0 | deg C | NaN | 16.0 degree_Celsius |
8435 rows × 4 columns
[21]:
# Dissolved Oxygen
df_cleaned.loc[df_cleaned['CharacteristicName']=='Dissolved oxygen (DO)', cols + ['DO']]
[21]:
| ResultMeasureValue | ResultMeasure/MeasureUnitCode | QA_flag | DO | |
|---|---|---|---|---|
| 11084 | 6.70 | mg/L | NaN | 6.7 milligram / liter |
| 12779 | 1.70 | mg/L | NaN | 1.7 milligram / liter |
| 14367 | 1.70 | mg/L | NaN | 1.7 milligram / liter |
| 14585 | 2.10 | mg/L | NaN | 2.1 milligram / liter |
| 14623 | 1.30 | mg/L | NaN | 1.3 milligram / liter |
| ... | ... | ... | ... | ... |
| 241652 | 6.60 | mg/L | NaN | 6.6 milligram / liter |
| 241656 | 7.45 | mg/L | NaN | 7.45 milligram / liter |
| 241689 | 8.70 | mg/L | NaN | 8.7 milligram / liter |
| 241690 | 6.90 | mg/L | NaN | 6.9 milligram / liter |
| 241699 | 8.70 | mg/L | NaN | 8.7 milligram / liter |
538 rows × 4 columns
[22]:
# pH
df_cleaned.loc[df_cleaned['CharacteristicName']=='pH', cols + ['pH']]
[22]:
| ResultMeasureValue | ResultMeasure/MeasureUnitCode | QA_flag | pH | |
|---|---|---|---|---|
| 1 | 7.9 | None | NaN | 7.9 dimensionless |
| 5 | 8.2 | None | NaN | 8.2 dimensionless |
| 6 | 7.8 | None | NaN | 7.8 dimensionless |
| 10 | 7.3 | None | NaN | 7.3 dimensionless |
| 17 | 7.5 | None | NaN | 7.5 dimensionless |
| ... | ... | ... | ... | ... |
| 249320 | 6.7 | std units | NaN | 6.7 dimensionless |
| 249323 | 6.8 | std units | NaN | 6.8 dimensionless |
| 249326 | 6.7 | std units | NaN | 6.7 dimensionless |
| 249329 | 6.6 | std units | NaN | 6.6 dimensionless |
| 249332 | 6.5 | std units | NaN | 6.5 dimensionless |
79481 rows × 4 columns
[23]:
# Salinity
df_cleaned.loc[df_cleaned['CharacteristicName']=='Salinity', cols + ['Salinity']]
[23]:
| ResultMeasureValue | ResultMeasure/MeasureUnitCode | QA_flag | Salinity | |
|---|---|---|---|---|
| 4 | 28.2 | ppt | NaN | 28.2 Practical_Salinity_Units |
| 7 | 25.6 | ppt | NaN | 25.6 Practical_Salinity_Units |
| 14 | 3.8 | ppt | NaN | 3.8 Practical_Salinity_Units |
| 15 | 12.0 | ppt | NaN | 12.0 Practical_Salinity_Units |
| 24 | 20.3 | ppt | NaN | 20.3 Practical_Salinity_Units |
| ... | ... | ... | ... | ... |
| 243312 | 18.8 | ppt | NaN | 18.8 Practical_Salinity_Units |
| 243385 | 20.1 | ppt | NaN | 20.1 Practical_Salinity_Units |
| 249022 | 10.9 | ppt | NaN | 10.9 Practical_Salinity_Units |
| 249026 | 6.8 | ppt | NaN | 6.8 Practical_Salinity_Units |
| 249027 | 12.9 | ppt | NaN | 12.9 Practical_Salinity_Units |
37421 rows × 4 columns
[24]:
# Nitrogen
df_cleaned.loc[df_cleaned['CharacteristicName']=='Nitrogen', cols + ['Nitrogen']]
[24]:
| ResultMeasureValue | ResultMeasure/MeasureUnitCode | QA_flag | Nitrogen | |
|---|---|---|---|---|
| 3 | 0.62 | mg/L | NaN | 0.62 milligram / liter |
| 29 | 0.69 | mg/L | NaN | 0.69 milligram / liter |
| 31 | 2.80 | mg/L | NaN | 2.8 milligram / liter |
| 81 | 2.50 | mg/L | NaN | 2.5 milligram / liter |
| 86 | 2.40 | mg/L | NaN | 2.4 milligram / liter |
| ... | ... | ... | ... | ... |
| 247796 | 1.29 | mg/L | NaN | 1.29 milligram / liter |
| 247966 | 1.34 | mg/L | NaN | 1.34 milligram / liter |
| 248200 | 1.23 | mg/L | NaN | 1.23 milligram / liter |
| 248380 | 3.53 | mg/L | NaN | 3.53 milligram / liter |
| 248812 | 1.57 | mg/L | NaN | 1.57 milligram / liter |
16388 rows × 4 columns
[25]:
# Conductivity
if 'Conductivity' in df_cleaned.columns:
    df_cleaned.loc[df_cleaned['CharacteristicName']=='Conductivity', cols + ['Conductivity']]
[26]:
# Chlorophyll A
df_cleaned.loc[df_cleaned['CharacteristicName']=='Chlorophyll a', cols + ['Chlorophyll']]
[26]:
| ResultMeasureValue | ResultMeasure/MeasureUnitCode | QA_flag | Chlorophyll | |
|---|---|---|---|---|
| 11 | 50.30 | ug/L | NaN | 0.0503 milligram / liter |
| 18 | 16.30 | ug/L | NaN | 0.016300000000000002 milligram / liter |
| 35 | 1.29 | ug/L | NaN | 0.0012900000000000001 milligram / liter |
| 61 | 11.60 | ug/L | NaN | 0.0116 milligram / liter |
| 73 | 20.20 | ug/L | NaN | 0.0202 milligram / liter |
| ... | ... | ... | ... | ... |
| 241681 | 3.72 | ug/L | NaN | 0.00372 milligram / liter |
| 246877 | 1.00 | ug/L | NaN | 0.001 milligram / liter |
| 247193 | 2.00 | ug/L | NaN | 0.002 milligram / liter |
| 249104 | 10.80 | ug/l | NaN | 0.0108 milligram / liter |
| 249125 | 10.80 | ug/l | NaN | 0.0108 milligram / liter |
7451 rows × 4 columns
[27]:
# Carbon
df_cleaned.loc[df_cleaned['CharacteristicName']=='Organic carbon', cols + ['Carbon']]
[27]:
| ResultMeasureValue | ResultMeasure/MeasureUnitCode | QA_flag | Carbon | |
|---|---|---|---|---|
| 12 | 5.00 | mg/L | NaN | 5.0 milligram / liter |
| 16 | 7.00 | mg/L | NaN | 7.0 milligram / liter |
| 21 | 5.00 | mg/L | NaN | 5.0 milligram / liter |
| 36 | 5.00 | mg/L | NaN | 5.0 milligram / liter |
| 53 | 8.00 | mg/L | NaN | 8.0 milligram / liter |
| ... | ... | ... | ... | ... |
| 249183 | 6.16 | mg/l | NaN | 6.16 milligram / liter |
| 249215 | 11.80 | mg/l | NaN | 11.8 milligram / liter |
| 249216 | 7.05 | mg/l | NaN | 7.05 milligram / liter |
| 249280 | 10.70 | mg/l | NaN | 10.7 milligram / liter |
| 249281 | 6.15 | mg/l | NaN | 6.15 milligram / liter |
8284 rows × 4 columns
[28]:
# Turbidity
df_cleaned.loc[df_cleaned['CharacteristicName']=='Turbidity', cols + ['Turbidity']]
[28]:
| ResultMeasureValue | ResultMeasure/MeasureUnitCode | QA_flag | Turbidity | |
|---|---|---|---|---|
| 302 | 28.0 | NTU | NaN | 28.0 Nephelometric_Turbidity_Units |
| 370 | 3.0 | None | ResultMeasure/MeasureUnitCode: 'None' UNDEFINE... | 3.0 Nephelometric_Turbidity_Units |
| 565 | 3.0 | None | ResultMeasure/MeasureUnitCode: 'None' UNDEFINE... | 3.0 Nephelometric_Turbidity_Units |
| 588 | 2.0 | None | ResultMeasure/MeasureUnitCode: 'None' UNDEFINE... | 2.0 Nephelometric_Turbidity_Units |
| 686 | 2.0 | None | ResultMeasure/MeasureUnitCode: 'None' UNDEFINE... | 2.0 Nephelometric_Turbidity_Units |
| ... | ... | ... | ... | ... |
| 249321 | 35.0 | FNU | NaN | 35.0 Nephelometric_Turbidity_Units |
| 249324 | 150.0 | FNU | NaN | 150.0 Nephelometric_Turbidity_Units |
| 249327 | 56.0 | FNU | NaN | 56.0 Nephelometric_Turbidity_Units |
| 249330 | 57.0 | FNU | NaN | 57.0 Nephelometric_Turbidity_Units |
| 249333 | 49.0 | FNU | NaN | 49.0 Nephelometric_Turbidity_Units |
7363 rows × 4 columns
[29]:
# Sediment
df_cleaned.loc[df_cleaned['CharacteristicName']=='Sediment', cols + ['Sediment']]
[29]:
| ResultMeasureValue | ResultMeasure/MeasureUnitCode | QA_flag | Sediment | |
|---|---|---|---|---|
| 221899 | 0.0091 | g | NaN | NaN |
| 221900 | 0.0091 | g | NaN | NaN |
| 221901 | 0.0000 | g | NaN | NaN |
| 221921 | 0.0140 | g | NaN | NaN |
| 221922 | 0.0136 | g | NaN | NaN |
| ... | ... | ... | ... | ... |
| 249294 | 0.1214 | g | NaN | NaN |
| 249295 | 0.0116 | g | NaN | NaN |
| 249296 | 0.1478 | g | NaN | NaN |
| 249297 | 0.1410 | g | NaN | NaN |
| 249298 | 0.0068 | g | NaN | NaN |
529 rows × 4 columns
[30]:
# Phosphorus
df_cleaned.loc[df_cleaned['TDP_Phosphorus'].notna(), ['ResultMeasureValue', 'ResultMeasure/MeasureUnitCode', 'QA_flag', 'TDP_Phosphorus']]
[30]:
| ResultMeasureValue | ResultMeasure/MeasureUnitCode | QA_flag | TDP_Phosphorus | |
|---|---|---|---|---|
| 201017 | 0.060 | mg/l as P | NaN | 0.06 milligram / liter |
| 201093 | 0.020 | mg/l as P | NaN | 0.02 milligram / liter |
| 201142 | 0.070 | mg/l as P | NaN | 0.07 milligram / liter |
| 201353 | 0.020 | mg/l as P | NaN | 0.02 milligram / liter |
| 201426 | 0.030 | mg/l as P | NaN | 0.03 milligram / liter |
| ... | ... | ... | ... | ... |
| 249121 | 0.096 | mg/l as P | NaN | 0.096 milligram / liter |
| 249135 | 0.070 | mg/l as P | NaN | 0.07 milligram / liter |
| 249141 | 0.050 | mg/l as P | NaN | 0.05 milligram / liter |
| 249147 | 0.090 | mg/l as P | NaN | 0.09 milligram / liter |
| 249153 | 0.060 | mg/l as P | NaN | 0.06 milligram / liter |
820 rows × 4 columns
[31]:
df_cleaned.loc[df_cleaned['TP_Phosphorus'].notna(), ['ResultMeasureValue', 'ResultMeasure/MeasureUnitCode', 'QA_flag', 'TP_Phosphorus']]
[31]:
| ResultMeasureValue | ResultMeasure/MeasureUnitCode | QA_flag | TP_Phosphorus | |
|---|---|---|---|---|
| 309 | 0.16 | mg/L | NaN | 0.16 milligram / liter |
| 587 | 0.08 | mg/L | NaN | 0.08 milligram / liter |
| 693 | 0.81 | mg/L | NaN | 0.81 milligram / liter |
| 767 | 0.18 | mg/L | NaN | 0.18 milligram / liter |
| 1074 | 0.33 | mg/L | NaN | 0.33 milligram / liter |
| ... | ... | ... | ... | ... |
| 249163 | 0.11 | mg/l as P | NaN | 0.11 milligram / liter |
| 249175 | 0.18 | mg/l as P | NaN | 0.18 milligram / liter |
| 249181 | 0.30 | mg/l as P | NaN | 0.3 milligram / liter |
| 249214 | 0.22 | mg/l as P | NaN | 0.22 milligram / liter |
| 249279 | 0.32 | mg/l as P | NaN | 0.32 milligram / liter |
13760 rows × 4 columns
Characteristic to Column (long to wide format)
Note: each parameter should be compared against acceptance criteria before these steps as duplicates and bad data can be problematic
[32]:
# Split single QA column into multiple by characteristic (rename the result to preserve these QA_flags)
df2 = wrangle.split_col(df_cleaned)
df2
[32]:
| OrganizationIdentifier | OrganizationFormalName | ActivityIdentifier | ActivityStartDate | ActivityStartTime/Time | ActivityStartTime/TimeZoneCode | MonitoringLocationIdentifier | ResultIdentifier | DataLoggerLine | ResultDetectionConditionText | ... | QA_Turbidity | QA_Chlorophyll | QA_Nitrogen | QA_DO | QA_Sediment | QA_Conductivity | QA_Secchi | QA_Temperature | QA_pH | QA_Carbon | |
|---|---|---|---|---|---|---|---|---|---|---|---|---|---|---|---|---|---|---|---|---|---|
| 0 | TCEQMAIN | Texas Commission on Environmental Quality | TCEQMAIN-13702013 | 2013-04-29 | NaN | NaN | TCEQMAIN-15224 | STORET-422578803 | NaN | NaN | ... | NaN | NaN | NaN | NaN | NaN | NaN | NaN | NaN | NaN | NaN |
| 1 | TCEQMAIN | Texas Commission on Environmental Quality | TCEQMAIN-13947279 | 2013-07-11 | NaN | NaN | TCEQMAIN-11446 | STORET-422881708 | NaN | NaN | ... | NaN | NaN | NaN | NaN | NaN | NaN | NaN | NaN | NaN | NaN |
| 2 | TCEQMAIN | Texas Commission on Environmental Quality | TCEQMAIN-14329114 | 2013-10-08 | NaN | NaN | TCEQMAIN-15906 | STORET-422797456 | NaN | NaN | ... | NaN | NaN | NaN | NaN | NaN | NaN | NaN | NaN | NaN | NaN |
| 3 | TCEQMAIN | Texas Commission on Environmental Quality | TCEQMAIN-13899297 | 2013-08-01 | NaN | NaN | TCEQMAIN-11287 | STORET-422829817 | NaN | NaN | ... | NaN | NaN | NaN | NaN | NaN | NaN | NaN | NaN | NaN | NaN |
| 4 | TCEQMAIN | Texas Commission on Environmental Quality | TCEQMAIN-13702703 | 2013-05-14 | NaN | NaN | TCEQMAIN-15216 | STORET-422577293 | NaN | NaN | ... | NaN | NaN | NaN | NaN | NaN | NaN | NaN | NaN | NaN | NaN |
| ... | ... | ... | ... | ... | ... | ... | ... | ... | ... | ... | ... | ... | ... | ... | ... | ... | ... | ... | ... | ... | ... |
| 249329 | USGS-TX | USGS Texas Water Science Center | nwistx.01.02400657 | 2024-01-25 | 08:35:00 | -0600 | USGS-08042546 | NWIS-126809215 | NaN | NaN | ... | NaN | NaN | NaN | NaN | NaN | NaN | NaN | NaN | NaN | NaN |
| 249330 | USGS-TX | USGS Texas Water Science Center | nwistx.01.02400657 | 2024-01-25 | 08:35:00 | -0600 | USGS-08042546 | NWIS-126809227 | NaN | NaN | ... | NaN | NaN | NaN | NaN | NaN | NaN | NaN | NaN | NaN | NaN |
| 249331 | USGS-TX | USGS Texas Water Science Center | nwistx.01.02400659 | 2024-01-25 | 12:35:00 | -0600 | USGS-08042554 | NWIS-126809095 | NaN | NaN | ... | NaN | NaN | NaN | NaN | NaN | NaN | NaN | NaN | NaN | NaN |
| 249332 | USGS-TX | USGS Texas Water Science Center | nwistx.01.02400659 | 2024-01-25 | 12:35:00 | -0600 | USGS-08042554 | NWIS-126809105 | NaN | NaN | ... | NaN | NaN | NaN | NaN | NaN | NaN | NaN | NaN | NaN | NaN |
| 249333 | USGS-TX | USGS Texas Water Science Center | nwistx.01.02400659 | 2024-01-25 | 12:35:00 | -0600 | USGS-08042554 | NWIS-126809117 | NaN | NaN | ... | NaN | NaN | NaN | NaN | NaN | NaN | NaN | NaN | NaN | NaN |
231057 rows × 115 columns
[33]:
# This expands the single col (QA_flag) out to a number of new columns based on the unique characteristicNames and speciation
print('{} new columns'.format(len(df2.columns) - len(df_cleaned.columns)))
15 new columns
[34]:
# Note: there are fewer rows because NAN results are also dropped in this step
print('{} fewer rows'.format(len(df_cleaned)-len(df2)))
18277 fewer rows
[35]:
#Examine Carbon flags from earlier in notebook (note these are empty now because NAN is dropped)
cols = ['ResultMeasureValue', 'ResultMeasure/MeasureUnitCode', 'Carbon', 'QA_Carbon']
df2.loc[df2['QA_Carbon'].notna(), cols]
[35]:
| ResultMeasureValue | ResultMeasure/MeasureUnitCode | Carbon | QA_Carbon |
|---|
Next the table is divided into the columns of interest (main_df) and characteristic specific metadata (chars_df)
[36]:
# split table into main and characteristics tables
main_df, chars_df = wrangle.split_table(df2)
[37]:
# Columns still in main table
main_df.columns
[37]:
Index(['OrganizationIdentifier', 'OrganizationFormalName',
       'ActivityIdentifier', 'MonitoringLocationIdentifier', 'ProviderName',
       'Chlorophyll', 'Conductivity', 'Secchi', 'DO', 'E_coli',
       'Fecal_Coliform', 'Nitrogen', 'Speciation',
       'TOTAL NITROGEN_ MIXED FORMS', 'Carbon', 'Phosphorus', 'TP_Phosphorus',
       'TDP_Phosphorus', 'Other_Phosphorus', 'Salinity', 'Sediment',
       'Temperature', 'Turbidity', 'pH', 'Activity_datetime', 'Depth',
       'QA_E_coli', 'QA_TP_Phosphorus', 'QA_TDP_Phosphorus',
       'QA_Other_Phosphorus', 'QA_Salinity', 'QA_Fecal_Coliform',
       'QA_Turbidity', 'QA_Chlorophyll', 'QA_Nitrogen', 'QA_DO', 'QA_Sediment',
       'QA_Conductivity', 'QA_Secchi', 'QA_Temperature', 'QA_pH', 'QA_Carbon'],
      dtype='object')
[38]:
# look at main table results (first 5)
main_df.head()
[38]:
| OrganizationIdentifier | OrganizationFormalName | ActivityIdentifier | MonitoringLocationIdentifier | ProviderName | Chlorophyll | Conductivity | Secchi | DO | E_coli | ... | QA_Turbidity | QA_Chlorophyll | QA_Nitrogen | QA_DO | QA_Sediment | QA_Conductivity | QA_Secchi | QA_Temperature | QA_pH | QA_Carbon | |
|---|---|---|---|---|---|---|---|---|---|---|---|---|---|---|---|---|---|---|---|---|---|
| 0 | TCEQMAIN | Texas Commission on Environmental Quality | TCEQMAIN-13702013 | TCEQMAIN-15224 | STORET | NaN | NaN | NaN | NaN | NaN | ... | NaN | NaN | NaN | NaN | NaN | NaN | NaN | NaN | NaN | NaN |
| 1 | TCEQMAIN | Texas Commission on Environmental Quality | TCEQMAIN-13947279 | TCEQMAIN-11446 | STORET | NaN | NaN | NaN | NaN | NaN | ... | NaN | NaN | NaN | NaN | NaN | NaN | NaN | NaN | NaN | NaN |
| 2 | TCEQMAIN | Texas Commission on Environmental Quality | TCEQMAIN-14329114 | TCEQMAIN-15906 | STORET | NaN | NaN | NaN | NaN | NaN | ... | NaN | NaN | NaN | NaN | NaN | NaN | NaN | NaN | NaN | NaN |
| 3 | TCEQMAIN | Texas Commission on Environmental Quality | TCEQMAIN-13899297 | TCEQMAIN-11287 | STORET | NaN | NaN | NaN | NaN | NaN | ... | NaN | NaN | NaN | NaN | NaN | NaN | NaN | NaN | NaN | NaN |
| 4 | TCEQMAIN | Texas Commission on Environmental Quality | TCEQMAIN-13702703 | TCEQMAIN-15216 | STORET | NaN | NaN | NaN | NaN | NaN | ... | NaN | NaN | NaN | NaN | NaN | NaN | NaN | NaN | NaN | NaN |
5 rows × 42 columns
[39]:
# Empty columns that could be dropped (Mostly QA columns)
cols = list(main_df.columns)
x = main_df.dropna(axis=1, how='all')
[col for col in cols if col not in x.columns]
[39]:
['Sediment',
 'QA_TP_Phosphorus',
 'QA_TDP_Phosphorus',
 'QA_Other_Phosphorus',
 'QA_Salinity',
 'QA_Nitrogen',
 'QA_DO',
 'QA_Sediment',
 'QA_Conductivity',
 'QA_Secchi',
 'QA_Temperature',
 'QA_pH',
 'QA_Carbon']
[40]:
# Map average results at each station
gdf_avg = visualize.map_measure(main_df, stations_gdf, 'Temperature')
gdf_avg.plot(column='mean', cmap='OrRd', legend=True)
[40]:
<Axes: >
