Technical Details
Michael Dumelle, Matt Higham, and Jay M. Ver Hoef
Source:vignettes/articles/technical.Rmd
technical.RmdIntroduction
This vignette covers technical details regarding the functions in
that perform computations in spmodel. We first provide a
notation guide and then describe relevant details for each function.
If you use spmodel in a formal publication or report,
please cite it. Citing spmodel lets us devote more
resources to it in the future. To view the spmodel
citation, run
citation(package = "spmodel")#> To cite spmodel in publications use:
#>
#> Dumelle M, Higham M, Ver Hoef JM (2023). spmodel: Spatial statistical
#> modeling and prediction in R. PLOS ONE 18(3): e0282524.
#> https://doi.org/10.1371/journal.pone.0282524
#>
#> A BibTeX entry for LaTeX users is
#>
#> @Article{,
#> title = {{spmodel}: Spatial statistical modeling and prediction in {R}},
#> author = {Michael Dumelle and Matt Higham and Jay M. {Ver Hoef}},
#> journal = {PLOS ONE},
#> year = {2023},
#> volume = {18},
#> number = {3},
#> pages = {1--32},
#> doi = {10.1371/journal.pone.0282524},
#> url = {https://doi.org/10.1371/journal.pone.0282524},
#> }Notation Guide
\[\begin{equation*} \begin{split} n & = \text{Sample size} \\ \mathbf{y} & = \text{Response vector} \\ \boldsymbol{\beta} & = \text{Fixed effect parameter vector} \\ \mathbf{X} & = \text{Design matrix of known explanatory variables (covariates)} \\ p & = \text{The number of linearly independent columns in } \mathbf{X} \\ \boldsymbol{\mu} & = \text{Mean vector} \\ \mathbf{w} & = \text{Latent generalized linear model mean on the link scale} \\ \varphi & = \text{Dispersion parameter} \\ \mathbf{Z} & = \text{Design matrix of known random effect variables} \\ \boldsymbol{\theta} & = \text{Covariance parameter vector} \\ \boldsymbol{\Sigma} & = \text{Covariance matrix evaluated at } \boldsymbol{\theta} \\ \boldsymbol{\Sigma}^{-1} & = \text{The inverse of } \boldsymbol{\Sigma} \\ \boldsymbol{\Sigma}^{1/2} & = \text{The square root of } \boldsymbol{\Sigma} \\ \boldsymbol{\Sigma}^{-1/2} & = \text{The inverse of } \boldsymbol{\Sigma}^{1/2} \\ \boldsymbol{\Theta} & = \text{General parameter vector} \\ \ell(\boldsymbol{\Theta}) & = \text{Log-likelihood evaluated at } \boldsymbol{\Theta} \\ \boldsymbol{\tau} & = \text{Spatial (dependent) random error} \\ \boldsymbol{\epsilon} & = \text{Independent (non-spatial) random error} \\ \mathbf{A}^* & = \boldsymbol{\Sigma}^{-1/2}\mathbf{A} \text{ for a general matrix } \mathbf{A} \text{ (this is known as whitening $\mathbf{A}$)} \end{split} \end{equation*}\]A hat indicates the parameters are estimated (i.e., \(\hat{\boldsymbol{\beta}}\)) or evaluated at a relevant estimated parameter vector (e.g., \(\hat{\boldsymbol{\Sigma}}\) is evaluated at \(\hat{\boldsymbol{\theta}}\)). When \(\ell(\boldsymbol{\hat{\Theta}})\) is written, it means the log-likelihood evaluated at its maximum, \(\boldsymbol{\hat{\Theta}}\). When the covariance matrix of \(\mathbf{A}\) is \(\boldsymbol{\Sigma}\), we say \(\mathbf{A}^*\) “whitens” \(\mathbf{A}\) because \[\begin{equation*} \text{Cov}(\mathbf{A}^*) = \text{Cov}(\boldsymbol{\Sigma}^{-1/2}\mathbf{A}) = \boldsymbol{\Sigma}^{-1/2}\text{Cov}(\mathbf{A})\boldsymbol{\Sigma}^{-1/2} = \boldsymbol{\Sigma}^{-1/2}\boldsymbol{\Sigma} \boldsymbol{\Sigma}^{-1/2} = (\boldsymbol{\Sigma}^{-1/2}\boldsymbol{\Sigma}^{1/2})(\boldsymbol{\Sigma}^{1/2}\boldsymbol{\Sigma}^{-1/2}) = \mathbf{I}. \end{equation*}\] Later we discuss how to obtain \(\boldsymbol{\Sigma}^{1/2}\).
Additional notation is used in the predict() section:
\[\begin{equation*}
\begin{split}
\mathbf{y}_o & = \text{Observed response vector} \\
\mathbf{y}_u & = \text{Unobserved response vector} \\
\mathbf{X}_o & = \text{Design matrix of known explanatory
variables at observed response variable locations} \\
\mathbf{X}_u & = \text{Design matrix of known explanatory
variables at unobserved response variable locations} \\
\boldsymbol{\Sigma}_o & = \text{Covariance matrix of
$\mathbf{y}_o$ evaluated at } \boldsymbol{\theta} \\
\boldsymbol{\Sigma}_u & = \text{Covariance matrix of
$\mathbf{y}_u$ evaluated at } \boldsymbol{\theta} \\
\boldsymbol{\Sigma}_{uo} & = \text{A matrix of covariances
between $\mathbf{y}_u$ and $\mathbf{y}_o$ evaluated at }
\boldsymbol{\theta} \\
\mathbf{w}_o & = \text{Latent $\mathbf{w}$ for each observation
in $\mathbf{y}_o$} \\
\mathbf{w}_u & = \text{Latent $\mathbf{w}$ for each observation
in $\mathbf{y}_o$} \\
\mathbf{G}_o & = \text{Hessian for $\mathbf{w}_o$} \\
\end{split}
\end{equation*}\]
Spatial Linear Models
Statistical linear models are often parameterized as \[\begin{equation}\label{eq:lm} \mathbf{y} = \mathbf{X} \boldsymbol{\beta} + \boldsymbol{\epsilon}, \end{equation}\] where for a sample size \(n\), \(\mathbf{y}\) is an \(n \times 1\) column vector of response variables, \(\mathbf{X}\) is an \(n \times p\) design (model) matrix of explanatory variables, \(\boldsymbol{\beta}\) is a \(p \times 1\) column vector of fixed effects controlling the impact of \(\mathbf{X}\) on \(\mathbf{y}\), and \(\boldsymbol{\epsilon}\) is an \(n \times 1\) column vector of random errors. We typically assume that \(\text{E}(\boldsymbol{\epsilon}) = \mathbf{0}\) and \(\text{Cov}(\boldsymbol{\epsilon}) = \sigma^2_\epsilon \mathbf{I}\), where \(\text{E}(\cdot)\) denotes expectation, \(\text{Cov}(\cdot)\) denotes covariance, \(\sigma^2_\epsilon\) denotes a variance parameter, and \(\mathbf{I}\) denotes the identity matrix.
The model \(\mathbf{y} = \mathbf{X} \boldsymbol{\beta} + \boldsymbol{\epsilon}\) assumes the elements of \(\mathbf{y}\) are uncorrelated. Typically for spatial data, elements of \(\mathbf{y}\) are correlated, as observations close together in space tend to be more similar than observations far apart (Tobler 1970). Failing to properly accommodate the spatial dependence in \(\mathbf{y}\) can cause researchers to draw incorrect conclusions about their data. To accommodate spatial dependence in \(\mathbf{y}\), an \(n \times 1\) spatial random effect, \(\boldsymbol{\tau}\), is added to the linear model, yielding the model \[\begin{equation}\label{eq:splm} \mathbf{y} = \mathbf{X} \boldsymbol{\beta} + \boldsymbol{\tau} + \boldsymbol{\epsilon}, \end{equation}\] where \(\boldsymbol{\tau}\) is independent of \(\boldsymbol{\epsilon}\), \(\text{E}(\boldsymbol{\tau}) = \mathbf{0}\), \(\text{Cov}(\boldsymbol{\tau}) = \sigma^2_\tau \mathbf{R}\), \(\mathbf{R}\) is a matrix that determines the spatial dependence structure in \(\mathbf{y}\) and depends on a range parameter, \(\phi\). We discuss \(\mathbf{R}\) in more detail shortly. The parameter \(\sigma^2_\tau\) is called the spatially dependent random error variance or partial sill. The parameter \(\sigma^2_\epsilon\) is called the spatially independent random error variance or nugget. These two variance parameters are henceforth more intuitively written as \(\sigma^2_{de}\) and \(\sigma^2_{ie}\), respectively. The covariance of \(\mathbf{y}\) is denoted \(\boldsymbol{\Sigma}\) and given by \(\sigma^2_{de} \mathbf{R} + \sigma^2_{ie} \mathbf{I}\). The parameters that compose this covariance are contained in the vector \(\boldsymbol{\theta}\), which is called the covariance parameter vector.
The model \(\mathbf{y} = \mathbf{X}
\boldsymbol{\beta} + \boldsymbol{\tau} + \boldsymbol{\epsilon}\)
is called the spatial linear model. The spatial linear model applies to
both point-referenced and areal (i.e., lattice) data. Spatial data are
point-referenced when the elements in \(\mathbf{y}\) are observed at
point-locations indexed by x-coordinates and y-coordinates on a
spatially continuous surface with an infinite number of locations. The
splm() function is used to fit spatial linear models for
point-referenced data (these are sometimes called geostatistical
models). One spatial covariance function available in
splm() is the exponential spatial covariance function,
which has an \(\mathbf{R}\) matrix
given by \[\begin{equation*}
\mathbf{R} = \exp(-\mathbf{M} / \phi),
\end{equation*}\]
where \(\mathbf{M}\) is a matrix of
Euclidean distances among observations. Recall that \(\phi\) is the range parameter, controlling
the behavior of of the covariance function as a function of distance.
Parameterizations for splm() spatial covariance types and
their \(\mathbf{R}\) matrices can be
seen by running help("splm", "spmodel") or
vignette("technical", "spmodel"). Some of these spatial
covariance types (e.g., Matérn) depend on an extra parameter beyond
\(\sigma^2_{de}\), \(\sigma^2_{ie}\), and \(\phi\).
Spatial data are areal when the elements in \(\mathbf{y}\) are observed as part of a
finite network of polygons whose connections are indexed by a
neighborhood structure. For example, the polygons may represent counties
in a state that are neighbors if they share at least one boundary. Areal
data are often equivalently called lattice data (Cressie 1993). The spautor()
function is used to fit spatial linear models for areal data (these are
sometimes called spatial autoregressive models). One spatial
autoregressive covariance function available in spautor()
is the simultaneous autoregressive spatial covariance function, which
has an \(\mathbf{R}\) matrix given by
\[\begin{equation*}
\mathbf{R} = [(\mathbf{I} - \phi \mathbf{W})(\mathbf{I} - \phi
\mathbf{W})^\top]^{-1},
\end{equation*}\] where \(\mathbf{W}\) is a weight matrix describing
the neighborhood structure in \(\mathbf{y}\). Parameterizations for
spautor() spatial covariance types and their \(\mathbf{R}\) matrices can be seen by
running help("spautor", "spmodel") or
vignette("technical", "spmodel").
One way to define \(\mathbf{W}\) is through queen contiguity (Anselin et al. 2010). Two observations are queen contiguous if they share a boundary. The \(ij\)th element of \(\mathbf{W}\) is then one if observation \(i\) and observation \(j\) are queen contiguous and zero otherwise. Observations are not considered neighbors with themselves, so each diagonal element of \(\mathbf{W}\) is zero.
Sometimes each element in the weight matrix \(\mathbf{W}\) is divided by its respective row sum. This is called row-standardization. Row-standardizing \(\mathbf{W}\) has several benefits, which are discussed in detail by Ver Hoef et al. (2018).
AIC() and AICc()
The AIC() and AICc() functions in
spmodel are defined for restricted maximum likelihood and
maximum likelihood estimation, which maximize a likelihood. The AIC and
AICc as defined by Hoeting et al. (2006)
are given by \[\begin{equation*}\label{eq:sp_aic}
\begin{split}
\text{AIC} & = -2\ell(\hat{\boldsymbol{\Theta}}) +
2(|\hat{\boldsymbol{\Theta}}|) \\
\text{AICc} & = -2\ell(\hat{\boldsymbol{\Theta}}) +
2n(|\hat{\boldsymbol{\Theta}}|) / (n - |\hat{\boldsymbol{\Theta}}| - 1),
\end{split}
\end{equation*}\] where \(|\hat{\boldsymbol{\Theta}}|\) is the
cardinality of \(\hat{\boldsymbol{\Theta}}\). For restricted
maximum likelihood, \(\hat{\boldsymbol{\Theta}} \equiv
\{\hat{\boldsymbol{\theta}}\}\). For maximum likelihood, \(\hat{\boldsymbol{\Theta}} \equiv
\{\hat{\boldsymbol{\theta}}, \hat{\boldsymbol{\beta}}\}\) The
discrepancy arises because restricted maximum likelihood integrates the
fixed effects out of the likelihood, and so the likelihood does not
depend on \(\boldsymbol{\beta}\).
AIC comparisons between a model fit using restricted maximum likelihood and a model fit using maximum likelihood are meaningless, as the models are fit with different likelihoods. AIC comparisons between models fit using restricted maximum likelihood are only valid when the models have the same fixed effect structure. In contrast, AIC comparisons between models fit using maximum likelihood are valid when the models have different fixed effect structures.
anova()
Test statistics from anova() are formed using the
general linear hypothesis test. Let \(\mathbf{L}\) be an \(l \times p\) contrast matrix and \(l_0\) be an \(l
\times 1\) vector. The null hypothesis is that \(\mathbf{L} \boldsymbol{\hat{\beta}} = l_0\)
and the alternative hypothesis is that \(\mathbf{L} \boldsymbol{\hat{\beta}} \neq
l_0\). Usually, \(l_0\) is the
zero vector (in spmodel, this is assumed). The test
statistic is denoted \(Chi2\) and is
given by \[\begin{equation*}\label{eq:glht}
Chi2 = [(\mathbf{L} \boldsymbol{\hat{\beta}} - l_0)^\top(\mathbf{L}
(\mathbf{X}^\top \mathbf{\hat{\Sigma}} \mathbf{X})^{-1}
\mathbf{L}^\top)^{-1}(\mathbf{L} \boldsymbol{\hat{\beta}} - l_0)]
\end{equation*}\] By default, \(\mathbf{L}\) is chosen such that each
variable in the data used to fit the model is tested marginally (i.e.,
controlling for the other variables) against \(l_0 = \mathbf{0}\). If this default is not
desired, the Terms and L arguments can be used
to pass user-defined \(\mathbf{L}\)
matrices to anova(). They must be constructed in such a way
that \(l_0 = \mathbf{0}\).
It is notoriously difficult to determine appropriate p-values for linear mixed models based on the general linear hypothesis test. lme4, for example, does not report p-values by default. A few reasons why obtaining p-values is so challenging:
- The first (and often most important) challenge is that when estimating \(\boldsymbol{\theta}\) using a finite sample, it is usually not clear what the null distribution of \(Chi2\) is. In certain cases such as ordinary least squares regression or some experimental designs (e.g., blocked design, split plot design, etc.), \(Chi2 / rank(\mathbf{L})\) is F-distributed with known numerator and denominator degrees of freedom. But outside of these well-studied cases, no general results exist.
- The second challenge is that the standard error of \(Chi2\) does not account for the uncertainty in \(\boldsymbol{\hat{\theta}}\). For some approaches to addressing this problem, see Kackar and Harville (1984), Prasad and Rao (1990), Harville and Jeske (1992), and Kenward and Roger (1997).
- The third challenge is in determining denominator degrees of freedom. Again, in some cases, these are known – but this is not true in general. For some approaches to addressing this problem, see Satterthwaite (1946), Schluchter and Elashoff (1990), Hrong-Tai Fai and Cornelius (1996), Kenward and Roger (1997), Littell et al. (2006), Pinheiro and Bates (2006), and Kenward and Roger (2009).
For these reasons, spmodel uses an asymptotic (i.e.,
large sample) Chi-squared test when calculating p-values using
anova(). This approach addresses the three points above by
assuming that with a large enough sample size:
- \(Chi2\) is asymptotically Chi-squared (under certain conditions) with \(rank(\mathbf{L})\) degrees of freedom when the null hypothesis is true.
- The uncertainty from estimating \(\boldsymbol{\hat{\theta}}\) is small enough to be safely ignored.
Because the approximation is asymptotic, degree of freedom adjustments can be ignored (it is also worth noting that an F distribution with infinite denominator degrees of freedom is a Chi-squared distribution scaled by \(rank(\mathbf{L})\). This asymptotic approximation implies these p-values are likely unreliable with small samples.
Note that when comparing full and reduced models, the general linear hypothesis test is analogous to an extra sum of (whitened) squares approach (Myers et al. 2012).
A second approach to determining p-values is a likelihood ratio test. Let \(\ell(\boldsymbol{\hat{\Theta}})\) be the log-likelihood for some full model and \(\ell(\boldsymbol{\hat{\Theta}}_0)\) be the log-likelihood for some reduced model. For the likelihood ratio test to be valid, the reduced model must be nested in the full model, which means that \(\ell(\boldsymbol{\hat{\Theta}}_0)\) is obtained by fixing some parameters in \(\boldsymbol{\Theta}\). When the likelihood ratio test is valid, \(X^2 = 2\ell(\boldsymbol{\hat{\Theta}}) - 2\ell(\boldsymbol{\hat{\Theta}}_0)\) is asymptotically Chi-squared with degrees of freedom equal to the difference in estimated parameters between the full and reduced models.
For restricted maximum likelihood estimation, likelihood ratio tests can only be used to compare nested models with the same explanatory variables. To use likelihood ratio tests for comparing different explanatory variable structures, parameters must be estimated using maximum likelihood estimation. When using likelihood ratio tests to assess the importance of parameters on the boundary of a parameter space (e.g., a variance parameter being zero), p-values tend to be too large (Self and Liang 1987; Stram and Lee 1994; Goldman and Whelan 2000; Pinheiro and Bates 2006).
BIC()
The BIC() function in spmodel is defined
for restricted maximum likelihood and maximum likelihood estimation,
which maximize a likelihood. The BIC as defined by Schwarz (1978) is given by \[\begin{equation*}\label{eq:sp_bic}
\text{BIC} = -2\ell(\hat{\boldsymbol{\Theta}}) +
\ln(n)(|\hat{\boldsymbol{\Theta}}|),
\end{equation*}\] where \(n\) is
the sample size and \(|\hat{\boldsymbol{\Theta}}|\) is the
cardinality of \(\hat{\boldsymbol{\Theta}}\). For restricted
maximum likelihood, \(\hat{\boldsymbol{\Theta}} \equiv
\{\hat{\boldsymbol{\theta}}\}\). For maximum likelihood, \(\hat{\boldsymbol{\Theta}} \equiv
\{\hat{\boldsymbol{\theta}}, \hat{\boldsymbol{\beta}}\}\) The
discrepancy arises because restricted maximum likelihood integrates the
fixed effects out of the likelihood, and so the likelihood does not
depend on \(\boldsymbol{\beta}\).
BIC comparisons between a model fit using restricted maximum likelihood and a model fit using maximum likelihood are meaningless, as the models are fit with different likelihoods. BIC comparisons between models fit using restricted maximum likelihood are only valid when the models have the same fixed effect structure. In contrast, BIC comparisons between models fit using maximum likelihood are valid when the models have different fixed effect structures. While BIC was derived by Schwarz (1978) for independent data, Zimmerman and Ver Hoef (2024) show it can be useful for spatially-dependent data as well.
coef()
coef() returns relevant coefficients based on the
type argument. When type = "fixed" (the
default), coef() returns \[\begin{equation*}
\hat{\boldsymbol{\beta}} = (\mathbf{X}^\top
\hat{\boldsymbol{\Sigma}}^{-1} \mathbf{X})^{-1}\mathbf{X}^\top
\hat{\boldsymbol{\Sigma}}^{-1} \mathbf{y} .
\end{equation*}\] If the estimation method is restricted maximum
likelihood or maximum likelihood, \(\hat{\boldsymbol{\beta}}\) is known as the
restricted maximum likelihood or maximum likelihood estimator of \(\boldsymbol{\beta}\). If the estimation
method is semivariogram weighted least squares or semivariogram
composite likelihood, \(\hat{\boldsymbol{\beta}}\) is known as the
empirical generalized least squares estimator of \(\boldsymbol{\beta}\). When
type = "spcov", the estimated spatial covariance parameters
are returned (available for all estimation methods). When
type = "randcov", the estimated random effect variance
parameters are returned (available for restricted maximum likelihood and
maximum likelihood estimation).
confint()
confint() returns confidence intervals for estimated
parameters. Currently, confint() only returns confidence
intervals for \(\boldsymbol{\beta}\).
The \((1 - \alpha)\)% confidence
interval for \(\beta_i\) is \[\begin{equation*}
\hat{\beta}_i \pm z^* \sqrt{(\mathbf{X}^\top
\hat{\boldsymbol{\Sigma}}^{-1} \mathbf{X})^{-1}_{i, i}},
\end{equation*}\] where \((\mathbf{X}^\top \hat{\boldsymbol{\Sigma}}^{-1}
\mathbf{X})^{-1}_{i, i}\) is the \(i\)th diagonal element in \((\mathbf{X}^\top \hat{\boldsymbol{\Sigma}}^{-1}
\mathbf{X})^{-1}\), \(\Phi(z^*) = 1 -
\alpha / 2\), \(\Phi(\cdot)\) is
the standard normal (Gaussian) cumulative distribution function, and
\(\alpha = 1 -\) level,
where level is an argument to confint(). The
default for level is 0.95, which corresponds to a \(z^*\) of approximately 1.96.
cooks.distance()
Cook’s distance measures the influence of an observation (Cook 1979; Cook and Weisberg 1982). An influential observation has a large impact on the model fit. The vector of Cook’s distances for the spatial linear model is given by \[\begin{equation} \label{eq:cooksd} \frac{\mathbf{e}_p^2}{p} \odot diag(\mathbf{H}_s) \odot \frac{1}{1 - diag(\mathbf{H}_s)}, \end{equation}\] where \(\mathbf{e}_p\) are the Pearson residuals and \(diag(\mathbf{H}_s)\) is the diagonal of the spatial hat matrix, \(\mathbf{H}_s \equiv \mathbf{X}^* (\mathbf{X}^{* \top} \mathbf{X}^*)^{-1} \mathbf{X}^{* \top}\) (Montgomery et al. 2021), and \(\odot\) denotes the Hadmard (element-wise) product. The larger the Cook’s distance, the larger the influence.
To better understand the previous form, recall that the the non-spatial linear model \(\mathbf{y} = \mathbf{X} \boldsymbol{\beta} + \boldsymbol{\epsilon}\) assumes elements of \(\boldsymbol{\epsilon}\) are independent and identically distributed (iid) with constant variance. In this context the vector of non-spatial Cook’s distances is given by \[\begin{equation*} \frac{\mathbf{e}_p^2}{p} \odot diag(\mathbf{H}) \odot \frac{1}{1 - diag(\mathbf{H})}, \end{equation*}\] where \(diag(\mathbf{H})\) is the diagonal of the non-spatial hat matrix, \(\mathbf{H} \equiv \mathbf{X} (\mathbf{X}^{\top} \mathbf{X})^{-1} \mathbf{X}^{\top}\). When the elements of \(\boldsymbol{\epsilon}\) are not iid or do not have constant variance or both, the spatial Cook’s distance cannot be calculated using \(\mathbf{H}\). First the linear model must be whitened according to \(\mathbf{y}^* = \mathbf{X}^* \boldsymbol{\beta} + \boldsymbol{\epsilon}^*\), where \(\boldsymbol{\epsilon}^*\) is the whitened version of the sum of all random errors in the model. Then the spatial Cook’s distance follows using \(\mathbf{X}^*\), the whitened version of \(\mathbf{X}\).
deviance()
The deviance of a fitted model is \[\begin{equation*} \mathcal{D}_{\boldsymbol{\Theta}} = 2\ell(\boldsymbol{\Theta}_s) - 2\ell(\boldsymbol{\hat{\Theta}}), \end{equation*}\] where \(\ell(\boldsymbol{\Theta}_s)\) is the log-likelihood of a “saturated” model that fits every observation perfectly. For normal (Gaussian) random errors, \[\begin{equation*} \mathcal{D}_{\boldsymbol{\Theta}} = (\mathbf{y} - \mathbf{X} \hat{\boldsymbol{\beta}})^\top \hat{\boldsymbol{\Sigma}}^{-1} (\mathbf{y} - \mathbf{X} \hat{\boldsymbol{\beta}}) \end{equation*}\]
fitted()
Fitted values can be obtained for the response, spatial random
errors, and random effects. The fitted values for the response
(type = "response"), denoted \(\mathbf{\hat{y}}\), are given by \[\begin{equation*}\label{eq:fit_resp}
\mathbf{\hat{y}} = \mathbf{X} \boldsymbol{\hat{\beta}} .
\end{equation*}\] They are the estimated mean response given the
set of explanatory variables for each observation.
Fitted values for spatial random errors (type = "spcov")
and random effects (type = "randcov") are linked to best
linear unbiased predictors from linear mixed model theory. Consider the
standard random effects parameterization \[\begin{equation*}
\mathbf{y} = \mathbf{X} \boldsymbol{\beta} + \mathbf{Z} \mathbf{u} +
\boldsymbol{\epsilon},
\end{equation*}\] where \(\mathbf{Z}\) denotes the random effects
design matrix, \(\mathbf{u}\) denotes
the random effects, and \(\boldsymbol{\epsilon}\) denotes independent
random error. Henderson (1975) states that
the best linear unbiased predictor (BLUP) of a single random effect
vector \(\mathbf{u}\), denoted \(\mathbf{\hat{u}}\), is given by \[\begin{equation}\label{eq:blup_mm}
\mathbf{\hat{u}} = \sigma^2_u \mathbf{Z}^\top
\mathbf{\Sigma}^{-1}(\mathbf{y} - \mathbf{X} \boldsymbol{\hat{\beta}}),
\end{equation}\] where \(\sigma^2_u\) is the variance of \(\mathbf{u}\).
Searle et al. (2009) generalize this idea by showing that for a random vector \(\boldsymbol{\alpha}\) in a linear model, the best linear unbiased predictor (based on the response, \(\mathbf{y}\)) of \(\boldsymbol{\alpha}\), denoted \(\boldsymbol{\hat{\alpha}}\), is given by \[\begin{equation}\label{eq:blup_gen} \boldsymbol{\hat{\alpha}} = \text{E}(\boldsymbol{\alpha}) + \boldsymbol{\Sigma}_\alpha \boldsymbol{\Sigma}^{-1}(\mathbf{y} - \mathbf{X} \boldsymbol{\hat{\beta}}), \end{equation}\] where \(\boldsymbol{\Sigma}_\alpha = \text{Cov}(\boldsymbol{\alpha}, \mathbf{y})\). Evaluating this equation at the plug-in (empirical) estimates of the covariance parameters yields the empirical best linear unbiased predictor (EBLUP) of \(\boldsymbol{\alpha}\).
Recall that the spatial linear model with random effects is \[\begin{equation*} \mathbf{y} = \mathbf{X} \boldsymbol{\beta} + \mathbf{Z} \mathbf{u} + \boldsymbol{\tau} + \boldsymbol{\epsilon}, \end{equation*}\] Building from previous results, we can find BLUPs for each random term in the spatial linear model (\(\mathbf{u}\), \(\boldsymbol{\tau}\), and \(\boldsymbol{\epsilon}\)). For example, the BLUP of \(\mathbf{u}\) is found by noting that \(\text{E}(\mathbf{u}) = \mathbf{0}\) and \[\begin{equation*} \mathbf{\Sigma}_u = \text{Cov}(\mathbf{u}, \mathbf{y}) = \text{Cov}(\mathbf{u}, \mathbf{X} \boldsymbol{\beta} + \mathbf{Z} \mathbf{u} + \boldsymbol{\tau} + \boldsymbol{\epsilon}) = \text{Cov}(\mathbf{u}, \mathbf{Z}\mathbf{u}) = \text{Cov}(\mathbf{u}, \mathbf{u})\mathbf{Z}^\top = \sigma^2_u \mathbf{Z}^\top, \end{equation*}\] where the result follows because the random terms in \(\mathbf{y}\) are independent and \(\text{Cov}(\mathbf{u}, \mathbf{u}) = \sigma^2_u \mathbf{I}\). Then it follows that \[\begin{equation*} \hat{\mathbf{u}} = \text{E}(\mathbf{u}) + \boldsymbol{\Sigma}_u \boldsymbol{\Sigma}^{-1}(\mathbf{y} - \mathbf{X} \boldsymbol{\hat{\beta}}) = \sigma^2_u \mathbf{Z}^\top \boldsymbol{\Sigma}^{-1}(\mathbf{y} - \mathbf{X} \boldsymbol{\hat{\beta}}), \end{equation*}\] which matches the previous form of the BLUP. Similarly, the BLUP of \(\boldsymbol{\tau}\) is found by noting that \(\text{E}(\boldsymbol{\tau}) = \mathbf{0}\) and \[\begin{equation*} \mathbf{\Sigma}_{de} = \text{Cov}(\boldsymbol{\tau}, \mathbf{y}) = \text{Cov}(\boldsymbol{\tau}, \mathbf{X} \boldsymbol{\beta} + \mathbf{Z} \mathbf{u} + \boldsymbol{\tau} + \boldsymbol{\epsilon}) = \text{Cov}(\boldsymbol{\tau}, \boldsymbol{\tau}) = \sigma^2_{de} \mathbf{R}, \end{equation*}\] where the result follows because the random terms in \(\mathbf{y}\) are independent and \(\text{Cov}(\boldsymbol{\tau}, \boldsymbol{\tau}) = \sigma^2_{de} \mathbf{R}\), and \(\sigma^2_{de}\) is the variance of \(\boldsymbol{\tau}\). Then it follows that \[\begin{equation}\label{eq:blup_sp} \hat{\boldsymbol{\tau}} = \text{E}(\boldsymbol{\tau}) + \boldsymbol{\Sigma}_{de} \boldsymbol{\Sigma}^{-1}(\mathbf{y} - \mathbf{X} \boldsymbol{\hat{\beta}}) = \sigma^2_{de} \mathbf{R} \boldsymbol{\Sigma}^{-1}(\mathbf{y} - \mathbf{X} \boldsymbol{\hat{\beta}}). \end{equation}\] Fitted values for \(\boldsymbol{\epsilon}\) are obtained using similar arguments. Evaluating these equations at the plug-in (empirical) estimates of the covariance parameters yields EBLUPs.
When partition factors are used, the covariance matrix of all random effects (spatial and non-spatial) can be viewed as the interaction between the non-partitioned covariance matrix and the partition matrix, \(\mathbf{P}\). The \(ij\)th entry in \(\mathbf{P}\) equals one if observation \(i\) and observation \(j\) share the same level of the partition factor and zero otherwise. For spatial random effects, an adjustment is straightforward, as each column in \(\boldsymbol{\Sigma}_{de}\) corresponds to a distinct spatial random effect. Thus with partition factors, \(\boldsymbol{\Sigma}_{de}^* = \boldsymbol{\Sigma}_{de} \odot \mathbf{P} = \sigma^2_{de} \mathbf{R} \odot \mathbf{P}\), where \(\odot\) denotes the Hadmart (element-wise) product, is used instead of \(\boldsymbol{\Sigma}_{de}\). Note that \(\boldsymbol{\Sigma}_{ie}\) is unchanged as it is proportional to the identity matrix. For non-spatial random effects, however, the situation is more complicated. Applying the BLUP formula directly yields BLUPs of random effects corresponding to the interaction between random effect levels and partition levels. Thus a logical approach is to average the non-zero BLUPs for each random effect level across partition levels, yielding a prediction for the random effect level. This does not imply, however, that these estimates are BLUPs of the random effect.
For big data without partition factors, the local indexes act as partition factors. That is, the BLUPs correspond to random effects interacted with each local index. For big data with partition factors, an adjusted partition factor is created as the interaction between each local index and the partition factor. Then this adjusted partition factor is applied to yield \(\hat{\boldsymbol{\alpha}}\).
hatvalues()
Hat values measure the leverage of an observation. An observation has high leverage if its combination of explanatory variables is atypical (far from the mean explanatory vector). The spatial leverage (hat) matrix is given by \[\begin{equation} \label{eq:leverage} \mathbf{H}_s = \mathbf{X}^* (\mathbf{X}^{* \top} \mathbf{X}^*)^{-1} \mathbf{X}^{* \top}. \end{equation}\] The diagonal of this matrix yields the leverage (hat) values for each observation (Montgomery et al. 2021). The larger the hat value, the larger the leverage.
To better understand the previous form, recall that the the non-spatial linear model \(\mathbf{y} = \mathbf{X} \boldsymbol{\beta} + \boldsymbol{\epsilon}\) assumes elements of \(\boldsymbol{\epsilon}\) are independent and identically distributed (iid) with constant variance. In this context, the leverage (hat) matrix is given by \[\begin{equation*} \mathbf{H} \equiv \mathbf{X} (\mathbf{X}^{\top} \mathbf{X})^{-1} \mathbf{X}^{\top}, \end{equation*}\] When the elements of \(\boldsymbol{\epsilon}\) are not iid or do not have constant variance or both, the spatial leverage (hat) matrix is not \(\mathbf{H}\). First the linear model must be whitened according to \(\mathbf{y}^* = \mathbf{X}^* \boldsymbol{\beta} + \boldsymbol{\epsilon}^*\), where \(\boldsymbol{\epsilon}^*\) is the whitened version of the sum of all random errors in the model. Then the spatial leverage (hat) matrix follows using \(\mathbf{X}^*\), the whitened version of \(\mathbf{X}\).
loocv()
\(k\)-fold cross validation is a
useful tool for evaluating model fits using “hold-out” data. The data
are split into \(k\) sets. One-by-one,
one of the \(k\) sets is held out, the
model is fit to the remaining \(k - 1\)
sets, and predictions at each observation in the hold-out set are
compared to their true values. The closer the predictions are to the
true observations, the better the model fit. A special case where \(k = n\) is known as leave-one-out cross
validation (loocv), as each observation is left out one-by-one.
Computationally efficient solutions exist for leave-one-out cross
validation in the non-spatial linear model (with iid, constant variance
errors). Outside of this case, however, fitting \(n\) separate models can be computationally
infeasible. loocv() makes a compromise that balances an
approximation to the true solution with computational feasibility. First
\(\boldsymbol{\theta}\) is estimated
using all of the data. Then for each of the \(n\) model fits, loocv() does
not re-estimate \(\boldsymbol{\theta}\)
but does re-estimate \(\boldsymbol{\beta}\). This approach relies
on the assumption that the covariance parameter estimates obtained using
\(n - 1\) observations are
approximately the same as the covariance parameter estimates obtained
using all \(n\) observations. For a
large enough sample size, this is a reasonable assumption.
First define \(\boldsymbol{\Sigma}_{-i, -i}\) as \(\boldsymbol{\Sigma}\) with the \(i\)th row and column deleted, \(\boldsymbol{\Sigma}_{i, -i}\) as the \(i\)th row of \(\boldsymbol{\Sigma}\) with the \(i\)th column deleted, \(\boldsymbol{\Sigma}_{i, i}\) as the \(i\)th diagonal element of \(\boldsymbol{\Sigma}\), \(\mathbf{X}_{-i}\) as \(\mathbf{X}\) with the \(i\)th row deleted, \(\mathbf{X}_{i}\) as the \(i\)th row of \(\mathbf{X}\), \(y_{-i}\) as \(\mathbf{y}\) with the \(i\)th element deleted, and \(\mathbf{y}_i\) as the \(i\)th element of \(\mathbf{y}\). Wolf (1978) shows that given \(\boldsymbol{\Sigma}^{-1}\), a computationally efficient form for \(\boldsymbol{\Sigma}^{-1}_{-i}\) exists. First observe that \(\boldsymbol{\Sigma}^{-1}\) can be represented blockwise as \[\begin{equation*} \boldsymbol{\Sigma}^{-1} = \begin{bmatrix} \tilde{\boldsymbol{\Sigma}}_{-i, -i} & \tilde{\boldsymbol{\Sigma}}_{i,-i}^\top \\ \tilde{\boldsymbol{\Sigma}}_{i,-i} & \tilde{\boldsymbol{\Sigma}}_{i, i} \end{bmatrix}, \end{equation*}\] where the dimensions of each \(\tilde{\boldsymbol{\Sigma}}\) match the respective dimensions of relevant blocks in \(\boldsymbol{\Sigma}\). Then it follows that \[\begin{equation*} \boldsymbol{\Sigma}^{-1}_{-i, -i} = \tilde{\boldsymbol{\Sigma}}_{-i, -i} - \tilde{\boldsymbol{\Sigma}}_{i,-i}^\top \tilde{\boldsymbol{\Sigma}}_{i, i}^{-1}\tilde{\boldsymbol{\Sigma}}_{i,-i} \end{equation*}\] and \[\begin{equation*} \boldsymbol{\beta}_{-i} = (\mathbf{X}^\top_{-i} \boldsymbol{\Sigma}^{-1}_{-i, -i} \mathbf{X}_{-i})^{-1} \mathbf{X}^\top_{-i} \boldsymbol{\Sigma}^{-1}_{-i, -i} \mathbf{y}_{-i}, \end{equation*}\] where \(\boldsymbol{\beta}_i\) is the estimate of \(\boldsymbol{\beta}\) constructed without the \(i\)th observation.
The loocv prediction of \(y_i\) is then given by \[\begin{equation*} \hat{y}_i = \mathbf{X}_i \hat{\boldsymbol{\beta}}_{-i} + \hat{\boldsymbol{\Sigma}}_{i, -i}\hat{\boldsymbol{\Sigma}}_{-i, -i}(\mathbf{y}_i - \mathbf{X}_{-i} \hat{\boldsymbol{\beta}}_{-i}) \end{equation*}\] and the prediction variance of the loocv prediction of \(y_i\) is given by \[\begin{equation*} \dot{\sigma}^2_i = \hat{\boldsymbol{\Sigma}}_{i, i} - \hat{\boldsymbol{\Sigma}}_{i, - i} \hat{\boldsymbol{\Sigma}}^{-1}_{-i, -i} \hat{\boldsymbol{\Sigma}}_{i, - i}^\top + \mathbf{Q}_i(\mathbf{X}_{-i}^\top \hat{\boldsymbol{\Sigma}}_{-i, -i}^{-1} \mathbf{X}_{-i})^{-1}\mathbf{Q}_i^\top , \end{equation*}\] where \(\mathbf{Q}_i = \mathbf{X}_i - \hat{\boldsymbol{\Sigma}}_{i, -i} \hat{\boldsymbol{\Sigma}}^{-1}_{-i, -i} \mathbf{X}_{-i}\). These formulas are analogous to the formulas used to obtain linear unbiased predictions of unobserved data and prediction variances. Model fits are evaluated using several statistics: bias, mean-squared-prediction error (MSPE), root-mean-squared-prediction error (RMSPE), and the squared correlation (cor2) between the observed data and leave-one-out predictions (regarded as a prediction version of r-squared appropriate for comparing across spatial and nonspatial models).
Bias is formally defined as \[\begin{equation*} bias = \frac{1}{n}\sum_{i = 1}^n(y_i - \hat{y}_i). \end{equation*}\]
MSPE is formally defined as \[\begin{equation*} MSPE = \frac{1}{n}\sum_{i = 1}^n(y_i - \hat{y}_i)^2. \end{equation*}\]
RMSPE is formally defined as \[\begin{equation*} RMSPE = \sqrt{\frac{1}{n}\sum_{i = 1}^n(y_i - \hat{y}_i)^2}. \end{equation*}\]
cor2 is formally defined as \[\begin{equation*} cor2 = \text{Cor}(\mathbf{y}, \hat{\mathbf{y}})^2, \end{equation*}\] where Cor\((\cdot)\) is the correlation function. cor2 is only returned for spatial linear models, as it is not applicable for spatial generalized linear models (we are predicting a latent mean parameter, which is unknown and not on the same scale as the original data).
Generally, bias should be near zero for well-fitting models. The lower the MSPE and RMSPE, the better the model fit. The higher the cor2, the better the model fit.
Big Data
Options for big data leave-one-out cross validation rely on the
local argument, which is passed to predict().
The local list for predict() is explained in
detail in the predict() section, but we provide a short
summary of how local interacts with loocv()
here.
For splm() and spautor() objects, the
local method can be "all". When the
local method is"all", all of the data are used
for leave-one-out cross validation (i.e., it is implemented exactly as
previously described). Parallelization is implemented when setting
parallel = TRUE in local, and the number of
cores to use for parallelization is specified via
ncores.
For splm() objects, additional options for the
local method are "covariance" and
"distance". When the local method is
"covariance", then a number of observations (specified via
the size argument) having the highest covariance with the
held-out observation are used in the local neighborhood prediction
approach. When the local method is "distance",
then a number of observations (specified via the size
argument) closest to the held-out observation are used in the local
neighborhood prediction approach. When no random effects are used, no
partition factor is used, and the spatial covariance function is
monotone decreasing, "covariance" and
"distance" are equivalent. The local neighborhood approach
only uses the observations in the local neighborhood of the held-out
observation to perform prediction, and is thus an approximation to the
true solution. Its computational efficiency derives from using \(\boldsymbol{\Sigma}_{l, l}\) (the
covariance matrix of the observations in the local neighborhood) instead
of \(\boldsymbol{\Sigma}\) (the
covariance matrix of all the observations). Parallelization is
implemented when setting parallel = TRUE in
local, and the number of cores to use for parallelization
is specified via ncores.
predict()
interval = "none"
The empirical best linear unbiased predictions (i.e., empirical Kriging predictor) of \(\mathbf{y}_u\) are given by \[\begin{equation}\label{eq:blup} \mathbf{\dot{y}}_u = \mathbf{X}_u \hat{\boldsymbol{\beta}} + \hat{\boldsymbol{\Sigma}}_{uo} \hat{\boldsymbol{\Sigma}}^{-1}_{o} (\mathbf{y}_o - \mathbf{X}_o \hat{\boldsymbol{\beta}}) . \end{equation}\]
This equation sometimes called an empirical universal Kriging predictor, a Kriging with external drift predictor, or a regression Kriging predictor.
The covariance matrix of \(\mathbf{\dot{y}}_u\) \[\begin{equation}\label{eq:blup_cov} \dot{\boldsymbol{\Sigma}}_u = \hat{\boldsymbol{\Sigma}}_u - \hat{\boldsymbol{\Sigma}}_{uo} \hat{\boldsymbol{\Sigma}}^{-1}_o \hat{\boldsymbol{\Sigma}}^\top_{uo} + \mathbf{Q}(\mathbf{X}_o^\top \hat{\boldsymbol{\Sigma}}_o^{-1} \mathbf{X}_o)^{-1}\mathbf{Q}^\top , \end{equation}\] where \(\mathbf{Q} = \mathbf{X}_u - \hat{\boldsymbol{\Sigma}}_{uo} \hat{\boldsymbol{\Sigma}}^{-1}_o \mathbf{X}_o\).
When se.fit = TRUE, standard errors are returned by
taking the square root of the diagonal of \(\dot{\boldsymbol{\Sigma}}_u\).
interval = "prediction"
The empirical best linear unbiased predictions are returned as \(\mathbf{\dot{y}}_u\). The (100 \(\times\) level)% prediction
interval for \((y_u)_i\) is \((\dot{y}_u)_i \pm z^*
\sqrt{(\dot{\boldsymbol{\Sigma}}_u)_{i, i}}\), where \(\sqrt{(\dot{\boldsymbol{\Sigma}}_u)_{i,
i}}\) is the standard error of \((\dot{y}_u)_i\) obtained from
se.fit = TRUE, \(\Phi(z^*) = 1 -
\alpha / 2\), \(\Phi(\cdot)\) is
the standard normal (Gaussian) cumulative distribution function, \(\alpha = 1 -\) level, and
level is an argument to predict(). The default
for level is 0.95, which corresponds to a \(z^*\) of approximately 1.96.
interval = "confidence"
The best linear unbiased estimates of \(\text{E}[(y_u)_i]\) (\(\text{E}(\cdot)\) denotes expectation) are
returned by evaluating \((\mathbf{X}_u)_i
\hat{\boldsymbol{\beta}}\), where \((\mathbf{X}_u)_i\) is the \(i\)th row of \(\mathbf{X}_u\) (i.e., fitted values
corresponding to \((\mathbf{X}_u)_i\)
are returned). The (100 \(\times\)
level)% confidence interval for \(\text{E}[(y_u)_i]\) is \((\mathbf{X}_u)_i \hat{\boldsymbol{\beta}} \pm z^*
\sqrt{(\mathbf{X}_u)_i (\mathbf{X}^\top_o
\hat{\boldsymbol{\Sigma}}_o^{-1} \mathbf{X}_o)^{-1}
(\mathbf{X}_u)_i^\top}\) where \(\sqrt{(\mathbf{X}_u)_i (\mathbf{X}^\top_o
\hat{\boldsymbol{\Sigma}}_o^{-1} \mathbf{X}_o)^{-1}
(\mathbf{X}_u)_i^\top}\) is the standard error of \((\dot{y}_u)_i\) obtained from
se.fit = TRUE, \(\Phi(z^*) = 1 -
\alpha / 2\), \(\Phi(\cdot)\) is
the standard normal (Gaussian) cumulative distribution function, \(\alpha = 1 -\) level, and
level is an argument to predict(). The default
for level is 0.95, which corresponds to a \(z^*\) of approximately 1.96.
spautor() extra steps
For spatial autoregressive models, an extra step is required to obtain \(\hat{\boldsymbol{\Sigma}}^{-1}_o\), \(\hat{\boldsymbol{\Sigma}}_u\), and \(\hat{\boldsymbol{\Sigma}}_{uo}\) as they depend on one another through the neighborhood structure of \(\mathbf{y}_o\) and \(\mathbf{y}_u\). Recall that for autoregressive models, it is \(\boldsymbol{\Sigma}^{-1}\) that is straightforward to obtain, not \(\boldsymbol{\Sigma}\).
Let \(\boldsymbol{\Sigma}^{-1}\) be the inverse covariance matrix of the observed and unobserved data, \(\mathbf{y}_o\) and \(\mathbf{y}_u\). One approach to obtain \(\boldsymbol{\Sigma}_o\) and \(\boldsymbol{\Sigma}_{uo}\) is to directly invert \(\boldsymbol{\Sigma}^{-1}\) and then subset \(\boldsymbol{\Sigma}\) appropriately. This inversion can be prohibitive when \(n_o + n_u\) is large. A faster way to obtain \(\boldsymbol{\Sigma}_o\) and \(\boldsymbol{\Sigma}_{uo}\) exists. Represent \(\boldsymbol{\Sigma}^{-1}\) blockwise as \[\begin{equation*}\label{eq:auto_hw} \boldsymbol{\Sigma}^{-1} = \begin{bmatrix} \tilde{\boldsymbol{\Sigma}}_{o} & \tilde{\boldsymbol{\Sigma}}^{\top}_{uo} \\ \tilde{\boldsymbol{\Sigma}}_{uo} & \tilde{\boldsymbol{\Sigma}}_{u} \end{bmatrix}, \end{equation*}\] where the dimensions of the blocks match the relevant dimensions of \(\boldsymbol{\Sigma}\). All of the terms required for prediction can be obtained from this block representation. Wolf (1978) shows that \[\begin{equation*}\label{eq:hw_forms} \begin{split} \boldsymbol{\Sigma}^{-1}_o & = \tilde{\boldsymbol{\Sigma}}_{o} - \tilde{\boldsymbol{\Sigma}}^{ \top}_{uo} (\tilde{\boldsymbol{\Sigma}}_{u})^{-1} \tilde{\boldsymbol{\Sigma}}_{uo} \\ \boldsymbol{\Sigma}_u & = (\tilde{\boldsymbol{\Sigma}}_{u} - \tilde{\boldsymbol{\Sigma}}_{uo} (\tilde{\boldsymbol{\Sigma}}_{o})^{-1} \tilde{\boldsymbol{\Sigma}}^\top_{uo})^{-1} \\ \boldsymbol{\Sigma}_{uo} & = - \boldsymbol{\Sigma}_u \tilde{\boldsymbol{\Sigma}}_{uo} \tilde{\boldsymbol{\Sigma}}^{-1}_{o} \end{split} \end{equation*}\] Evaluating these expressions at \(\hat{\boldsymbol{\theta}}\) yields \(\hat{\boldsymbol{\Sigma}}^{-1}_o\), and \(\hat{\boldsymbol{\Sigma}}_u\), and \(\hat{\boldsymbol{\Sigma}}_{uo}\).
A similar result exists for the log determinant of \(\boldsymbol{\Sigma}_o\), which is not required for prediction but is required for restricted maximum likelihood and maximum likelihood estimation.
Big Data
When the number of observations in the fitted model (observed data)
are large or there are many locations to predict or both, it is often
necessary to implement computationally efficient big data
approximations. Big data approximations are implemented in
spmodel using the local argument to
predict(). When the local method is
"all", all of the fitted model data are used to make
predictions. In this context, computational efficiency is only gained by
parallelizing each prediction. The only available local
method for spautor() fitted models is "all".
This is because the neighborhood structure of spautor()
fitted models does not permit the subsetting used by the
"covariance" and "distance" methods that we
discuss next.
When the local method is "covariance",
\(\hat{\boldsymbol{\Sigma}}_{uo}\) is
computed between the observation being predicted (\(\mathbf{y}_u\)) and the rest of the
observed data. This vector is then ordered and a number of observations
(specified via the size argument) having the highest
covariance with \(\mathbf{y}_u\) are
subset, yielding \(\check{\boldsymbol{\Sigma}}_{uo}\), which
has dimension \(1 \times size\). Then
similarly \(\hat{\boldsymbol{\Sigma}}_o\), \(\mathbf{y}_o\), and \(\mathbf{X}_u\) are also subset by these
size observations, yielding \(\check{\boldsymbol{\Sigma}}_{o}\), \(\check{\mathbf{y}}_o\), and \(\check{\mathbf{X}}_u\), respectively. The
previous prediction equations can be evaluated at \(\check{\boldsymbol{\Sigma}}_{uo}\), \(\check{\boldsymbol{\Sigma}}_{o}\), \(\check{\mathbf{y}}_o\), and \(\check{\mathbf{X}}_u\) (except for the
quantity \((\mathbf{X}_o^\top
\hat{\boldsymbol{\Sigma}}_o^{-1} \mathbf{X}_o)^{-1}\), which is
evaluated using all the observed data) to yield predictions and standard
errors. When the local method is "distance", a
similar approach is used except a number of observations (specified via
the size argument) closest (in terms of Euclidean distance)
to \(\mathbf{y}_u\) are subset instead.
When random effects are not used, partition factors are not used, and
the spatial covariance function is monotone decreasing,
"covariance" and "distance" are equivalent.
This approach of subsetting the observed data by the set of locations
closest in covariance or proximity to \(\mathbf{y}_u\) is known as the local
neighborhood approach. As long as size is relatively small
(the default is 100), the local neighborhood approach is very
computationally efficient, mainly because \(\check{\boldsymbol{\Sigma}}_{o}^{-1}\) is
easy to compute. Additional computational efficiency is gained by
parallelizing each prediction.
Block Prediction
Rather than making predictions at point-referenced locations, Block
Prediction (i.e., Block Kriging) is a technique used to predict an
average (or total) in some region (i.e., spatial domain). When
interval = "none" or interval = "prediction",
the (empirical) Block Prediction (BP) is given by \[\begin{equation}\label{eq:bp_pred}
\mathbf{\dot{y}}_B = \mathbf{X}_{B} \hat{\boldsymbol{\beta}} +
\hat{\boldsymbol{\Sigma}}_{B} \hat{\boldsymbol{\Sigma}}^{-1}_{o}
(\mathbf{y}_o - \mathbf{X}_o \hat{\boldsymbol{\beta}}).
\end{equation}\] The quantity \(\mathbf{X}_{B} = [\mathbf{x}_{1, B},
\mathbf{x}_{2, B}, ... , \mathbf{x}_{k, B}]^\top\) where \(j = 1, 2, ..., k\) indexes the columns of
\(\mathbf{X}_{B}\) and \(\mathbf{x}_{j, B} = \frac{1}{|B|}\int_B
\mathbf{x}_j d\mathbf{s}\) for the \(\mathbf{s}\) points in the region. The
total area (volume) of the region is \(|B|\) . The quantity \(\hat{\boldsymbol{\Sigma}}_{B} =
[\hat{\boldsymbol{\Sigma}}_1, \hat{\boldsymbol{\Sigma}}_2, ... ,
\hat{\boldsymbol{\Sigma}}_n]^\top\) where \(i = 1, 2, ... , n\) indexes each element in
\(\mathbf{y}_o\) and \(\hat{\boldsymbol{\Sigma}}_i = \frac{1}{|B|}\int_B
\text{Cov}(\mathbf{y}_B, \text{y}_i) d\mathbf{s}\). The quantity
\(\text{Cov}(\mathbf{y}_B,
\text{y}_i)\) represents the covariance between \(\text{y}_i\) and all other points in the
region. In practice, the Block Prediction integrals are approximated
using summation on a fine grid of \(G\)
points, similar to other numerical integration techniques. That is,
\(\mathbf{x}_{j, B} \approx
\frac{1}{|B|}\sum_{g = 1}^G \mathbf{x}_g\) and similarly for
\(\hat{\boldsymbol{\Sigma}}_i\), where
\(g\) indexes the points on the fine
grid. Intuitively, these summations approximate average values in the
entire region.
When interval = "prediction", the (100 \(\times\) level)% prediction
interval for \(\mathbf{\dot{y}}_B\) is
\(\mathbf{\dot{y}}_B \pm z^*
\sqrt{\sigma^2_B}\), where \(\sigma^2_B
= \sigma^{2*}_B - \hat{\boldsymbol{\Sigma}}_{B}
\hat{\boldsymbol{\Sigma}}^{-1}_{o}\hat{\boldsymbol{\Sigma}}_{B}^\top +
\mathbf{Q}_B (\mathbf{X}_o^\top \hat{\boldsymbol{\Sigma}}_o^{-1}
\mathbf{X}_o)^{-1} \mathbf{Q}_B^\top\). The quantity \(\sigma^{2*}_B = \frac{1}{|B|^2}\int_B \int_B
\text{Cov}(\text{y}_\mathbf{s}, \text{y}_\mathbf{u})
d\mathbf{s}d\mathbf{u}\), where \(\mathbf{s}\) and \(\mathbf{u}\) represent points in the region
(the product of \(\mathbf{s}\) and
\(\mathbf{u}\) contains all possible
pairs of points in the region). Intuitively, \(\sigma^{2*}_B\) approximates the average
covariance between any two points in the region though summation over
the fine grid. That is, \(\sigma^{2*}_B
\approx \frac{1}{|B|^2}\sum_{g_i = 1}^G \sum_{g_j = 1}^G
\text{Cov}(\text{y}_{g_i}, \text{y}_{g_j})\). The quantity \(\mathbf{Q}_B = \mathbf{X}_B -
\hat{\boldsymbol{\Sigma}}_B \hat{\boldsymbol{\Sigma}}^{-1}_o
\mathbf{X}_o\).
When interval = "confidence", the average process mean
(i.e., not the realized mean) and uncertainties are returned from the
underlying model. The (process) mean estimate is \(\mathbf{X}_{B} \hat{\boldsymbol{\beta}}\)
and a (100 \(\times\)
level)% confidence interval is \(\mathbf{X}_{B} \hat{\boldsymbol{\beta}} \pm z^*
\sqrt{\mathbf{X}_{B} (\mathbf{X}^\top_o \hat{\boldsymbol{\Sigma}}_o^{-1}
\mathbf{X}_o)^{-1} \mathbf{X}_{B}^\top}\).
For Big Data, when local = TRUE, the same approach is
applied as for point prediction but adjusted slightly to accommodate the
averaging necessary for Block Prediction. Thus, when
method = "covariance" (the default), the size
observations of \(\mathbf{y}_o\) having
the highest average covariance with elements of the fine grid are used
to find the subsets \(\check{\mathbf{X}}_o\), \(\check{\boldsymbol{\Sigma}}_o\), and \(\check{\mathbf{y}}_o\). When
method = "distance", the size observations of
of \(\mathbf{y}_o\) having the smallest
average distance to elements of the fine grid are used to find the
subsets \(\check{\mathbf{X}}_o\), \(\check{\boldsymbol{\Sigma}}_o\), and \(\check{\mathbf{y}}_o\). Recall that these
two methods are equivalent for processes without anisotropy, random
effects, or partition factors, but can differ otherwise. The default is
size = 1000, which is much larger than for point
prediction. This is because for Block Prediction, the Cholesky
decomposition of \(\check{\boldsymbol{\Sigma}}_o\) needs to
only be computed once (rather than separately for each \(\check{\boldsymbol{\Sigma}}_o\) associated
with each prediction location, as for point prediction).
Currently, the fine grid used to obtain Block Predictions is supplied
by the user via newdata. For an overview of Block
Prediction, see Cressie (1993). For
applications to a finite population (i.e., a region with a finite number
of point locations), see Ver Hoef (2008)
and Dumelle et al. (2022).
splmRF() and spautorRF()
Random forest spatial residual model predictions are obtained by combining random forest predictions and spatial linear model predictions (i.e., Kriging) of the random forest residuals. Formally, the random forest spatial residual model predictions of \(\mathbf{y}_u\) are given by \[\begin{equation*} \mathbf{\dot{y}}_u = \mathbf{\dot{y}}_{u, rf} + \mathbf{\dot{e}}_{u, slm}, \end{equation*}\] where \(\mathbf{\dot{y}}_{u, rf}\) are the random forest predictions for \(\mathbf{y}_u\) and \(\mathbf{\dot{e}}_{u, slm}\) are the spatial linear model predictions of the random forest residuals for \(\mathbf{y}_u\). This process of obtaining predictions is sometimes analogously called random forest regression Kriging (Fox et al. 2020).
Uncertainty quantification in a random forest context has been
studied (Meinshausen and Ridgeway 2006)
but is not currently available in spmodel. Big data are
accommodated by supplying the local argument to
predict().
pseudoR2()
The pseudo R-squared is a generalization of the classical R-squared from non-spatial linear models. Like the classical R-squared, the pseudo R-squared measures the proportion of variability in the response explained by the fixed effects in the fitted model. Unlike the classical R-squared, the pseudo R-squared can be applied to models whose errors do not satisfy the iid and constant variance assumption. The pseudo R-squared is given by \[\begin{equation*} PR2 = 1 - \frac{\mathcal{D}(\boldsymbol{\hat{\Theta}})}{\mathcal{D}(\boldsymbol{\hat{\Theta}}_0)}. \end{equation*}\] For normal (Gaussian) random errors, the pseudo R-squared is \[\begin{equation*} PR2 = 1 - \frac{(\mathbf{y} - \mathbf{X} \hat{\boldsymbol{\beta}})^\top \hat{\boldsymbol{\Sigma}}^{-1}(\mathbf{y} - \mathbf{X} \hat{\boldsymbol{\beta}})}{(\mathbf{y} - \hat{\mu})^\top \hat{\boldsymbol{\Sigma}}^{-1}(\mathbf{y} - \hat{\mu})}, \end{equation*}\] where \(\hat{\mu} = (\boldsymbol{1}^\top \hat{\boldsymbol{\Sigma}}^{-1} \boldsymbol{1})^{-1} \boldsymbol{1}^\top \hat{\boldsymbol{\Sigma}}^{-1} \mathbf{y}\). For the non-spatial model, the pseudo R-squared reduces to the classical R-squared, as \[\begin{equation*} PR2 = 1 - \frac{(\mathbf{y} - \mathbf{X} \hat{\boldsymbol{\beta}})^\top \hat{\boldsymbol{\Sigma}}^{-1}(\mathbf{y} - \mathbf{X} \hat{\boldsymbol{\beta}})}{(\mathbf{y} - \hat{\mu})^\top \hat{\boldsymbol{\Sigma}}^{-1}(\mathbf{y} - \hat{\mu})} = 1 - \frac{(\mathbf{y} - \mathbf{X} \hat{\boldsymbol{\beta}})^\top (\mathbf{y} - \mathbf{X} \hat{\boldsymbol{\beta}})}{(\mathbf{y} - \hat{\mu})^\top (\mathbf{y} - \hat{\mu})} = 1 - \frac{\text{SSE}}{\text{SST}} = R2, \end{equation*}\] where SSE denotes the error sum of squares and SST denotes the total sum of squares. The result follows because for a non-spatial model, \(\boldsymbol{\Sigma}\) is proportional to the identity matrix.
The adjusted pseudo r-squared adjusts for additional explanatory variables and is given by \[\begin{equation*} PR2adj = 1 - (1 - PR2)\frac{n - 1}{n - p}. \end{equation*}\] If the fitted model does not have an intercept, the \(n - 1\) term is instead \(n\).
residuals()
Terminology regarding residual names is often conflicting and
confusing. Because of this, we explicitly define the residual options we
use in spmodel. These definitions may be different from
others you have seen in the literature.
When type = "response", response residuals are returned:
\[\begin{equation*}
\mathbf{e}_{r} = \mathbf{y} - \mathbf{X} \hat{\boldsymbol{\beta}}.
\end{equation*}\]
When type = "pearson", Pearson residuals are returned:
\[\begin{equation*}
\mathbf{e}_{p} = \hat{\boldsymbol{\Sigma}}^{-1/2}\mathbf{e}_{r},
\end{equation*}\] If the errors are normal (Gaussian), the
Pearson residuals should be approximately normally distributed with mean
zero and variance one. The result follows when \(\hat{\boldsymbol{\Sigma}}^{-1/2} \approx
\boldsymbol{\Sigma}^{-1/2}\) because \[\begin{equation*}
\text{E}(\boldsymbol{\Sigma}^{-1/2} \mathbf{e}_{r}) =
\boldsymbol{\Sigma}^{-1/2} \text{E}(\mathbf{e}_{r}) =
\boldsymbol{\Sigma}^{-1/2} \boldsymbol{0} = \boldsymbol{0}
\end{equation*}\] and \[\begin{equation*}
\begin{split}
\text{Cov}(\boldsymbol{\Sigma}^{-1/2} \mathbf{e}_{r}) & =
\boldsymbol{\Sigma}^{-1/2} \text{Cov}(\mathbf{e}_{r})
\boldsymbol{\Sigma}^{-1/2} \\
& \approx \boldsymbol{\Sigma}^{-1/2} \boldsymbol{\Sigma}
\boldsymbol{\Sigma}^{-1/2} \\
& = (\boldsymbol{\Sigma}^{-1/2}
\boldsymbol{\Sigma}^{1/2})(\boldsymbol{\Sigma}^{1/2}
\boldsymbol{\Sigma}^{-1/2}) \\
& = \mathbf{I}
\end{split}
\end{equation*}\]
When type = "standardized", standardized residuals are
returned: \[\begin{equation*}
\mathbf{e}_{s} = \mathbf{e}_{p} \odot \frac{1}{\sqrt{1 -
diag(\mathbf{H}^*)}},
\end{equation*}\] where \(diag(\mathbf{H}^*)\) is the diagonal of the
spatial hat matrix, \(\mathbf{H}_s \equiv
\mathbf{X}^* (\mathbf{X}^{* \top} \mathbf{X}^*)^{-1} \mathbf{X}^{*
\top}\), and \(\odot\) denotes
the Hadmard (element-wise) product. This residual transformation
“standardizes” the Pearson residuals. As such, the standardized
residuals should also have mean zero and variance \[\begin{equation*}
\begin{split}
\text{Cov}(\mathbf{e}_{s}) & = \text{Cov}((\mathbf{I} -
\mathbf{H}^*) \hat{\boldsymbol{\Sigma}}^{-1/2}\mathbf{y}) \\
& \approx \text{Cov}((\mathbf{I} - \mathbf{H}^*)
\boldsymbol{\Sigma}^{-1/2}\mathbf{y}) \\
& = (\mathbf{I} - \mathbf{H}^*) \boldsymbol{\Sigma}^{-1/2}
\text{Cov}(\mathbf{y}) \boldsymbol{\Sigma}^{-1/2}(\mathbf{I} -
\mathbf{H}^*)^\top \\
& = (\mathbf{I} - \mathbf{H}^*) \boldsymbol{\Sigma}^{-1/2}
\boldsymbol{\Sigma} \boldsymbol{\Sigma}^{-1/2}(\mathbf{I} -
\mathbf{H}^*)^\top \\
& = (\mathbf{I} - \mathbf{H}^*) \mathbf{I} (\mathbf{I} -
\mathbf{H}^*)^\top \\
& = (\mathbf{I} - \mathbf{H}^*),
\end{split}
\end{equation*}\] because \((\mathbf{I}
- \mathbf{H}^*)\) is symmetric and idempotent. Note that the
average value of \(diag(\mathbf{H}^*)\)
is \(p / n\), so \((\mathbf{I} - \mathbf{H}^*) \approx
\mathbf{I}\) for large sample sizes.
spautor() and splm()
Next we discuss technical details for the spautor() and
splm() functions. Many of the details for the two functions
are the same, though occasional differences are noted in the following
subsection headers. Specifically, spautor() and
splm() are for different data types and use different
covariance functions. spautor() is for spatial linear
models with areal data (i.e., spatial autoregressive models) and
splm() is for spatial linear models with point-referenced
data (i.e., geostatistical models). There are also a few features
splm() has that spautor() does not:
semivariogram-based estimation, random effects, anisotropy, and big data
approximations.
spautor() Spatial Covariance Functions
For areal data, the covariance matrix depends on the specification of
a neighborhood structure among the observations. Observations with at
least one neighbor (not including itself) are called “connected”
observations. Observations with no neighbors are called “unconnected”
observations. The autoregressive spatial covariance matrix can be
defined as \[\begin{equation*}
\boldsymbol{\Sigma} =
\begin{bmatrix}
\sigma^2_{de} \mathbf{R} & \mathbf{0} \\
\mathbf{0} & \sigma^2_{\xi} \mathbf{I}
\end{bmatrix}
+ \sigma^2_{ie} \mathbf{I},
\end{equation*}\] where \(\sigma^2_{de}\) \((\geq 0)\) is the spatially dependent
(correlated) variance for the connected observations, \(\mathbf{R}\) is a matrix that describes the
spatial dependence for the connected observations, \(\sigma^2_{\xi}\) \((\geq 0)\) is the independent (not
correlated) variance for the unconnected observations, and \(\sigma^2_{ie}\) \((\geq 0)\) is the independent (not
correlated) variance for all observations. As seen, the connected and
unconnected observations are allowed different variances. The total
variance for connected observations is then \(\sigma^2_{de} + \sigma^2_{ie}\) and the
total variance for unconnected observations is \(\sigma^2_{\xi} + \sigma^2_{ie}\).
spmodel accommodates two spatial covariances: conditional
autoregressive (CAR) and simultaneous autoregressive (SAR), both of
which have their \(\mathbf{R}\) forms
provided in the following table.
| Spatial covariance type | \(\mathbf{R}\) functional form |
|---|---|
"car" |
\((\mathbf{I} - \phi\mathbf{W})^{-1}\mathbf{M}\) |
"sar" |
\([(\mathbf{I} - \phi\mathbf{W})(\mathbf{I} - \phi\mathbf{W})^\top]^{-1}\) |
For both CAR and SAR covariance functions, \(\mathbf{R}\) depends on similar quantities: \(\mathbf{I}\), an identity matrix; \(\phi\), a range parameter, and \(\mathbf{W}\), a matrix that defines the neighborhood structure. Often \(\mathbf{W}\) is symmetric but it need not be. Valid values for \(\phi\) are in \((1 / \lambda_{min}, 1 / \lambda_{max})\), where \(\lambda_{min}\) is the minimum eigenvalue of \(\mathbf{W}\) and \(\lambda_{max}\) is the maximum eigenvalue of \(\mathbf{W}\) (Ver Hoef et al. 2018). For SAR covariance functions, \(\lambda_{min}\) must be negative and \(\lambda_{max}\) must be positive. For CAR covariances functions, a matrix \(\mathbf{M}\) matrix must be provided that satisfies the CAR symmetry condition, which enforces the symmetry of the covariance matrix. The CAR symmetry condition states \[\begin{equation*} \frac{\mathbf{W}_{ij}}{\mathbf{M}_{ii}} = \frac{\mathbf{W}_{ji}}{\mathbf{M}_{jj}} \end{equation*}\] for all \(i\) and \(j\), where \(i\) and \(j\) index rows or columns. When \(\mathbf{W}\) is symmetric, \(\mathbf{M}\) is often taken to be the identity matrix.
The default in spmodel is to row-standardize \(\mathbf{W}\) by dividing each element by
its respective row sum, which decreases variance. If row-standardization
is not used for a CAR model, the default in spmodel for
\(\mathbf{M}\) is the identity
matrix.
splm() Spatial Covariance Functions
For point-referenced data, the spatial covariance is given by \[\begin{equation*}
\sigma^2_{de}\mathbf{R} + \sigma^2_{ie} \mathbf{I},
\end{equation*}\] where \(\sigma^2_{de}\) \((\geq 0)\) is the spatially dependent
(correlated) variance, \(\mathbf{R}\)
is a spatial correlation matrix, \(\sigma^2_{ie}\) \((\geq 0)\) is the spatially independent
(not correlated) variance, and \(\mathbf{I}\) is an identity matrix. The
\(\mathbf{R}\) matrix always depends on
a range parameter, \(\phi\) \((> 0)\), that controls the behavior of
the covariance function with distance. For some covariance functions,
the \(\mathbf{R}\) matrix depends on an
additional parameter that we call the “extra” parameter. The following
table shows the parametric form for all \(\mathbf{R}\) matrices available in
splm(). The range parameter is denoted as \(\phi\), the distance is denoted as \(h\), the distance divided by the range
parameter (\(h / \phi\)) is denoted as
\(\eta\), \(\mathcal{I}\{\cdot\}\) is an indicator
function equal to one when the argument occurs and zero otherwise, and
the extra parameter is denoted as \(\xi\) (when relevant).
| Spatial Covariance Type | R Functional Form |
|---|---|
"exponential" |
\(e^{-\eta}\) |
"spherical" |
\((1 - 1.5\eta + 0.5\eta^3)\mathcal{I}\{h \leq \phi \}\) |
"gaussian" |
\(e^{-\eta^2}\) |
"triangular" |
\((1 - \eta)\mathcal{I}\{h \leq \phi \}\) |
"circular" |
\((1 - \frac{2}{\pi}[m\sqrt{1 - m^2} + sin^{-1}\{m\}])\mathcal{I}\{h \leq \phi \}, m = min(\eta, 1)\) |
"cubic" |
\((1 - 7\eta^2 + 8.75\eta^3 - 3.5\eta^5 + 0.75 \eta^7)\mathcal{I}\{h \leq \phi \}\) \ |
"pentaspherical" |
\((1 - 1.875\eta + 1.250\eta^3 - 0.375\eta^5)\mathcal{I}\{h \leq \phi \}\) \ |
"cosine" |
$ cos() $ |
"wave" |
\(\frac{sin(\eta)}{\eta}\mathcal{I}\{h > 0 \} + \mathcal{I}\{h = 0 \}\) |
"jbessel" |
\(B_j(h\phi), B_j\) is Bessel-J |
"gravity" |
\((1 + \eta^2)^{-1/2}\) |
"rquad" |
\((1 + \eta^2)^{-1}\) |
"magnetic" |
\((1 + \eta^2)^{-3/2}\) |
"matern" |
\(\frac{2^{(1 - \xi)}}{\Gamma(\xi)} \alpha^\xi B_k(\alpha, \xi), \alpha = \sqrt{2\xi \eta}, B_k\) is Bessel-K with order \(\xi\), \(\xi \in [1/5, 5]\) |
"cauchy" |
\((1 + \eta^2)^{-\xi}\), \(\xi > 0\) |
"pexponential" |
\(exp(-h^\xi / \phi)\), \(\xi \in (0, 2]\) |
"none" |
\(0\) |
"ie" |
\(0\) |
Model-fitting
Likelihood-based Estimation (estmethod = "reml" or
estmethod = "ml")
Minus twice a profiled (by \(\boldsymbol{\beta}\)) Gaussian log-likelihood is given by \[\begin{equation}\label{eq:ml-lik} -2\ell_p(\boldsymbol{\theta}) = \ln{|\boldsymbol{\Sigma}|} + (\mathbf{y} - \mathbf{X} \tilde{\boldsymbol{\beta}})^\top \boldsymbol{\Sigma}^{-1} (\mathbf{y} - \mathbf{X} \tilde{\boldsymbol{\beta}}) + n \ln{2\pi}, \end{equation}\] where \(\tilde{\boldsymbol{\beta}} = (\mathbf{X}^\top \mathbf{\Sigma}^{-1} \mathbf{X})^{-1} \mathbf{X}^\top \mathbf{\Sigma}^{-1} \mathbf{y}\). Minimizing this equation yields \(\boldsymbol{\hat{\theta}}_{ml}\), the maximum likelihood estimates for \(\boldsymbol{\theta}\). Then a closed form solution exists for \(\boldsymbol{\hat{\beta}}_{ml}\), the maximum likelihood estimates for \(\boldsymbol{\beta}\): \(\boldsymbol{\hat{\beta}}_{ml} = \tilde{\boldsymbol{\beta}}_{ml}\), where \(\tilde{\boldsymbol{\beta}}_{ml}\) is \(\tilde{\boldsymbol{\beta}}\) evaluated at \(\boldsymbol{\hat{\theta}}_{ml}\). To reduce bias in that variances of \(\boldsymbol{\hat{\beta}}_{ml}\) that can occur due to the simultaneous estimation of \(\boldsymbol{\beta}\) and \(\boldsymbol{\theta}\), restricted maximum likelihood estimation (REML) (Patterson and Thompson 1971; Harville 1977; Wolfinger et al. 1994) has been shown to be better than maximum likelihood estimation. Integrating \(\boldsymbol{\beta}\) out of a Gaussian likelihood yields the restricted Gaussian likelihood. Minus twice a restricted Gaussian log-likelihood is given by \[\begin{equation}\label{eq:reml-lik} -2\ell_R(\boldsymbol{\theta}) = -2\ell_p(\boldsymbol{\theta}) + \ln{|\mathbf{X}^\top \boldsymbol{\Sigma}^{-1} \mathbf{X}|} - p \ln{2\pi} , \end{equation}\] where \(p\) equals the dimension of \(\boldsymbol{\beta}\). Minimizing this equation yields \(\boldsymbol{\hat{\theta}}_{reml}\), the restricted maximum likelihood estimates for \(\boldsymbol{\theta}\). Then a closed for solution exists for \(\boldsymbol{\hat{\beta}}_{reml}\), the restricted maximum likelihood estimates for \(\boldsymbol{\beta}\): \(\boldsymbol{\hat{\beta}}_{reml} = \tilde{\boldsymbol{\beta}}_{reml}\), where \(\tilde{\boldsymbol{\beta}}_{reml}\) is \(\tilde{\boldsymbol{\beta}}\) evaluated at \(\boldsymbol{\hat{\theta}}_{reml}\).
The covariance matrix can often be written as \(\boldsymbol{\Sigma} = \sigma^2 \boldsymbol{\Sigma}^*\), where \(\sigma^2\) is the overall variance and \(\boldsymbol{\Sigma}^*\) is a covariance matrix that depends on parameter vector \(\boldsymbol{\theta}^*\) with one less dimension than \(\boldsymbol{\theta}\). Then the overall variance, \(\sigma^2\), can be profiled out of the previous likelihood equation. This reduces the number of parameters requiring optimization by one, which can dramatically reduce estimation time. Further profiling out \(\sigma^2\) yields \[\begin{equation*}\label{eq:ml-plik} -2\ell_p^*(\boldsymbol{\theta}^*) = \ln{|\boldsymbol{\Sigma^*}|} + n\ln[(\mathbf{y} - \mathbf{X} \tilde{\boldsymbol{\beta}})^\top \boldsymbol{\Sigma}^{* -1} (\mathbf{y} - \mathbf{X} \tilde{\boldsymbol{\beta}})] + n + n\ln{2\pi / n}. \end{equation*}\] After finding \(\hat{\boldsymbol{\theta}}^*_{ml}\), a closed form solution for \(\hat{\sigma}^2_{ml}\) exists: \(\hat{\sigma}^2_{ml} = [(\mathbf{y} - \mathbf{X} \boldsymbol{\tilde{\beta}})^\top \mathbf{\Sigma}^{* -1} (\mathbf{y} - \mathbf{X} \tilde{\boldsymbol{\beta}})] / n\). Then \(\boldsymbol{\hat{\theta}}^*_{ml}\) is combined with \(\hat{\sigma}^2_{ml}\) to yield \(\boldsymbol{\hat{\theta}}_{ml}\) and subsequently \(\boldsymbol{\hat{\beta}}_{ml}\). A similar result holds for restricted maximum likelihood estimation. Further profiling out \(\sigma^2\) yields \[\begin{equation*}\label{eq:reml-plik} -2\ell_R^*(\boldsymbol{\Theta}) = \ln{|\boldsymbol{\Sigma}^*|} + (n - p)\ln[(\mathbf{y} - \mathbf{X} \tilde{\boldsymbol{\beta}})^\top \boldsymbol{\Sigma}^{* -1} (\mathbf{y} - \mathbf{X} \tilde{\boldsymbol{\beta}})] + \ln{|\mathbf{X}^\top \boldsymbol{\Sigma}^{* -1} \mathbf{X}|} + (n - p) + (n - p)\ln2\pi / (n - p). \end{equation*}\] After finding \(\hat{\boldsymbol{\theta}}^*_{reml}\), a closed form solution for \(\hat{\sigma}^2_{reml}\) exists: \(\hat{\sigma}^2_{reml} = [(\mathbf{y} - \mathbf{X} \boldsymbol{\tilde{\beta}})^\top \mathbf{\Sigma}^{* -1} (\mathbf{y} - \mathbf{X} \tilde{\boldsymbol{\beta}})] / (n - p)\). Then \(\boldsymbol{\hat{\theta}}^*_{reml}\) is combined with \(\hat{\sigma}^2_{reml}\) to yield \(\boldsymbol{\hat{\theta}}_{reml}\) and subsequently \(\boldsymbol{\hat{\beta}}_{reml}\). For more on profiling Gaussian likelihoods, see Wolfinger et al. (1994).
Both maximum likelihood and restricted maximum likelihood estimation rely on the \(n \times n\) covariance matrix inverse. Inverting an \(n \times n\) matrix is an enormous computational demand that scales cubically with the sample size. For this reason, maximum likelihood and restricted maximum likelihood estimation have historically been infeasible to implement in their standard form with data larger than a few thousand observations. This motivates the use for big data approaches.
Semivariogram-based Estimation (splm() only)
An alternative approach to likelihood-based estimation is semivariogram-based estimation. The semivariogram of a constant-mean process \(\mathbf{y}\) is the expectation of half of the squared difference between two observations \(h\) distance apart. More formally, the semivariogram is denoted \(\gamma(h)\) and defined as \[\begin{equation*}\label{eq:sv} \gamma(h) = \text{E}[(y_i - y_j)^2] / 2 , \end{equation*}\] where \(h\) is the Euclidean distance between the locations of \(y_i\) and \(y_j\). When the process \(\mathbf{y}\) is second-order stationary, the semivariogram and covariance function are intimately connected: \(\gamma(h) = \sigma^2 - \text{Cov}(h)\), where \(\sigma^2\) is the overall variance and \(\text{Cov}(h)\) is the covariance function evaluated at \(h\). As such, the semivariogram and covariance function rely on the same parameter vector \(\boldsymbol{\theta}\). Both of the semivariogram approaches described next are more computationally efficient than restricted maximum likelihood and maximum likelihood estimation because the major computational burden of the semivariogram approaches (calculations based on squared differences among pairs) scales quadratically with the sample size (i.e., not the cubed sample size like the likelihood-based approaches).
Weighted Least Squares (estmethod = "sv-wls")
The empirical semivariogram is a moment-based estimate of the semivariogram denoted by \(\hat{\gamma}(h)\). It is defined as \[\begin{equation*} \hat{\gamma}(h) = \frac{1}{2|N(h)|} \sum_{N(h)} (y_i - y_j)^2, \end{equation*}\] where \(N(h)\) is the set of observations in \(\mathbf{y}\) that are \(h\) distance units apart (distance classes) and \(|N(h)|\) is the cardinality of \(N(h)\) (Cressie 1993). One criticism of the empirical semivariogram is that distance bins and cutoffs tend to be arbitrarily chosen (i.e., not chosen according to some statistical criteria).
Cressie (1985) proposed estimating \(\boldsymbol{\theta}\) by minimizing an objective function that involves \(\gamma(h)\) and \(\hat{\gamma}(h)\) and is based on a weighted least squares criterion. This criterion is defined as \[\begin{equation}\label{eq:svwls} \sum_i w_i [\hat{\gamma}(h)_i - \gamma(h)_i]^2, \end{equation}\] where \(w_i\), \(\hat{\gamma}(h)_i\), and \(\gamma(h)_i\) are the weights, empirical semivariogram, and semivariogram for the \(i\)th distance class, respectively. Minimizing this loss function yields \(\boldsymbol{\hat{\theta}}_{wls}\), the semivariogram weighted least squares estimate of \(\boldsymbol{\theta}\). After estimating \(\boldsymbol{\theta}\), \(\boldsymbol{\beta}\) estimates are constructed using (empirical) generalized least squares: \(\boldsymbol{\hat{\beta}}_{wls} = (\mathbf{X}^\top \hat{\mathbf{\Sigma}}^{-1} \mathbf{X})^{-1} \mathbf{X}^\top \hat{\mathbf{\Sigma}}^{-1} \mathbf{y}\).
Cressie (1985) recommends setting \(w_i = |N(h)| / \gamma(h)_i^2\), which gives
more weight to distance classes with more observations (\(|N(h)|\)) and shorter distances (\(1 / \gamma(h)_i^2\)). The default in
spmodel is to use these \(w_i\), known as Cressie weights, though
several other options for \(w_i\) exist
and are available via the weights argument. The following
table contains all \(w_i\) available
via the weights argument.
| \(w_i\) Name | \(w_i\) Form | weight = |
|---|---|---|
| Cressie | \(|N(h)| / \gamma(h)_i^2\) | "cressie" |
| Cressie (Denominator) Root | \(|N(h)| / \gamma(h)_i\) | "cressie-dr" |
| Cressie No Pairs | \(1 / \gamma(h)_i^2\) | "cressie-nopairs" |
| Cressie (Denominator) Root No Pairs | \(1 / \gamma(h)_i\) | "cressie-dr-nopairs" |
| Pairs | \(|N(h)|\) | "pairs" |
| Pairs Inverse Distance | \(|N(h)| / h^2\) | "pairs-invd" |
| Pairs Inverse (Root) Distance | \(|N(h)| / h\) | "pairs-invrd" |
| Ordinary Least Squares | 1 | "ols" |
The number of \(N(h)\) classes and
the maximum distance for \(h\) are
specified by passing the bins and cutoff
arguments to splm() (these arguments are passed via
... to esv()). The default value for
bins is 15 and the default value for cutoff is
half the maximum distance of the spatial domain’s bounding box.
Recall that the semivariogram is defined for a constant-mean process. Generally, \(\mathbf{y}\) does not necessarily have a constant mean so the empirical semivariogram and \(\boldsymbol{\hat{\theta}}_{wls}\) are typically constructed using the residuals from an ordinary least squares regression of \(\mathbf{y}\) on \(\mathbf{X}\). These ordinary least squares residuals are assumed to have mean zero.
Composite Likelihood (estmethod = "sv-cl")
Composite likelihood approaches involve constructing likelihoods based on conditional or marginal events for which likelihoods are available and then adding together these individual components. Composite likelihoods are attractive because they behave very similar to likelihoods but are easier to handle, both from a theoretical and from a computational perspective. Curriero and Lele (1999) derive a particular composite likelihood for estimating semivariogram parameters. The negative log of this composite likelihood, denoted \(\text{CL}(h)\), is given by \[\begin{equation}\label{eq:svcl} \text{CL}(h) = \sum_{i = 1}^{n - 1} \sum_{j > i} \left( \frac{(y_i - y_j)^2}{2\gamma(h)} + \ln(\gamma(h)) \right) \end{equation}\] where \(\gamma(h)\) is the semivariogram. Minimizing this loss function yields \(\boldsymbol{\hat{\theta}}_{cl}\), the semivariogram composite likelihood estimates of \(\boldsymbol{\theta}\). After estimating \(\boldsymbol{\theta}\), \(\boldsymbol{\beta}\) estimates are constructed using (empirical) generalized least squares: \(\boldsymbol{\hat{\beta}}_{cl} = (\mathbf{X}^\top \hat{\mathbf{\Sigma}}^{-1} \mathbf{X})^{-1} \mathbf{X}^\top \hat{\mathbf{\Sigma}}^{-1} \mathbf{y}\).
An advantage of the composite likelihood approach to semivariogram estimation is that it does not require arbitrarily specifying empirical semivariogram bins and cutoffs. It does tend to be more computationally demanding than weighted least squares, however. The composite likelihood is constructed from \(\binom{n}{2}\) pairs for a sample size \(n\), whereas the weighted least squares approach only requires calculating \(\binom{|N(h)|}{2}\) pairs for each distance bin \(N(h)\). As with the weighted least squares approach, the composite likelihood approach requires a constant-mean process, so typically the residuals from an ordinary least squares regression of \(\mathbf{y}\) on \(\mathbf{X}\) are used to estimate \(\boldsymbol{\theta}\).
Optimization
Parameter estimation is performed using stats::optim().
The default estimation method is Nelder-Mead (Nelder and Mead 1965) and the stopping
criterion is a relative convergence tolerance (reltol) of
1e-6 (1e-4 prior to version 0.13.0). If only one parameter requires
estimation (on the profiled scale if relevant), the Brent algorithm is
instead used (Brent 1971). Arguments to
optim() are passed via ... to
splm() and spautor(). For example, the default
estimation method and convergence criteria are overridden by passing
method and control, respectively, to
splm() and spautor(). If the
lower and upper arguments to
optim() are specified in splm() and
spautor() to be passed to optim(), they are
ignored, as optimization for all parameters is generally unconstrained.
Initial values for optim() are found using the grid search
described next.
Grid Search
spmodel uses a grid search to find suitable initial
values for use in optimization. For spatial linear models without random
effects, the spatially dependent variance (\(\sigma^2_{de}\)) and spatially independent
variance (\(\sigma^2_{ie}\)) parameters
are given “low”, “medium”, and “high” values. The sample variance of a
non-spatial linear model is slightly inflated by a factor of 1.2
(non-spatial models can underestimate the variance when there is spatial
dependence) and these “low”, “medium”, and “high” values correspond to
10%, 50%, and 90% of the inflated sample variance. Only combinations of
\(\sigma^2_{de}\) and \(\sigma^2_{ie}\) whose proportions sum to
100% are considered. The range (\(\phi\)) and extra (\(\xi\)) parameters are given “low” and
“high” values that are unique to each spatial covariance function. For
example, when using an exponential covariance function, the “low” value
of \(\phi\) is one-half the diagonal of
the domain’s bounding box divided by three. This particular value is
chosen so that the effective range (the distance at which the covariance
is approximately zero), which equals \(3\phi\) for the exponential covariance
function, is is reached at one-half the diagonal of the domain’s
bounding box. Analogously, the “high” value of \(\phi\) is three-halves the diagonal of the
domain’s bounding box divided by three. The anisotropy rotation
parameter (\(\alpha\)) is given six
values that correspond to 0, \(\pi/6\),
\(2\pi/6\), \(4\pi/6\), \(5\pi/6\), and \(\pi\) radians. The anisotropy scale
parameter (\(S\)) is given “low”,
“medium”, and “high” values that correspond to scaling factors of 0.25,
0.75, and 1. Note that the anisotropy parameters are only used during
grid searches for point-referenced data.
The crossing of all appropriate parameter values is considered. If initial values are used for a parameter, the initial value replaces all values of the parameter in this crossing. Duplicate crossings are then omitted. The parameter configuration that yields the smallest value of the objective function is then used as an initial value for optimization. Suppose the inflated sample variance is 10, the exponential covariance is used assuming isotropy, and the diagonal of the bounding box is 180 distance units. The parameter configurations evaluated are shown in the following table.
| \(\sigma^2_{de}\) | \(\sigma^2_{ie}\) | \(\phi\) | \(\alpha\) | \(S\) |
|---|---|---|---|---|
| 9 | 1 | 15 | 0 | 1 |
| 1 | 9 | 15 | 0 | 1 |
| 5 | 5 | 15 | 0 | 1 |
| 9 | 1 | 45 | 0 | 1 |
| 1 | 9 | 45 | 0 | 1 |
| 5 | 5 | 15 | 0 | 1 |
For spatial linear models with random effects, the same approach is used to create a crossing of spatial covariance parameters. A separate approach is used to create a set of random effect variances. The random effect variances are similarly first grouped by proportions. The first combination is such that the first random effect variance is given 90% of variance, and the remaining 10% is spread out evenly among the remaining random effect variances. The second combination is such that the second random effect variance is given 90% of the variance, and the remaining 10% is spread out evenly among the remaining random effect variances. And so on and so forth. These combinations ascertain whether one random effect dominates variability. A final grouping is lastly considered: all 100% of variance is spread out evenly among all random effects.
When finding parameter values \(\sigma^2_{de}\), \(\sigma^2_{ie}\), and the random effect
variances (\(\sigma^2_{u_i}\) for the
\(i\)th random effect), three scenarios
are considered. In the first scenario, \(\sigma^2_{de}\) and \(\sigma^2_{ie}\) get 90% of the inflated
sample variance and the random effect variances get 10%. In this
scenario, only the random effect grouping where the variance is evenly
spread out is considered. This is because the random effect variances
are already contributing little to the overall variability, so
performing additional objective function evaluations is unnecessary. In
the second scenario, the random effects get 90% of the inflated sample
variances and \(\sigma^2_{de}\) and
\(\sigma^2_{ie}\) get 10%. Similarly in
this scenario, only the \(\sigma^2_{de}\) and \(\sigma^2_{ie}\) grouping where the variance
is evenly spread out is considered. Also in this scenario, only the
lowest value for range and extra are used. In
the third scenario, the 50% of the inflated sample variance is given to
\(\sigma^2_{de}\) and \(\sigma^2_{ie}\) and 50% to the random
effects. In this scenario, the only parameter combination considered is
the case where variances are evenly spread out among \(\sigma^2_{de}\), \(\sigma^2_{ie}\), and the random effect
variances. Together, there are parameter configurations where the
spatial variability dominates (scenario 1), the random variability
dominates (scenario 2), and where there is an even contribution from
spatial and random variability. The parameter configuration that
minimizes the objective function is then used as an initial value for
optimization. Recall that random effects are only used with restricted
maximum likelihood or maximum likelihood estimation, so the objective
function is always a likelihood.
Suppose the inflated sample variance is 10, the exponential covariance is used assuming isotropy, the diagonal of the bounding box is 180 distance units, and there are two random effects. The parameter configurations evaluated are shown in the following table.
| \(\sigma^2_{de}\) | \(\sigma^2_{ie}\) | \(\phi\) | \(\alpha\) | \(S\) | \(\sigma^2_{u1}\) | \(\sigma^2_{u2}\) |
|---|---|---|---|---|---|---|
| 8.1 | 0.9 | 15 | 0 | 1 | 0.5 | 0.5 |
| 0.9 | 8.1 | 15 | 0 | 1 | 0.5 | 0.5 |
| 4.5 | 4.5 | 15 | 0 | 1 | 0.5 | 0.5 |
| 8.1 | 0.9 | 45 | 0 | 1 | 0.5 | 0.5 |
| 0.9 | 8.1 | 45 | 0 | 1 | 0.5 | 0.5 |
| 4.5 | 4.5 | 45 | 0 | 1 | 0.5 | 0.5 |
| 0.5 | 0.5 | 15 | 0 | 1 | 8.1 | 0.9 |
| 0.5 | 0.5 | 15 | 0 | 1 | 0.9 | 8.1 |
| 0.5 | 0.5 | 15 | 0 | 1 | 4.5 | 4.5 |
| 2.5 | 2.5 | 15 | 0 | 1 | 2.5 | 2.5 |
| 2.5 | 2.5 | 45 | 0 | 1 | 2.5 | 2.5 |
This grid search approach balances a thorough exploration of the parameter space with computational efficiency, as each objective function evaluation can be computationally expensive.
Hypothesis Testing
The hypothesis tests for \(\hat{\boldsymbol{\beta}}\) returned by
summary() or tidy() of an splm or
spautor object are asymptotic z-tests based on the normal
(Gaussian) distribution (Wald tests). The null hypothesis for the test
associated with each \(\hat{\beta}_i\)
is that \(\beta_i = 0\). Then the test
statistic is given by \[\begin{equation*}
\tilde{z} = \frac{\hat{\beta}_i}{\text{SE}(\hat{\beta}_i)},
\end{equation*}\] where \(\text{SE}(\hat{\beta}_i)\) is the standard
error of \(\hat{\beta}_i\), which
equals the square root of the \(i\)th
diagonal element of \((\mathbf{X}^\top
\hat{\boldsymbol{\Sigma}}^{-1} \mathbf{X})^{-1}\). The p-value is
given by \(2 * (1 -
\Phi(|\tilde{z}|))\), which corresponds to an equal-tailed,
two-sided hypothesis test of level \(\alpha\) where \(\Phi(\cdot)\) denotes the standard normal
(Gaussian) cumulative distribution function and \(|\cdot|\) denotes the absolute value.
Random Effects (splm() only and "reml" or
"ml" estmethod only)
The random effects contribute directly to the covariance through their design matrices. Let \(\mathbf{u}\) be a mean-zero random effect column vector of length \(n_u\), where \(n_u\) is the number of levels of the random effect, with design matrix \(\mathbf{Z}_u\). Then \(\text{Cov}(\mathbf{Z}_u\mathbf{u}) = \mathbf{Z}_u \text{Cov}(\mathbf{u})\mathbf{Z}_u^\top\). Because each element of \(\mathbf{u}\) is independent of one another, this reduces to \(\text{Cov}(\mathbf{Z}_u\mathbf{u}) = \sigma^2_u \mathbf{Z}_u \mathbf{Z}_u^\top\), where \(\sigma^2_u\) is the variance parameter corresponding to the random effect (i.e., the random effect variance parameter).
The \(\mathbf{Z}\) matrices index the levels of the random effect. \(\mathbf{Z}\) has dimension \(n \times n_u\), where \(n\) is the sample size. Each row of \(\mathbf{Z}\) corresponds to an observation and each column to a level of the random effect. For example, suppose we have \(n = 4\) observations, so \(\mathbf{y} = \{y_1, y_2, y_3, y_4\}\). Also suppose that the random effect \(\mathbf{u}\) has two levels and that \(y_1\) and \(y_4\) are in the first level and \(y_2\) and \(y_3\) are in the second level. For random intercepts, each element of \(\mathbf{Z}\) is one if the observation is in the appropriate level of the random effect and zero otherwise. So it follows that \[\begin{equation*} \mathbf{Z}\mathbf{u} = \begin{bmatrix} 1 & 0 \\ 0 & 1 \\ 0 & 1 \\ 1 & 0 \end{bmatrix} \begin{bmatrix} u_1 \\ u_2 \end{bmatrix}, \end{equation*}\] where \(u_1\) and \(u_2\) are the random intercepts for the first and second levels of \(\mathbf{u}\), respectively. For random slopes, each element of \(\mathbf{Z}\) equals the value of an auxiliary variable, \(\mathbf{k}\), if the observation is in the appropriate level of the random effect and zero otherwise. So if \(\mathbf{k} = \{2, 7, 5, 4 \}\) it follows that \[\begin{equation*} \mathbf{Z}\mathbf{u} = \begin{bmatrix} 2 & 0 \\ 0 & 7 \\ 0 & 5 \\ 4 & 0 \end{bmatrix} \begin{bmatrix} u_1 \\ u_2 \end{bmatrix}, \end{equation*}\] where \(u_1\) and \(u_2\) are the random slopes for the first and second levels of \(\mathbf{u}\), respectively. If a random slope is included in the model, it is common for the auxiliary variable to be a column in \(\mathbf{X}\), the fixed effects design matrix (i.e., also a fixed effect). Denote this column as \(\mathbf{x}\). Here \(\boldsymbol{\beta}\) captures the average effect of \(\mathbf{x}\) on \(\mathbf{y}\) (accounting for other explanatory variables) and \(\mathbf{u}\) captures a subject-specific effect of \(\mathbf{x}\) on \(\mathbf{y}\). So for a subject in the \(i\)th level of \(\mathbf{u}\), the average increase in \(y\) associated with a one-unit increase \(x\) is \(\beta + u_i\).
The sv-wls and sv-cl estimation methods do
not use a likelihood, and thus, they do not allow for the estimation of
random effects in spmodel.
Anisotropy (splm() only)
An isotropic spatial covariance function behaves similarly in all directions (i.e., is independent of direction) as a function of distance. An anisotropic spatial covariance function does not behave similarly in all directions as a function of distance. The following figure shows ellipses for an isotropic and anisotropic spatial covariance function centered at the origin (a distance of zero). The black outline of each ellipse is a level curve of equal correlation. The left ellipse (a circle) represents an isotropic covariance function. The distance at which the correlation between two observations lays on the level curve is the same in all directions. The right ellipse represents an anisotropic covariance function. The distance at which the correlation between two observations lays on the level curve is different in different directions.
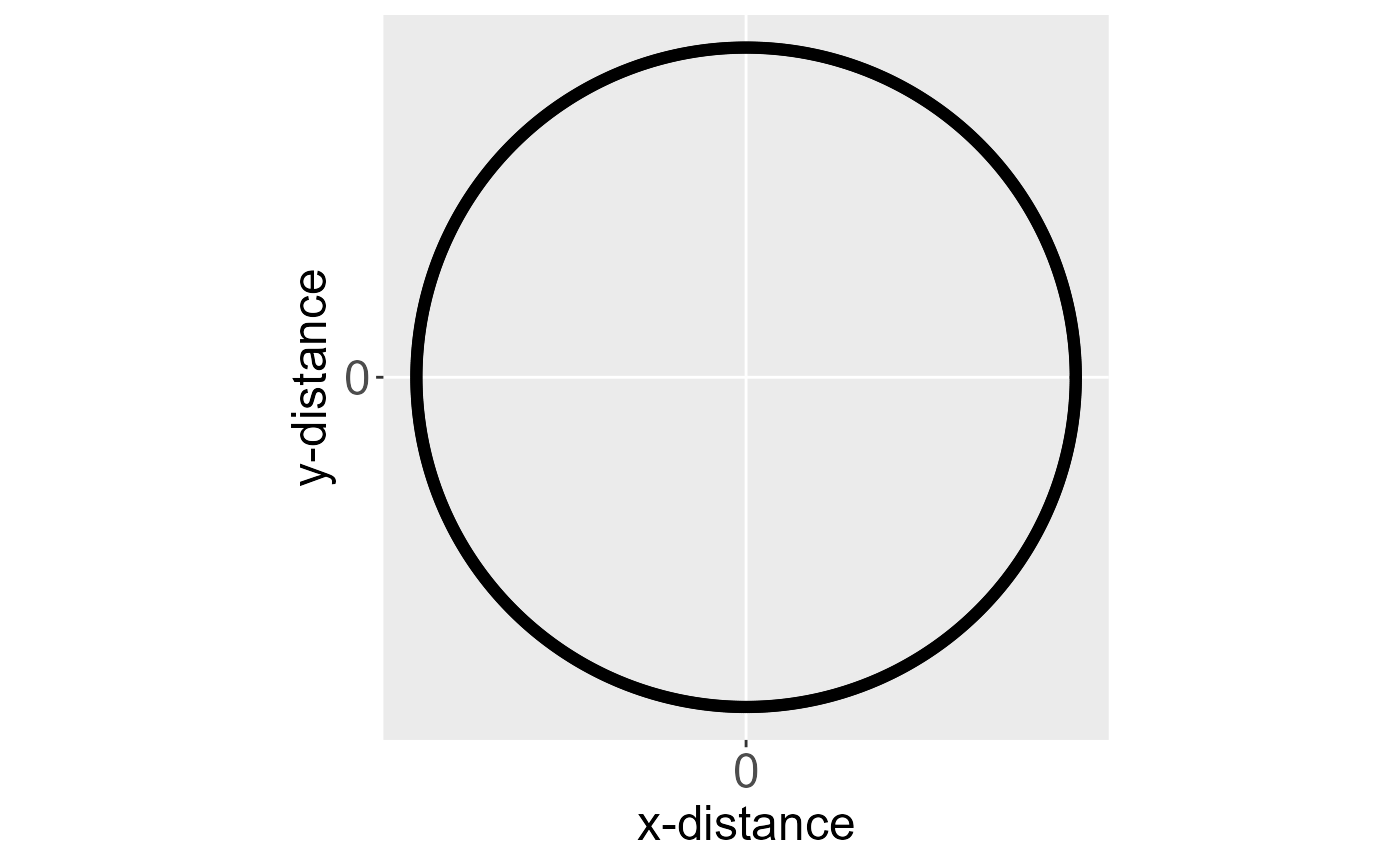
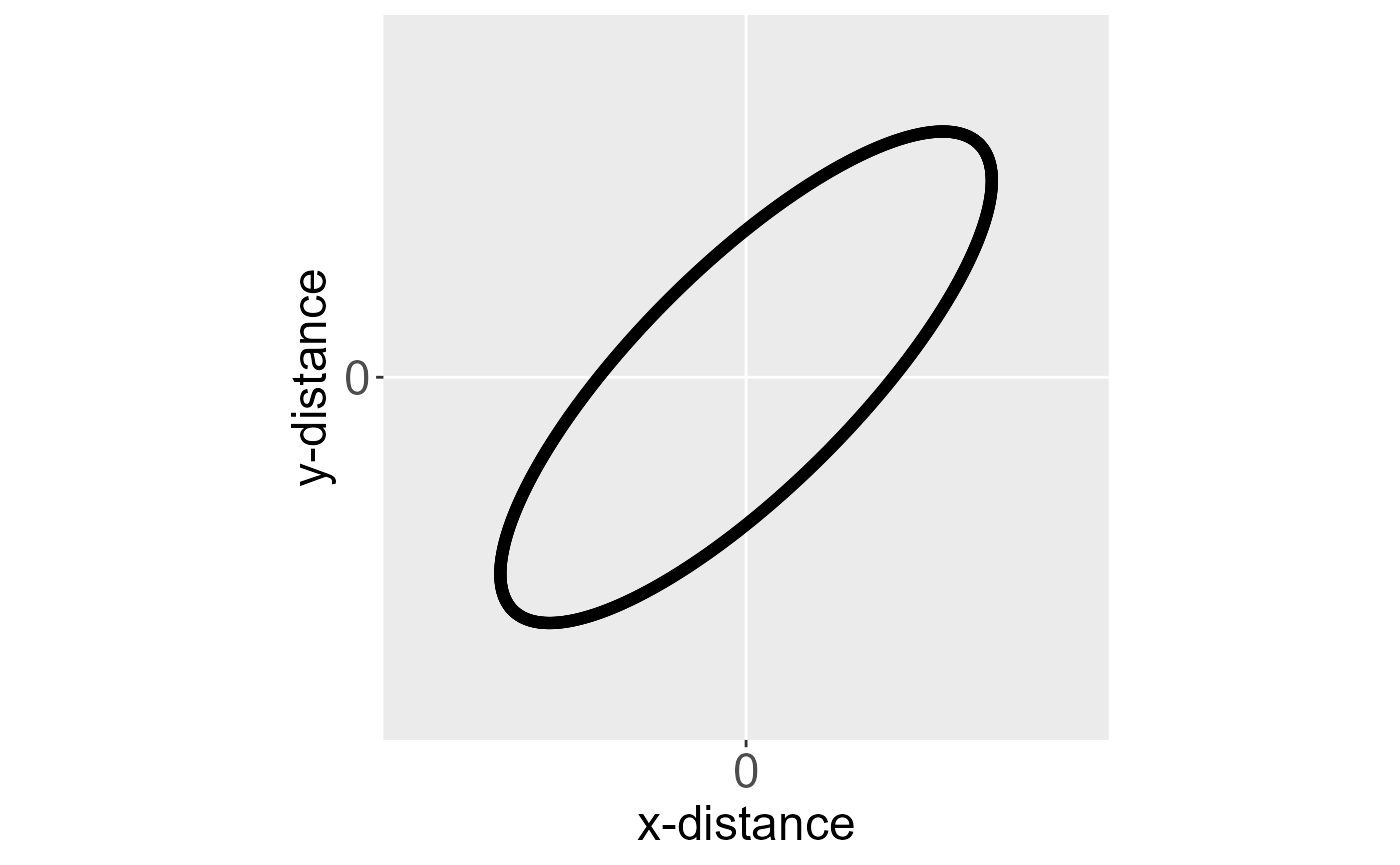
In the left figure, the ellipse of an isotropic spatial covariance function centered at the origin is shown. In the right figure, the ellipse of an anisotropic spatial covariance function centered at the origin is shown. The black outline of each ellipse is a level curve of equal correlation.
To accommodate spatial anisotropy, the original coordinates must be transformed such that the transformed coordinates yield an isotropic spatial covariance. This transformation involves a rotation and a scaling. Consider a set of \(x\) and \(y\) coordinates that should be transformed into \(x^*\) and \(y^*\) coordinates. This transformation is formally defined as \[\begin{equation*} \begin{bmatrix} x^* \\ y^* \end{bmatrix} = \begin{bmatrix} 1 & 0 \\ 0 & 1 / S \end{bmatrix} \begin{bmatrix} \cos(\alpha) & \sin(\alpha) \\ -\sin(\alpha) & \cos(\alpha) \end{bmatrix} \begin{bmatrix} x \\ y \end{bmatrix}. \end{equation*}\] The original coordinates are first multiplied by the rotation matrix, which rotates the coordinates clockwise by angle \(\alpha\). They are then multiplied by the scaling matrix, which scales the minor axis of the spatial covariance ellipse by the reciprocal of \(S\). The transformed coordinates are then used to compute distances and the resulting spatial covariances. This type of anisotropy is more formally known as “geometric” anisotropy because it involves a geometric transformation of the coordinates. The following figure shows this process step-by-step.
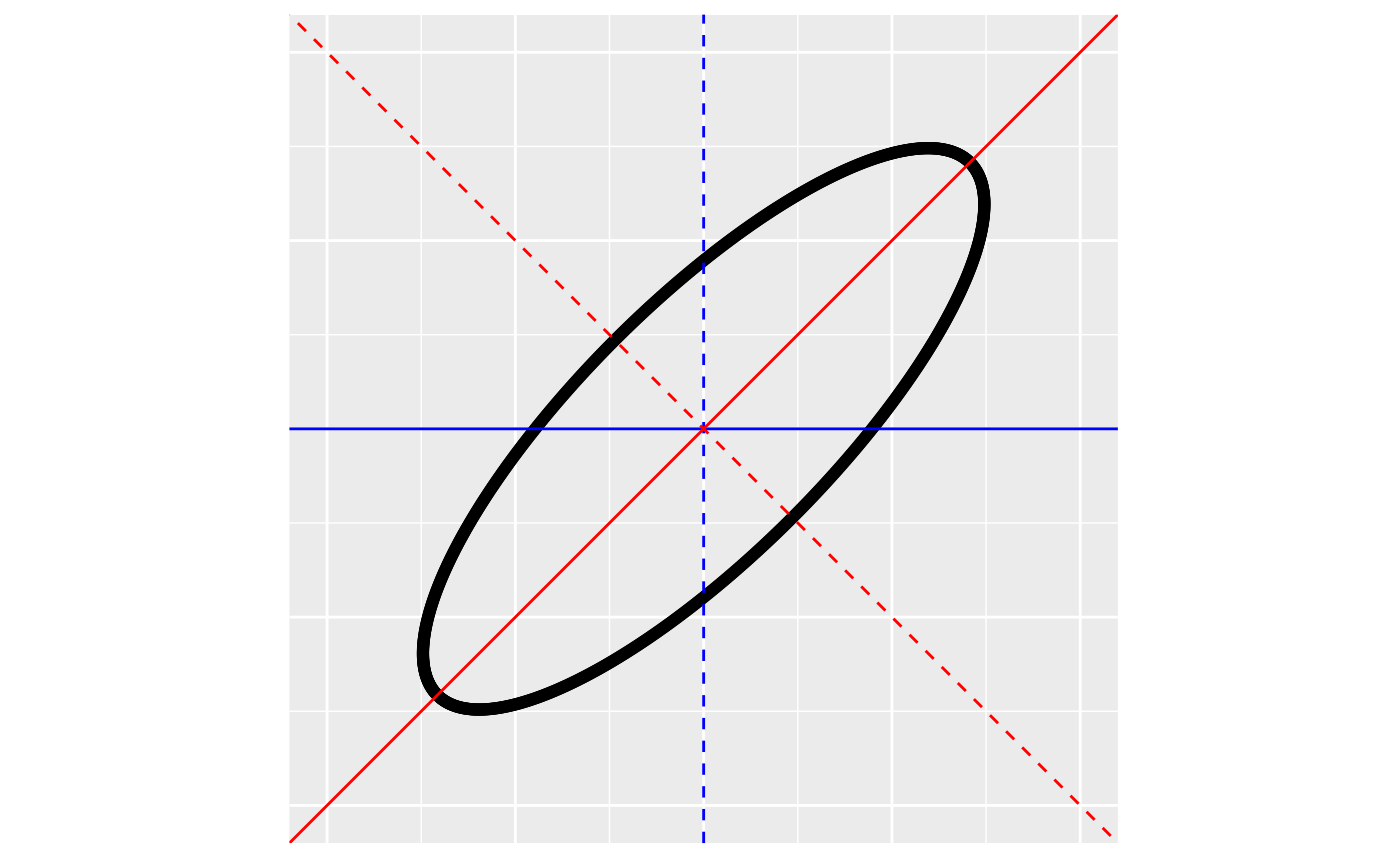
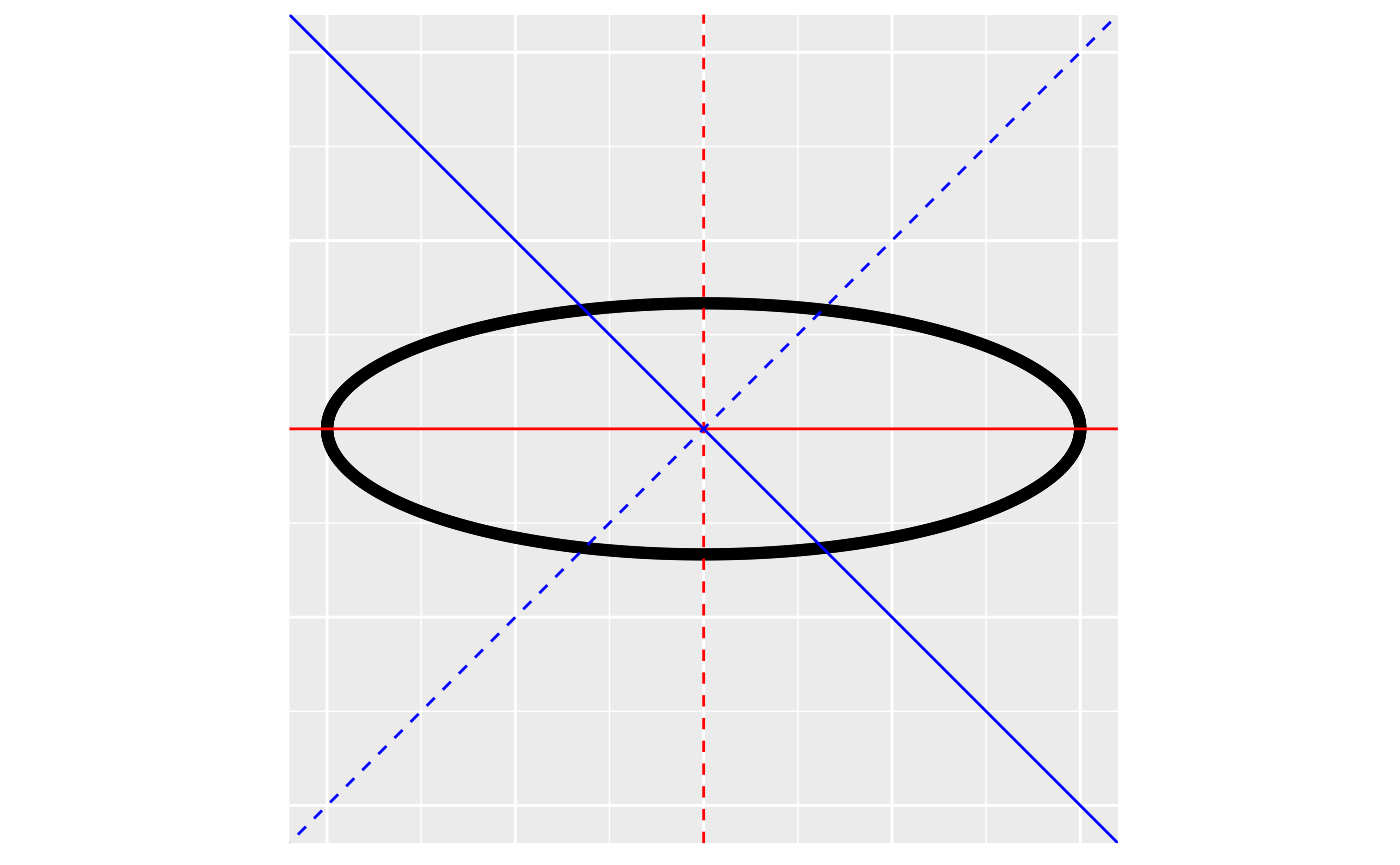
In the left figure, the ellipse of an anisotropic spatial covariance function centered at the origin is shown. The blue lines represent the original axes and the red lines the transformed axes. The solid lines represent the x-axes and the dotted lines the y-axes. Note that the solid, red line is the major axis of the ellpise and the dashed, red line is the minor axis of the ellipse. In the center figure, the ellipse has been rotated clockwise by the rotate parameter so the major axis is the transformed x-axis and the minor axis is the transformed y-axis. In the right figure, the minor axis of the ellipse has been scaled by the reciprocal of the scale parameter so that the ellipse becomes a circle, which corresponds to an isotropic spatial covariance function. The transformed coordinates are then used to compute distances and spatial covariances.
Anisotropy parameters (\(\alpha\)
and \(S\)) can be estimated in
spmodel using restricted maximum likelihood or maximum
likelihood. Estimating anisotropy can be challenging. First, we need to
restrict the parameter space so that the two parameters are identifiable
(there is a unique parameter set for each possible outcome). We
restricted \(\alpha\) to \([0, \pi]\) radians due to symmetry of the
covariance ellipse at rotations \(\alpha\) and \(\alpha + j \pi\), where \(j\) is any integer. We also restricted
\(S\) to \([0, 1]\) because we have defined \(S\) as the scaling factor for the length of
the minor axis relative to the major axis – otherwise it would not be
clear whether \(S\) refers to the minor
or major axis. Given this restricted parameter space, there is still an
issue of local maxima, particularly at rotation parameters near zero,
which have a rotation very close to rotation parameter \(\pi\), but zero is far from \(\pi\) in the parameter space. To address
the local maxima problem, each optimization iteration actually involves
two likelihood evaluations – one for \(\alpha\) and another for \(|\pi - \alpha|\), where \(|\cdot|\) denotes absolute value. Thus one
likelihood evaluation is always in \([0,
\pi/2]\) radians and another in \([\pi/2, \pi]\) radians, exploring different
quadrants of the parameter space and allowing optimization to test
solutions near zero and \(\pi\)
simultaneously.
Anisotropy parameters cannot be estimated in spmodel
when estmethod is sv-wls or
sv-cl. However, known anisotropy parameters for these
estimation methods can be specified via spcov_initial and
incorporated into estimation of \(\boldsymbol{\theta}\) and \(\boldsymbol{\beta}\). Anisotropy is not
defined for areal data given its (binary) neighborhood structure.
Partition Factors
A partition factor is a factor (or categorical) variable in which observations from different levels of the partition factor are assumed uncorrelated. A partition matrix \(\mathbf{P}\) of dimension \(n \times n\) can be constructed to represent the partition factor. The \(ij\)th element of \(\mathbf{P}\) equals one if the observation in the \(i\)th row and \(j\)th column are from the same level of the partition factor and zero otherwise. Then the initial covariance matrix (ignoring the partition factor) is updated by taking the Hadmard (element-wise) product with the partition matrix: \[\begin{equation*} \boldsymbol{\Sigma}_{updated} = \boldsymbol{\Sigma}_{initial} \odot \mathbf{P}, \end{equation*}\] where \(\odot\) indicates the Hadmard product. Partition factors impose a block structure in \(\boldsymbol{\Sigma}\), which allows for efficient computation of \(\boldsymbol{\Sigma}^{-1}\) used for estimation and prediction.
When computing the empirical semivariogram using esv(),
semivariances are ignored when observations are from different levels of
the partition factor. For the sv-wls and sv-cl
estimation methods, semivariances are ignored when observations are from
different levels of the partition factor.
Big Data (splm() only)
Big data model-fitting is accommodated in spmodel using
a “local” spatial indexing (SPIN) approach (Ver
Hoef et al. 2023). Suppose there are \(m\) unique indexes, and each observation
has one of the indexes. Then \(\boldsymbol{\Sigma}\) can be represented
blockwise as \[\begin{equation}\label{eq:full_cov}
\boldsymbol{\Sigma} =
\begin{bmatrix}
\boldsymbol{\Sigma}_{1,1} & \boldsymbol{\Sigma}_{1,2} & \ldots
& \ldots & \boldsymbol{\Sigma}_{1,m} \\
\boldsymbol{\Sigma}_{2,1} & \boldsymbol{\Sigma}_{2,2} &
\boldsymbol{\Sigma}_{2,3} & \ldots & \boldsymbol{\Sigma}_{2,m}
\\
\vdots & \boldsymbol{\Sigma}_{3,2} & \ddots &
\boldsymbol{\Sigma}_{3,4} & \vdots \\
\vdots & \vdots & \boldsymbol{\Sigma}_{4,3} & \ddots &
\vdots \\
\boldsymbol{\Sigma}_{m,1} & \ldots & \ldots & \ldots &
\boldsymbol{\Sigma}_{m, m}
\end{bmatrix},
\end{equation}\] To perform estimation for big data, observations
with the same index value are assumed independent of observations with
different index values, yielding a “big-data” covariance matrix given by
\[\begin{equation}\label{eq:bd_cov}
\boldsymbol{\Sigma}_{bd} =
\begin{bmatrix}
\boldsymbol{\Sigma}_{1,1} & \boldsymbol{0} & \ldots &
\ldots & \boldsymbol{0} \\
\boldsymbol{0} & \boldsymbol{\Sigma}_{2,2} & \boldsymbol{0}
& \ldots & \boldsymbol{0} \\
\vdots & \boldsymbol{0} & \ddots & \boldsymbol{0} &
\vdots \\
\vdots & \vdots & \boldsymbol{0} & \ddots & \vdots \\
\boldsymbol{0} & \ldots & \ldots & \ldots &
\boldsymbol{\Sigma}_{m, m}
\end{bmatrix},
\end{equation}\] Estimation then proceeds using \(\boldsymbol{\Sigma}_{bd}\) instead of \(\boldsymbol{\Sigma}\). When computing the
empirical semivariogram, semivariances are ignored when observations
have different local indexes. For the sv-wls and
sv-cl estimation methods, semivariances are ignored when
observations have different local indexes. Via this equation, it can be
seen that the local index acts as a partition factor separate from the
partition factor explicitly defined by
partition_factor.
spmodel allows for custom local indexes to be passed to
splm(). If a custom local index is not passed, the local
index is determined using the "random" or
"kmeans" method. The "random" method assigns
observations to indexes randomly based on the number of groups desired.
The "kmeans" method uses k-means clustering (MacQueen 1967) on the x-coordinates and
y-coordinates to assign observations to indexes (based on the number of
clusters (groups) desired).
The estimate of \(\boldsymbol{\beta}\) when using \(\boldsymbol{\Sigma}_{bd}\) is given by \[\begin{equation}\label{eq:beta_bd} \hat{\boldsymbol{\beta}}_{bd} = (\mathbf{X}^\top \boldsymbol{\hat{\Sigma}}^{-1}_{bd}\mathbf{X})^{-1}\mathbf{X}^\top \boldsymbol{\hat{\Sigma}}^{-1}_{bd} \mathbf{y} = \mathbf{T}^{-1}_{xx}\mathbf{t}_{xy}, \end{equation}\] where \(\mathbf{T}_{xx} = \sum_{i = 1}^m \mathbf{X}_i^\top \boldsymbol{\hat{\Sigma}}^{-1}_{i, i}\mathbf{X}_i\) and \(\mathbf{t}_{xy} = \sum_{i = 1}^m \mathbf{X}_i^\top \hat{\boldsymbol{\Sigma}}^{-1}_{i, i} \mathbf{y}_i\). Note that in \(\hat{\boldsymbol{\beta}}_{bd}\), \(\mathbf{X}_i\) and \(\mathbf{y}_i\) are the subsets of \(\mathbf{X}\) and \(\mathbf{y}\), respectively, for the \(i\)th local index. This estimator acts as a pooled estimator of \(\boldsymbol{\beta}\) across the indexes.
spmodel has four approaches for estimating the
covariance matrix of \(\hat{\boldsymbol{\beta}}_{bd}\). The choice
is determined by the var_adjust argument to
local. The first approach is implements no adjustment
(var_adjust = "none") and simply uses \(\mathbf{T}_{xx}^{-1}\), which is the
covariance matrix of \(\hat{\boldsymbol{\beta}}_{bd}\) using \(\boldsymbol{\Sigma}_{bd}\). While
computationally efficient, this approach ignores the covariance across
indexes. It can be shown that the covariance of \(\hat{\boldsymbol{\beta}}_{bd}\) using \(\boldsymbol{\Sigma}\), the full covariance
matrix, is given by \[\begin{equation}\label{eq:var_theo}
\mathbf{T}_{xx}^{-1} + \mathbf{T}_{xx}^{-1}
\mathbf{W}_{xx}\mathbf{T}_{xx}^{-1},
\end{equation}\] where \[\begin{equation*}
\mathbf{W} = \sum_{i = 1}^{m - 1} \sum_{j = i + 1}^m (\mathbf{X}^\top
\hat{\boldsymbol{\Sigma}}^{-1}_{i, i} \hat{\boldsymbol{\Sigma}}_{i, j}
\hat{\boldsymbol{\Sigma}}^{-1}_{j, j} \mathbf{X}_j) + (\mathbf{X}^\top
\hat{\boldsymbol{\Sigma}}^{-1}_{i, i} \hat{\boldsymbol{\Sigma}}_{i, j}
\hat{\boldsymbol{\Sigma}}^{-1}_{j, j} \mathbf{X}_j)^\top
\end{equation*}\] This equation can be viewed as the sum of the
unadjusted covariance matrix of \(\hat{\boldsymbol{\beta}}_{bd}\) (\(\mathbf{T}_{xx}^{-1}\)) and a correction
that incorporates the covariance across indexes (\(\mathbf{T}_{xx}^{-1}
\mathbf{W}_{xx}\mathbf{T}_{xx}^{-1}\)). This adjustment is known
as the “theoretically-correct” (var_adjust = "theoretical")
adjustment because it uses \(\boldsymbol{\Sigma}\). The theoretical
adjustment is the default adjustment in spmodel because it
is theoretically correct, but it is the most computationally expensive
adjustment. Two alternative adjustments are also provided, and while not
equal to the theoretical adjustment, they are easier to compute. They
are the empirical (var_adjust = "empirical") and pooled
(var_adjust = "pooled") adjustments. The empirical
adjustment is given by \[\begin{equation*}
\frac{1}{m(m -1)} \sum_{i = 1}^m (\boldsymbol{\hat{\beta}}_i -
\boldsymbol{\hat{\beta}}_{bd})(\boldsymbol{\hat{\beta}}_i -
\boldsymbol{\hat{\beta}}_{bd})^\top,
\end{equation*}\] where \(\boldsymbol{\hat{\beta}}_i = (\mathbf{X}^\top
\hat{\boldsymbol{\Sigma}}^{-1} \mathbf{X})^{-1}\mathbf{X}_i^\top
\hat{\boldsymbol{\Sigma}}^{-1}_{i, i} \mathbf{y}_i\). A similar
adjustment could use \(\boldsymbol{\hat{\beta}}_i = (\mathbf{X}_i^\top
\hat{\boldsymbol{\Sigma}}^{-1}_{i, i} \mathbf{X}_i)^{-1}\mathbf{X}_i
\hat{\boldsymbol{\Sigma}}^{-1}_{i, i} \mathbf{y}_i\), which more
closely resembles a composite likelihood approach. This approach is
sensitive to the presence of at least one singularity in \(\mathbf{X}_i^\top
\hat{\boldsymbol{\Sigma}}^{-1}_{i, i} \mathbf{X}_i\), in which
case the variance adjustment cannot be computed. The
"pooled" variance adjustment is given by \[\begin{equation*}
\frac{1}{m^2} \sum_{i = 1}^m (\mathbf{X}^\top_i
\hat{\boldsymbol{\Sigma}}^{-1}_{i, i} \mathbf{X}_i)^{-1}.
\end{equation*}\] Note that the pooled variance adjustment cannot
be computed if any \(\mathbf{X}_i^\top
\hat{\boldsymbol{\Sigma}}^{-1}_{i, i} \mathbf{X}_i\) are
singular.
splmRF() and spautorRF()
splmRF() and spautorRF() fit random forest
spatial residual models designed for prediction. These models are fit by
combining aspects of random forest and spatial linear modeling. First, a
random forest model (Breiman 2001; James et al.
2013) is fit using the ranger R
package (Wright and Ziegler 2015). Then
random forest fitted values are obtained for each data observation and
used to compute a residual (by subtracting the fitted value from the
observed value). Then an intercept-only spatial linear model is fit to
these residuals: \[\begin{equation*}
\mathbf{e}_{rf} = \beta_0 + \mathbf{\tau} + \mathbf{\epsilon},
\end{equation*}\] where \(\mathbf{e}_{rf}\) are the random forest
residuals. Random forest spatial residual models can significantly
improve predictive accuracy for new data compared to standard random
forest models by formally incorporating spatial covariance in the random
forest residuals (Fox et al. 2020).
Different estimation methods, different spatial covariance functions,
fixing spatial covariance parameter values, random effects, anisotropy,
partition factors, and big data are accommodated in the spatial linear
model portion of the random forest spatial residual models by supplying
their respective named arguments to splmRF() and
spautorRF().
sprnorm()
Spatial normal (Gaussian) random variables are simulated by taking the sum of a fixed mean and random errors. The random errors have mean zero and covariance matrix \(\boldsymbol{\Sigma}\). A realization of the random errors is obtained from \(\boldsymbol{\Sigma}^{1/2} \mathbf{e}\), where \(\mathbf{e}\) is a normal random variable with mean zero and covariance matrix \(\mathbf{I}\). Then the spatial normal random variable equals \[\begin{equation*} \mathbf{y} = \boldsymbol{\mu} + \boldsymbol{\Sigma}^{1/2} \mathbf{e}, \end{equation*}\] where \(\boldsymbol{\mu}\) is the fixed mean. It follows that \[\begin{equation*} \begin{split} \text{E}(\mathbf{y}) & = \boldsymbol{\mu} + \boldsymbol{\Sigma}^{1/2} \text{E}(\mathbf{e}) = \boldsymbol{\mu} \\ \text{Cov}(\mathbf{y}) & = \text{Cov}(\boldsymbol{\Sigma}^{1/2} \mathbf{e}) = \boldsymbol{\Sigma}^{1/2} \text{Cov}(\mathbf{e}) \boldsymbol{\Sigma}^{1/2} = \boldsymbol{\Sigma}^{1/2} \boldsymbol{\Sigma}^{1/2} = \boldsymbol{\Sigma} \end{split} \end{equation*}\]
vcov()
vcov() returns the variance-covariance matrix of
estimated parameters. Currently, vcov() only returns the
variance-covariance matrix of \(\hat{\boldsymbol{\beta}}\), the fixed
effects. The variance-covariance matrix of the fixed effects is given by
\((\mathbf{X}^\top
\hat{\boldsymbol{\Sigma}}^{-1} \mathbf{X})^{-1}\).
Spatial Generalized Linear Models
When building spatial linear models, the response vector \(\mathbf{y}\) is typically assumed Gaussian (given \(\mathbf{X}\)). Relaxing this assumption on the distribution of \(\mathbf{y}\) yields a rich class of spatial generalized linear models that can describe binary data, proportion data, count data, and skewed data that is parameterized as \[\begin{equation}\label{eq:spglm} g(\boldsymbol{\mu}) = \boldsymbol{\eta} = \mathbf{X} \boldsymbol{\beta} + \boldsymbol{\tau} + \boldsymbol{\epsilon}, \end{equation}\] where \(g(\cdot)\) is called a link function, \(\boldsymbol{\mu}\) is the mean of \(\mathbf{y}\), and the remaining terms \(\mathbf{X}\), \(\boldsymbol{\beta}\), \(\boldsymbol{\tau}\), \(\boldsymbol{\epsilon}\) represent the same quantities as for the spatial linear models. The link function, \(g(\cdot)\), “links” a function of \(\boldsymbol{\mu}\) to the linear term \(\boldsymbol{\eta}\) , denoted here as \(\mathbf{X} \boldsymbol{\beta} + \boldsymbol{\tau} + \boldsymbol{\epsilon}\), which is familiar from spatial linear models. Note that the linking of \(\boldsymbol{\mu}\) to \(\boldsymbol{\eta}\) applies element-wise to each vector. Each link function \(g(\cdot)\) has a corresponding inverse link function, \(g^{-1}(\cdot)\). The inverse link function “links” a function of \(\boldsymbol{\eta}\) to \(\boldsymbol{\mu}\). Notice that for spatial generalized linear models, we are not modeling \(\mathbf{y}\) directly as we do for spatial linear models, but rather we are modeling a function of the mean of \(\mathbf{y}\). Also notice that \(\boldsymbol{\eta}\) is unconstrained but \(\boldsymbol{\mu}\) is usually constrained in some way (e.g., positive).
The model \(g(\boldsymbol{\mu}) =
\boldsymbol{\eta} = \mathbf{X} \boldsymbol{\beta} + \boldsymbol{\tau} +
\boldsymbol{\epsilon}\) is called the spatial generalized linear
model. spmodel allows fitting of spatial generalized linear
models when \(\mathbf{y}\) is a
binomial (or Bernoulli), beta, Poisson, negative binomial, gamma, or
inverse Gaussian random vector via the Laplace approximation and
restricted maximum likelihood estimation or maximum likelihood
estimation – Ver Hoef et al. (2024)
provide further details. For binomial and beta \(\mathbf{y}\), the logit link function is
defined as \(g(\boldsymbol{\mu}) =
\ln(\frac{\boldsymbol{\mu}}{1 - \boldsymbol{\mu}}) =
\boldsymbol{\eta}\), and the inverse logit link function is
defined as \(g^{-1}(\boldsymbol{\eta}) =
\frac{\exp(\boldsymbol{\eta})}{1 + \exp(\boldsymbol{\eta})} =
\boldsymbol{\mu}\). For Poisson, negative binomial, gamma, and
inverse Gaussian \(\mathbf{y}\), the
log link function is defined as \(g(\boldsymbol{\mu}) = log(\boldsymbol{\mu}) =
\boldsymbol{\eta}\), and the inverse log link function is defined
as \(g^{-1}(\boldsymbol{\eta}) =
\exp(\boldsymbol{\eta}) = \boldsymbol{\mu}\). Full
parameterizations of these distributions are given later.
For spatial linear models, one can marginalize over \(\boldsymbol{\beta}\) and the random components to obtain an explicit distribution of only the data (\(\mathbf{y}\)) and covariance parameters (\(\boldsymbol{\theta}\)) – this is the REML likelihood. For spatial generalized linear models, this marginalization is more challenging. First define \(\mathbf{w} = \mathbf{X} \boldsymbol{\beta} + \boldsymbol{\tau} + \boldsymbol{\epsilon}\). Our goal is to marginalize the joint distribution of \(\mathbf{y}\) and \(\mathbf{w}\) over \(\mathbf{w}\) (and \(\boldsymbol{\beta}\)) to obtain a distribution of only the data (\(\mathbf{y}\)), a dispersion parameter (\(\varphi\)), and covariance parameters (\(\boldsymbol{\theta}\)). To accomplish this feat, we use a hierarchical construction that treats the \(\mathbf{w}\) as latent (i.e., unobserved) variables and then use the Laplace approximation to perform integration. We briefly describe this approach next, but it is described in full detail in Ver Hoef et al. (2024).
The marginal distribution of interest can be written hierarchically as \[\begin{equation*} [\mathbf{y}|\mathbf{X}, \varphi, \boldsymbol{\theta}] = \int_\mathbf{w} [\mathbf{y} | g^{-1}(\mathbf{w}), \varphi] [\mathbf{w} | \mathbf{X}, \boldsymbol{\theta}] d\mathbf{w} . \end{equation*}\] The term \([\mathbf{y}|g^{-1}(\mathbf{w}), \varphi]\) is likelihood of the generalized linear model with mean function \(g^{-1}(\mathbf{w})\), and the term \([\mathbf{w}|\mathbf{X}, \boldsymbol{\theta}]\) is the restricted log likelihood for \(\mathbf{w}\) given the covariance parameters.
Next define \(\ell_\mathbf{w} = \ln([\mathbf{y} | g^{-1}(\mathbf{w}), \varphi] [\mathbf{w} | \mathbf{X}, \boldsymbol{\theta}])\). Let \(\mathbf{g}\) be the gradient vector where \(g_i = \frac{\partial \ell_\mathbf{w}}{\partial w_i}\) and \(\mathbf{G}\) be the Hessian matrix with \(ij\)th element \(G_{i, j} = \frac{\partial^2 \ell_\mathbf{w}}{\partial w_i \partial w_j}\). Using a multivariate Taylor series expansion around some point \(\mathbf{a}\), \[\begin{equation*} \int_\mathbf{w} \exp(\ell_\mathbf{w}) d\mathbf{w} \approx \int_\mathbf{w} \exp(\ell_\mathbf{a} + \mathbf{g}^\top(\mathbf{w} - \mathbf{a}) + \frac{1}{2}(\mathbf{w} - \mathbf{a})^\top \mathbf{G} (\mathbf{w} - \mathbf{a})) d\mathbf{w}. \end{equation*}\] If \(\mathbf{a}\) is the value at which \(\mathbf{g} = \mathbf{0}\), then \[\begin{equation*} \int_\mathbf{w} \exp(\ell_\mathbf{w}) d\mathbf{w} \approx \exp(\ell_\mathbf{a}) \int_\mathbf{w} \exp \left(-\frac{1}{2} (\mathbf{w} - \mathbf{a})^\top (- \mathbf{G})(\mathbf{w} - \mathbf{a}) \right) d\mathbf{w} = \exp(\ell_\mathbf{a}) (2 \pi)^{n/2} |-\mathbf{G}_a|^{-1/2}, \end{equation*}\] where \(\mathbf{G}_a\) is the Hessian evaluated at \(\mathbf{a}\) and \(|\cdot|\) is the determinant operator. The previous result follows from the normalizing constant of a Gaussian distribution with kernel \(\exp(\frac{1}{2} (\mathbf{w} - \mathbf{a})^\top [(- \mathbf{G})^{-1}]^{-1}(\mathbf{w} - \mathbf{a}))\). Finally, we arrive at \[\begin{equation*} \int_\mathbf{w} \exp(\ell_\mathbf{w}) d\mathbf{w} \approx [\mathbf{y} | g^{-1}(\mathbf{a}), \varphi] [\mathbf{a} | \mathbf{X}, \boldsymbol{\theta}] (2 \pi)^{n/2} |-\mathbf{G}_a|^{-1/2}|, \end{equation*}\] which is a distribution that has been marginalized over the latent \(\mathbf{w}\) and depends only on the data, a dispersion parameter, and the covariance parameters. The approach we outlined to solve this integral is known as the Laplace approximation.
AIC() and AICc()
AIC() and AICc() for spatial generalized
linear models is defined the same as for spatial linear models.
anova()
anova() for spatial generalized linear models is defined
the same as for spatial linear models.
AUROC()
AUROC() is the area under the receiver operating
characteristic curve and is relevant for binomial (i.e., logistic)
regression models where each response represents a single success or
failure (i.e.., is binary). The AUROC ranges from zero to one and is a
measure of the model’s classification accuracy averaged over all
possible threshold values. More formally, it represents the probability
that a randomly chosen success (datum value of one) has a larger fitted
value than the fitted value of a randomly chosen failure (datum value of
zero), with an adjustment for ties in the fitted values (Muschelli III 2020). AUROC() in
spmodel leverages the auc() function in
pROC Robin et al. (2011). For
more on the AUROC, see Hanley and McNeil
(1982) and Fawcett (2006).
BIC()
BIC() for spatial generalized linear models is defined
the same as for spatial linear models.
coef()
coef() for spatial generalized linear models is defined
the same as for spatial linear models.
confint()
confint() for spatial generalized linear models is
defined the same as for spatial linear models.
cooks.distance()
The Cook’s distance is defined as the standard generalized linear model Cook’s distance after conditioning on \(\mathbf{w}\). That is, after conditioning on \(\mathbf{w}\), the Cook’s distance is \[\begin{equation} \frac{\mathbf{e}_p^2}{p} \odot diag(\mathbf{H}_c) \odot \frac{1}{1 - diag(\mathbf{H}_c)}, \end{equation}\] where \(\mathbf{e}_p^2\) are the Pearson residuals, \(diag(\mathbf{H}_c)\) is the diagonal of the leverage (hat) matrix conditional on \(\mathbf{w}\) and given by \(\mathbf{H}_c = \mathbf{X}_v (\mathbf{X}_v^\top\mathbf{X}_v)^{-1} \mathbf{X}_v^\top\), where \(\mathbf{X}_v = \mathbf{V}^{1/2}\mathbf{X}\) and \(\mathbf{V}\) is a diagonal matrix with \(i\)th diagonal element equal to \(\text{Var}(w_i)\), and \(\odot\) denotes the Hadmard (element-wise) product.
deviance()
The deviance is defined conditional on \(\mathbf{w}\) (i.e., we find the deviance of the conditional model). It is derived by taking the deviance definitions from each generalized linear models distribution (defined later) and evaluating \(\mu_i\) at \(w_i\).
fitted()
The fitted values on the link scale (type = "link") are
given by \(\mathbf{w}\). The fitted
values on the response scale (type = "response") are given
by \(g^{-1}(\mathbf{w})\). The fitted
values for the spatial random errors (type = "spcov") and
random effects (type = "randcov") are derived similarly as
for spatial linear models but treat \(\mathbf{w}\) as the response instead of
\(\mathbf{y}\) (and are on the link
scale).
hatvalues()
The leverage (hat) matrix is obtained by finding the standard generalized linear model leverage (hat) matrix after conditioning on \(\mathbf{w}\). That is, after conditioning on \(\mathbf{w}\) the leverage (hat) matrix, \(\mathbf{H}_c\), is \[\begin{equation} \mathbf{H}_c = \mathbf{X}_v (\mathbf{X}_v^\top\mathbf{X}_v)^{-1} \mathbf{X}_v^\top, \end{equation}\] where \(\mathbf{X}_v = \mathbf{V}^{1/2}\mathbf{X}\) and \(\mathbf{V}\) is a diagonal matrix with \(i\)th diagonal element equal to \(\text{Var}(\text{w}_i)\).
logLik()
logLik() for spatial generalized linear models is
defined the same as for spatial linear models, in that the
log-likelihood is returned. The log-likelihood for spatial generalized
linear models is given by \[\begin{equation*}
\ell_p(\varphi, \boldsymbol{\theta}) = \ln([\mathbf{y} |
g^{-1}(\mathbf{a}), \varphi]) + \ln([\mathbf{a} | \mathbf{X},
\boldsymbol{\theta}]) + \frac{n}{2} \ln(2 \pi) - \frac{1}{2} \ln(|-
\mathbf{G}_{\mathbf{a}}|).
\end{equation*}\]
loocv()
loocv() for spatial generalized linear models is defined
similarly as for spatial linear models, except that \(\mathbf{w}\) is predicted instead of \(\mathbf{y}\). Then \(g^{-1}(\mathbf{w})\) is compared to \(\mathbf{y}\) to compute
mean-squared-prediction-error. That is, \[\begin{equation*}
mspe = \frac{1}{n}\sum_{i = 1}^n(y_i - g^{-1}(w_i))^2.
\end{equation*}\]
When cv_fitted = TRUE, the predictions of held-out \(\mathbf{w}\) are returned. The standard
errors of these predictions (of held-out \(\mathbf{w}\)) are returned when
se.fit = TRUE. Note that \(\mathbf{G}_{-i}\) is determined from \(\mathbf{G}\) using Helmert-Wolf blocking as
is done for \(\boldsymbol{\Sigma}_{-i}\) and \(\boldsymbol{\Sigma}\).
Big Data
loocv() for big data spatial generalized linear models
are defined similarly as for big data spatial linear models, except that
\(\mathbf{w}\) is predicted instead of
\(\mathbf{y}\). Additionally, \(\mathbf{G}_{l, l}\) is determined from each
local neighborhood as is done for \(\boldsymbol{\Sigma}_{l, l}\).
predict()
interval = "none"
Building from the previously defined empirical best linear unbiased
predictions (i.e., empirical Kriging predictions), predictions of \(\mathbf{w}_u\) are given on the link scale
(type = "link") by \[\begin{equation}\label{eq:glm_blup}
\mathbf{\dot{w}}_u = \mathbf{X}_u \hat{\boldsymbol{\beta}} +
\hat{\boldsymbol{\Sigma}}_{uo} \hat{\boldsymbol{\Sigma}}^{-1}_{o}
(\hat{\mathbf{w}}_o - \mathbf{X}_o \hat{\boldsymbol{\beta}}) .
\end{equation}\] These predictions are given on the response
(inverse link) scale (type = "response") as \(g^{-1}(\mathbf{\dot{w}}_u)\).
Similar to the covariance matrix of \(\hat{\boldsymbol{\beta}}\), the covariance
matrix of \(\mathbf{\dot{w}}_u\)
requires an adjustment to account for the fact that the \(\mathbf{w}\) are not actually observed.
First let \(\boldsymbol{\Lambda} =
\mathbf{X}_u \mathbf{B} + \hat{\boldsymbol{\Sigma}}_{uo}
\hat{\boldsymbol{\Sigma}}_o^{-1} + \hat{\boldsymbol{\Sigma}}_{uo}
\hat{\boldsymbol{\Sigma}}_o^{-1} \mathbf{X}_o \mathbf{B}\) and
\(\mathbf{B} = (\mathbf{X}^\top
\hat{\boldsymbol{\Sigma}}_o^{-1} \mathbf{X})^{-1} \mathbf{X}^\top
\hat{\boldsymbol{\Sigma}}_o^{-1}\), and note that \(\mathbf{\dot{w}}_u = \Lambda
\hat{\mathbf{w}}_o\). Using the law of conditional variance and
conditioning on \(\mathbf{w}_o\) as if
we had observed them, it follows that \[\begin{equation*}
\text{Cov}(\hat{\mathbf{w}}_u - \mathbf{w}_u) = \text{Cov}(\Lambda
\hat{\mathbf{w}}_o - \mathbf{w}_u) =
\text{E}_{\mathbf{w}_o}[\text{Cov}(\Lambda \hat{\mathbf{w}}_o -
\mathbf{w}_u | \mathbf{w}_o)] +
\text{Cov}_{\mathbf{w}_o}[\text{E}(\Lambda \hat{\mathbf{w}}_o -
\mathbf{w}_u | \mathbf{w}_o)],
\end{equation*}\] We assume \(\hat{\mathbf{w}}_o\) is unbiased for \(\mathbf{w}_o\) (i.e., \(\text{E}(\hat{\mathbf{w}}_o | \mathbf{w}_o) =
\mathbf{w}_o\)). Then \(\text{Cov}_{\mathbf{w}_o}[\text{E}(\Lambda
\hat{\mathbf{w}}_o - \mathbf{w}_u | \mathbf{w}_o)] =
\text{Cov}_{\mathbf{w}_o}(\Lambda \mathbf{w}_o - \mathbf{w}_u) =
\hat{\boldsymbol{\Sigma}}_u - \hat{\boldsymbol{\Sigma}}_{uo}
\hat{\boldsymbol{\Sigma}}^{-1}_o \hat{\boldsymbol{\Sigma}}^\top_{uo} +
\mathbf{Q}(\mathbf{X}_o^\top \hat{\boldsymbol{\Sigma}}_o^{-1}
\mathbf{X}_o)^{-1}\mathbf{Q}^\top\), where \(\mathbf{Q} = \mathbf{X}_u -
\hat{\boldsymbol{\Sigma}}_{uo} \hat{\boldsymbol{\Sigma}}^{-1}_o
\mathbf{X}_o\), the usual form for the mean squared prediction
error of \(\hat{\mathbf{w}}_u\). Next
note that (viewing \(\mathbf{w}_u\) as
a constant) \(\text{E}_{\mathbf{w}_o}[\text{Cov}(\Lambda
\hat{\mathbf{w}}_o - \mathbf{w}_u | \mathbf{w}_o)]\) can be
viewed as the observed Fisher Information inverse, \(- \mathbf{G}^{-1}\). Evaluating \(\mathbf{G}\) at \(\mathbf{a}\) eventually yields the adjusted
covariance matrix of \(\Lambda
\hat{\mathbf{w}}_o - \mathbf{w}_u\)
(var_correct = TRUE) given by \[\begin{equation}\label{eq:glm_blup_cov}
\text{Cov}(\Lambda \hat{\mathbf{w}}_o - \mathbf{w}_u) =
\dot{\boldsymbol{\Sigma}}_u = \Lambda (-\mathbf{G}_\mathbf{a})^{-1}
\Lambda^\top + \hat{\boldsymbol{\Sigma}}_u -
\hat{\boldsymbol{\Sigma}}_{uo} \hat{\boldsymbol{\Sigma}}^{-1}_o
\hat{\boldsymbol{\Sigma}}^\top_{uo} + \mathbf{Q}(\mathbf{X}_o^\top
\hat{\boldsymbol{\Sigma}}_o^{-1} \mathbf{X}_o)^{-1}\mathbf{Q}^\top .
\end{equation}\]
The unadjusted covariance matrix of \(\Lambda \hat{\mathbf{w}}_o - \mathbf{w}_u\)
(var_correct = FALSE) can also be returned and is given by
\[\begin{equation}\label{eq:glm_blup_cov_unadj}
\text{Cov}(\Lambda \hat{\mathbf{w}}_o - \mathbf{w}_u) =
\dot{\boldsymbol{\Sigma}}_u = \hat{\boldsymbol{\Sigma}}_u -
\hat{\boldsymbol{\Sigma}}_{uo} \hat{\boldsymbol{\Sigma}}^{-1}_o
\hat{\boldsymbol{\Sigma}}^\top_{uo} + \mathbf{Q}(\mathbf{X}_o^\top
\hat{\boldsymbol{\Sigma}}_o^{-1} \mathbf{X}_o)^{-1}\mathbf{Q}^\top .
\end{equation}\]
When se.fit = TRUE, standard errors are returned on the
link scale by taking the square root of the diagonal of the relevant
\(\dot{\boldsymbol{\Sigma}}_u\).
interval = "prediction"
Predictions of \(\mathbf{w}_u\) are
returned on the link scale (type = "link") by evaluating
\(\mathbf{\dot{w}}_u\). The (100 \(\times\) level)% prediction
interval for \((w_u)_i\) is \((\dot{w}_u)_i \pm z^*
\sqrt{(\dot{\boldsymbol{\Sigma}}_u)_{i, i}}\), where \(\sqrt{(\dot{\boldsymbol{\Sigma}}_u)_{i,
i}}\) is the standard error of \((\dot{w}_u)_i\) obtained from
se.fit = TRUE, \(\Phi(z^*) = 1 -
\alpha / 2\), \(\Phi(\cdot)\) is
the standard normal (Gaussian) cumulative distribution function, \(\alpha = 1 -\) level, and
level is an argument to predict(). The default
for level is 0.95, which corresponds to a \(z^*\) of approximately 1.96. These
predictions and corresponding prediction intervals are returned on the
response scale (type = "response") by applying \(g^{-1}(\cdot)\) (inverse link) to \((\dot{w}_u)_i\) (the prediction), \((\dot{w}_u)_i - z^*
\sqrt{(\dot{\boldsymbol{\Sigma}}_u)_{i, i}}\) (the prediction
interval lower bound), and \((\dot{w}_u)_i +
z^* \sqrt{(\dot{\boldsymbol{\Sigma}}_u)_{i, i}}\) (the prediction
interval upper bound). Note that the prediction intervals are symmetric
on the link scale but are not generally symmetric on the response scale.
One could obtain symmetric prediction intervals on the response scale
using the delta method (Ver Hoef
2012).
interval = "confidence"
Estimates for \((\mathbf{X}_u)_i
\boldsymbol{\beta}\) (the fixed effects portion of the model) are
returned on the link scale (type = "link") by evaluating
\((\mathbf{X}_u)_i
\hat{\boldsymbol{\beta}}\) (i.e., fitted values corresponding to
\((\mathbf{X}_u)_i)\). The (100 \(\times\) level)% confidence
interval for \((\mathbf{X}_u)_i
\boldsymbol{\beta}\) is \((\mathbf{X}_u)_i \hat{\boldsymbol{\beta}} \pm z^*
\sqrt{(\mathbf{X}_u)_i [\mathbf{B} (-\mathbf{G}_a)^{-1} \mathbf{B}^\top
+ (\mathbf{X}^\top \hat{\boldsymbol{\Sigma}}^{-1}_o
\mathbf{X})^{-1}](\mathbf{X}_u)_i^\top}\), where \((\mathbf{X}_u)_i\) is the \(i\)th row of \(\mathbf{X}_u\), \(\mathbf{B} (-\mathbf{G}_a)^{-1} \mathbf{B}^\top +
(\mathbf{X}^\top \hat{\boldsymbol{\Sigma}}^{-1}
\mathbf{X})^{-1}\) is the standard error of \((\mathbf{X}_u)_i \hat{\boldsymbol{\beta}}\)
obtained from se.fit = TRUE, \(\Phi(z^*) = 1 - \alpha / 2\), \(\Phi(\cdot)\) is the standard normal
(Gaussian) cumulative distribution function, \(\alpha = 1 -\) level, and
level is an argument to predict(). The default
for level is 0.95, which corresponds to a \(z^*\) of approximately 1.96. These
estimates and corresponding confidence intervals are returned on the
response scale (type = "response") by applying \(g^{-1}(\cdot)\) (inverse link) to \((\mathbf{X}_u)_i \hat{\boldsymbol{\beta}}\)
(the estimate), \((\mathbf{X}_u)_i
\hat{\boldsymbol{\beta}} - z^* \sqrt{(\mathbf{X}_u)_i [\mathbf{B}
(-\mathbf{G}_a)^{-1} \mathbf{B}^\top + (\mathbf{X}^\top
\hat{\boldsymbol{\Sigma}}^{-1}_o
\mathbf{X})^{-1}](\mathbf{X}_u)_i^\top}\) (the confidence
interval lower bound), and \((\mathbf{X}_u)_i
\hat{\boldsymbol{\beta}} + z^* \sqrt{(\mathbf{X}_u)_i [\mathbf{B}
(-\mathbf{G}_a)^{-1} \mathbf{B}^\top + (\mathbf{X}^\top
\hat{\boldsymbol{\Sigma}}^{-1}_o
\mathbf{X})^{-1}](\mathbf{X}_u)_i^\top}\) (the confidence
interval upper bound). Note that the confidence intervals are symmetric
on the link scale but are generally not symmetric on the response scale.
One could obtain symmetric confidence intervals on the response scale
using the delta method (Ver Hoef
2012).
spgautor() extra steps
The extra step required to obtain \(\hat{\boldsymbol{\Sigma}}^{-1}_o\), \(\hat{\boldsymbol{\Sigma}}_u\), and \(\hat{\boldsymbol{\Sigma}}_{uo}\) is the same for spatial generalized autoregressive models as it is for spatial autoregressive models.
Big Data
predict() for big data spatial generalized linear models
is defined similarly as for big data spatial linear models, except that
\(\mathbf{w}\) are subset or predicted
(instead of \(\mathbf{y}\)) to find
\(\check{\mathbf{w}}_o\) (instead of
\(\check{\mathbf{y}}_o\)). It standard
errors are required, \(\check{\mathbf{G}}_o\) is also found.
pseudoR2()
pseudoR2() for spatial generalized linear models is
defined the same as for spatial linear models.
residuals()
The residuals are obtained by applying standard generalized linear model definitions after conditioning on \(\mathbf{w}\).
When type = "response", response residuals are returned:
\[\begin{equation*}
\mathbf{e}_{r} = \mathbf{y} - g^{-1}(\mathbf{w}).
\end{equation*}\]
When type = "pearson", Pearson residuals are returned:
\[\begin{equation*}
\mathbf{e}_{p} = \mathbf{V}^{-1/2}\mathbf{e}_{r},
\end{equation*}\] where \(\mathbf{V}\) is a diagonal matrix with
\(i\)th diagonal element equal to \(\text{Var}(w_i)\).
When type = "deviance", deviance residuals are returned:
\[\begin{equation*}
\mathbf{e}_{d} = \text{sign}(\mathbf{e}_r) \odot
\sqrt{\text{deviance}_i},
\end{equation*}\] where \(\text{deviance}_i\) is the deviance of
\(y_i\) (conditional on \(w_i\)) and \(\odot\) denotes the Hadmard (element-wise)
product.
When type = "standardized", standardized residuals are
returned: \[\begin{equation*}
\mathbf{e}_{s} = \mathbf{e}_{d} \odot \frac{1}{\sqrt{1 -
diag(\mathbf{H}_c)}},
\end{equation*}\] where \(diag(\mathbf{H}_c)\) is the diagonal of the
leverage (hat) matrix conditional on \(\mathbf{w}\) and given by \(\mathbf{H}_c \equiv \mathbf{X}_v
(\mathbf{X}_v^\top\mathbf{X}_v)^{-1} \mathbf{X}_v^\top\), where
\(\mathbf{X}_v =
\mathbf{V}^{1/2}\mathbf{X}\), and \(\odot\) denotes the Hadmard (element-wise)
product.
spgautor() and spglm()
Many of the details regarding spglm() and
spgautor() for spatial generalized linear models are the
same as splm() and spautor() for spatial
linear models, though occasional differences are noted in the following
subsection headers.
spgautor() Spatial Covariance Functions
Covariance functions for spgautor() are defined the same
as covariance functions for spautor().
spglm() Spatial Covariance Functions
Covariance functions for spglm() are defined the same as
covariance functions for splm() except that for
"none", the ie parameter is also set to zero
(analogous to glm() models).
Model-fitting
Recall that the likelihood of interest is \[\begin{equation*} \int_\mathbf{w} \exp(\ell_\mathbf{w}) d\mathbf{w} \approx [\mathbf{y} | g^{-1}(\mathbf{a}), \varphi] [\mathbf{a} | \mathbf{X}, \boldsymbol{\theta}] (2 \pi)^{n/2} |-\mathbf{G}_a|^{-1/2}|, \end{equation*}\] and that \(\mathbf{a}\) is the value at which the gradient, \(\mathbf{g}\), equals zero. Given \(\mathbf{a}\), minus twice a profiled (by \(\boldsymbol{\beta}\)) marginal Laplace log-likelihood is given by \[\begin{equation*} -2\ell_p(\varphi, \boldsymbol{\theta}) = -2\ln([\mathbf{y} | g^{-1}(\mathbf{a}), \varphi]) -2\ln([\mathbf{a} | \mathbf{X}, \boldsymbol{\theta}]) -n \ln(2 \pi) + \ln(|- \mathbf{G}_{\mathbf{a}}|). \end{equation*}\] Note that \(\ln[\mathbf{a} | \mathbf{X}, \boldsymbol{\theta}]\) are the ML or REML log-likelihood equations the spatial linear model, respectively, where now \(\tilde{\boldsymbol{\beta}} = (\mathbf{X}^\top \mathbf{\Sigma}^{-1} \mathbf{X})^{-1} \mathbf{X}^\top \mathbf{\Sigma}^{-1} \mathbf{a}\).
Assuming \(\mathbf{y}\) and \(g^{-1}(\mathbf{w})\) are conditionally independent and \(\varphi\) and \(\boldsymbol{\theta}\) are known, it can be shown that maximizing \(\ell_{\mathbf{w}}\) (with respect to \(\mathbf{w}\)) amounts to maximizing (up to a constant) \[\begin{equation*} \sum_{i = 1}^N \ln[y_i | w_i, \varphi] - \frac{1}{2}(\mathbf{w} - \mathbf{X} \hat{\boldsymbol{\beta}})^\top \boldsymbol{\Sigma}^{-1}(\mathbf{w} - \mathbf{X}\hat{\boldsymbol{\beta}}). \end{equation*}\] Thus the gradient \(\ell_{\mathbf{w}}\) can be shown to equal \[\begin{equation*} \mathbf{g} = \mathbf{d} - \boldsymbol{\Sigma}^{-1}\mathbf{w} + \boldsymbol{\Sigma}^{-1}\mathbf{X} \hat{\boldsymbol{\beta}} = \mathbf{d} - \mathbf{P}\mathbf{w}, \end{equation*}\] where \(d_i = \partial \ln[y_i | g^{-1}(w_i), \varphi] / \partial w_i\) and \(\mathbf{P} = \boldsymbol{\Sigma}^{-1} - \boldsymbol{\Sigma}^{-1} \mathbf{X} (\mathbf{X}^\top \boldsymbol{\Sigma}^{-1} \mathbf{X})^{-1} \mathbf{X}^\top \boldsymbol{\Sigma}^{-1}\). And the Hessian of \(\ell_{\mathbf{w}}\) is \[\begin{equation*} \mathbf{G} = \mathbf{D} - \mathbf{P}, \end{equation*}\] where \(D_{i, i} = \partial^2 \ln[y_i | g^{-1}(w_i), \varphi] / \partial w_i^2\). Note that \(D_{i, j} = 0\) for \(i \neq j\) because of conditional independence.
Next the Newton-Rhapson algorithm can be used to maximize \(\ell_{\mathbf{w}}\), where an update is given by \[\begin{equation*} \mathbf{w}^{k + 1} = \mathbf{w}^k - \alpha \mathbf{G}^{-1}\mathbf{g}. \end{equation*}\] where \(0 < \alpha \leq 1\). Typically, \(\alpha = 1\), but it can be lowered if the \(\mathbf{g}\) is unstable. Generally, the Newton-Rhapson converges rapidly. The value of \(\mathbf{w}\) at convergence is defined as \(\mathbf{a}\).
It follows that finding \(\varphi\) and \(\boldsymbol{\theta}\) for unknown \(\mathbf{a}\) requires a doubly-iterative algorithm. First, a value of \(\mathbf{a}\) is proposed (e.g., \(\mathbf{a} = \mathbf{0}\)). Then given \(\mathbf{a}_0\), the Laplace log-likelihood is maximized, yielding \(\hat{\varphi}_0\) and \(\hat{\boldsymbol{\theta}}_0\). Then given \(\hat{\varphi}_0\) and \(\hat{\boldsymbol{\theta}}_0\), \(\ell_{\mathbf{w}}\) is maximized, yielding \(\mathbf{a}_1\). Then given \(\mathbf{a}_1\), the Laplace log-likelihood is maximized, yielding \(\hat{\varphi}_1\) and \(\hat{\boldsymbol{\theta}}_1\). Then given \(\hat{\varphi}_1\) and \(\hat{\boldsymbol{\theta}}_1\), \(\ell_{\mathbf{w}}\) is maximized, yielding \(\mathbf{a}_2\). This process continues until convergence, yielding optimized values for \(\varphi\) and \(\boldsymbol{\theta}\) and, using these optimized values, a value of \(\mathbf{a}\).
Note that the Laplace approximation incorporates a likelihood, and as
a result, the only estimation methods available via the
estmethod argument are "reml" (the default)
and "ml". The doubly-iterative algorithm used to fit
spatial generalized linear models is far more computationally expensive
than fitting spatial linear models.
Optimization
Optimization for spglm() and spgautor()
works as it does for splm() and spautor(),
with one additional step. The convergence criteria for \(\mathbf{w}\) (within each covariance
parameter iteration) is achieved when the largest absolute value of
\(\mathbf{w}_k - \mathbf{w}_{k - 1}\)
is less than \(1/10^4\) or \(k > 50\) (\(k\) indexes the Newton-Rhapson
iterations).
Grid Search
The grid search for spglm() and spgautor()
works as it does for splm() and spautor()
except that for spglm() and spgautor(), the
grid search initial values are on the link scale and the grid search
sample variance is calculated by regressing \(\ln(\mathbf{y} + 1)\) on \(\mathbf{X}\) instead of \(\mathbf{y}\) on \(\mathbf{X}\). For negative binomial, beta,
gamma, and inverse Gaussian families, the initial value of the
dispersion parameter is set to one.
Hypothesis Testing
Hypothesis testing for spatial generalized linear models is defined the same as for spatial linear models. That is, the hypothesis tests are asymptotic z-tests based on the normal (Gaussian) distribution (Wald tests). The null hypothesis for the test associated with each \(\hat{\beta}_i\) is that \(\beta_i = 0\). The spatial generalized linear models, \(\text{Cov}(\hat{\boldsymbol{\beta}})\) requires an adjustment to account for the fact that the \(\mathbf{w}\) are not actually observed. First let \(\mathbf{B} = (\mathbf{X}^\top \boldsymbol{\Sigma}^{-1} \mathbf{X})^{-1} \mathbf{X}^\top \boldsymbol{\Sigma}^{-1}\) and note that \(\hat{\boldsymbol{\beta}} = \mathbf{B}\mathbf{w}\). Using the law of conditional variance and conditioning on \(\mathbf{w}\) as if we had observed them, it follows that \[\begin{equation*} \text{Cov}(\mathbf{B} \hat{\mathbf{w}}) = \text{E}_\mathbf{w}[\text{Cov}(\mathbf{B}\hat{\mathbf{w}} | \mathbf{w})] + \text{Cov}_\mathbf{w}[\text{E}(\mathbf{B}\hat{\mathbf{w}} | \mathbf{w})] \end{equation*}\] We assume \(\hat{\mathbf{w}}\) is unbiased for \(\mathbf{w}\) (i.e., \(\text{E}(\hat{\mathbf{w}} | \mathbf{w}) = \mathbf{w}\)). Then \(\text{Cov}(\text{E}(\mathbf{B} \hat{\mathbf{w}} | \mathbf{w})) = \text{Cov}(\mathbf{B}\mathbf{w}) = \mathbf{B} \boldsymbol{\Sigma} \mathbf{B}^\top\), which reduces to \((\mathbf{X}^\top \boldsymbol{\Sigma}^{-1} \mathbf{X})^{-1}\), the usual form for \(\text{Cov}(\hat{\boldsymbol{\beta}})\). Next note that \(\text{Cov}(\hat{\mathbf{w}} | \mathbf{w})\) can be viewed as the inverse of the observed Fisher Information, which is \(-\mathbf{G}^{-1}\), which depends on \(\mathbf{w}\) through the diagonal elements in \(\mathbf{D}\). Evaluating \(-\mathbf{G}\) at \(\mathbf{a}\) yields the adjusted covariance matrix of \(\hat{\boldsymbol{\beta}}\) given by \[\begin{equation*} \text{Cov}(\hat{\boldsymbol{\beta}}) = \mathbf{B} (-\mathbf{G}_a)^{-1} \mathbf{B}^\top + (\mathbf{X}^\top \boldsymbol{\Sigma}^{-1} \mathbf{X})^{-1} . \end{equation*}\]
Random Effects (spglm() only)
Random effects for spatial generalized linear models are defined the same as for spatial linear models. Note that random effects for spatial generalized linear models are on the link scale.
Anisotropy (spglm() only)
Anisotropy for spatial generalized linear models are defined the same as for spatial linear models. Note that anisotropy parameters for spatial generalized linear models are on the link scale.
Partition Factors
Partition factors for spatial generalized linear models are defined the same as for spatial linear models.
Big Data (spglm() only)
Big data model-fitting for spatial generalized linear models is in
many ways the same as for spatial linear models. The local
argument behaves the same for spatial generalized linear models as it
does for spatial linear models. This is because fundamentally, the
“local” spatial indexing (SPIN) approach to representing \(\boldsymbol{\Sigma}\) blockwise is still
applied and serves as the basis for massive computational gains when
fitting spatial generalized linear models (Ver
Hoef et al. 2023).
The additional step that is required to fit big data spatial generalized linear models involves efficiently manipulating the Hessian, \(\mathbf{G}\), to obtain its inverse and log determinant. Before providing further details, we review the Sherman-Morrison-Woodbury (SMW) formula (Sherman 1949; Sherman and Morrison 1950; Woodbury 1950). The SMW formula states that for an \(n \times n\) matrix \(\mathbf{A}\), an \(n \times k\) matrix \(\mathbf{U}\), a \(k \times k\) matrix \(\mathbf{C}\), and a \(k \times n\) matrix \(\mathbf{V}\), \[\begin{equation*} (\mathbf{A} + \mathbf{U} \mathbf{C} \mathbf{V})^{-1} = \mathbf{A}^{-1} - \mathbf{A}^{-1} \mathbf{U} (\mathbf{C}^{-1} + \mathbf{V}\mathbf{A}^{-1}\mathbf{U})^{-1} \mathbf{V} \mathbf{A}^{-1} \end{equation*}\] and \[\begin{equation*} |\mathbf{A} + \mathbf{U} \mathbf{C} \mathbf{V}| = |\mathbf{A}||\mathbf{C}||\mathbf{C}^{-1} + \mathbf{V}\mathbf{A}^{-1}\mathbf{U}|. \end{equation*}\] The determinant result above implies \[\begin{equation*} \ln|\mathbf{A} + \mathbf{U} \mathbf{C} \mathbf{V}| = \ln|\mathbf{A}| + \ln|\mathbf{C}| + \ln|\mathbf{C}^{-1} + \mathbf{V}\mathbf{A}^{-1}\mathbf{U}|. \end{equation*}\] The SMW formula is important because if the inverse and log determinant of \(\mathbf{A}\) is efficient to compute and \(k << n\), then the inverse and log determinant of the desired sum can also be efficient to compute. This is because except for \(\mathbf{A}^{-1}\) and \(\mathbf{|A|}\), the SMW formula only requires finding \(k \times k\) inverses and log determinants.
Recall that the Hessian can be written as \[\begin{equation*} \mathbf{G} = \mathbf{D} - \boldsymbol{\Sigma}^{-1} + \boldsymbol{\Sigma}^{-1} \mathbf{X} (\mathbf{X}^\top \boldsymbol{\Sigma}^{-1} \mathbf{X})^{-1} \mathbf{X}^\top \boldsymbol{\Sigma}^{-1}, \end{equation*}\] Because \(\boldsymbol{\Sigma}\) can be represented blockwise, \(\boldsymbol{\Sigma}^{-1}\) can be represented blockwise and thus the inverse and log determinant can be efficiently computed. Because \(\mathbf{D}\) is diagonal, \(\mathbf{D} - \boldsymbol{\Sigma}^{-1}\) can be represented blockwise and thus the inverse and log determinant can be efficiently computed. Then the SMW formula can be used, taking \(\mathbf{A} = \mathbf{D} - \boldsymbol{\Sigma}^{-1}\), \(\mathbf{U} = \boldsymbol{\Sigma}^{-1} \mathbf{X}\), \(\mathbf{C} = (\mathbf{X}^\top \boldsymbol{\Sigma}^{-1} \mathbf{X})^{-1}\), and \(\mathbf{V} = \mathbf{X}^\top \boldsymbol{\Sigma}^{-1}\).
As previously mentioned, fitting big data spatial generalized linear models requires a doubly-iterative algorithm. This makes it far more computationally expensive than fitting big data spatial linear models.
Simulation Functions (sprpois(),
sprnbinom(), sprbinom(),
sprbeta(), sprgamma(),
sprinvgauss())
Poisson, negative binomial, binomial, beta, gamma, and inverse
Gaussian random variables can be simulated using sprpois(),
sprnbinom(), sprbinom(),
sprbeta(), sprgamma(), and
sprinvgauss(), respectively. All of these functions work
similarly. First, relevant arguments are passed to
sprnorm() to simulate \(\mathbf{w}\) on the link scale. Then using
\(\mathbf{w}\) and the dispersion
parameter (when required), relevant generalized linear model random
variables are simulated independently for each \(w_i\). Note that the dispersion parameter
is not required for sprpois() and
sprbinom().
vcov()
The corrected variance-covariance matrix of the fixed effects
(var_correct = TRUE) is given by \(\mathbf{B} (-\mathbf{G}_a)^{-1} \mathbf{B}^\top +
(\mathbf{X}^\top \boldsymbol{\Sigma}^{-1} \mathbf{X})^{-1}\). The
uncorrected variance-covariance matrix
(var_correct = FALSE) is given by \(\text{Cov}(\hat{\boldsymbol{\beta}}) =
(\mathbf{X}^\top \boldsymbol{\Sigma}^{-1} \mathbf{X})^{-1}\).
Distribution Parameterizations
Below we provide definitions associated with each of the six
generalized linear models families available in spmodel.
Note that the poisson, binomial, gamma, and inverse Gaussian
distributions are members of the exponential family, and their deviance
is typically expressed as twice the difference in log-likelihoods
between the saturated and fitted model times the dispersion parameter
(consistent with glm()). The negative binomial and beta
distributions are members of the exponential family when the dispersion
parameter (\(\varphi\)) is known, and
their deviance is typically expressed as just twice the difference in
log-likelihoods between the saturated and fitted model (consistent with
glm.nb() from MASS (Venables and Ripley 2002) for negative binomial
regression and betareg() from betareg (Cribari-Neto and Zeileis 2010) for beta
regression).
Poisson Distribution
The Poisson distribution is defined as \[\begin{equation*} f(y | \mu) = \frac{\mu^y \exp(-\mu)}{y!}, \end{equation*}\] where \(y\) is a non-negative integer, \(\mu > 0\), \(\text{E}(y) = \mu\), and \(\text{Var}(y) = \mu\).
The log-likelihood (of a single observation) is defined as \[\begin{equation*} \ln f(y | \mu) = y \ln(\mu) - \mu - \ln(y!). \end{equation*}\]
Using the inverse log link and writing in terms of \(\mu = \exp(w)\), the log-likelihood can be written as \[\begin{equation*} \ln f(y | \mu) = yw - \exp(w) - \ln(y!). \end{equation*}\]
The derivative of the Poisson distribution with respect to \(w\) is \[\begin{equation*} \frac{d}{d w} \ln f(y | \mu) = y - \exp(w). \end{equation*}\]
The second derivative of the Poisson distribution with respect to \(w\) is \[\begin{equation*} \frac{d^2}{d w^2} \ln f(y | \mu) = - \exp(w). \end{equation*}\]
Twice the log-likelihood of the saturated model is \[\begin{equation*} 2 \ln f(\mathbf{y} | \boldsymbol{\mu}_s) = \sum_i y_i \ln(y_i) - y_i - \ln(y_i!). \end{equation*}\]
Twice the log-likelihood of the fitted (observed) model is \[\begin{equation*} 2 \ln f(\mathbf{y} | \hat{\boldsymbol{\mu}}) = \sum_i y_i \ln(\hat{\mu}_i) - \hat{\mu}_i - \ln(y_i!). \end{equation*}\]
Thus the deviance is \[\begin{equation*} 2 \sum_i y_i log(y_i / \hat{\mu}_i) - (y_i - \hat{\mu}_i). \end{equation*}\]
Negative Binomial Distribution
The negative binomial distribution is defined as \[\begin{equation*} f(y | \mu, \varphi) = \frac{\Gamma(y + \varphi)}{\Gamma(\varphi) y!} \left( \frac{\mu}{\mu + \varphi} \right)^y \left( \frac{\varphi}{\mu + \varphi} \right)^\varphi, \end{equation*}\] where \(y\) is a non-negative integer, \(\mu > 0\), \(\varphi > 0\), \(\text{E}(y) = \mu\), and \(\text{Var}(y) = \mu + \frac{\mu^2}{\varphi}\).
The log-likelihood (of a single observation) is defined as \[\begin{equation*} \ln f(y | \mu, \varphi) = \ln(\Gamma(y + \varphi)) - \ln(\Gamma(\varphi)) - \ln(y!) + y \ln(\mu) - y \ln(\mu + \varphi) + \varphi \ln(\varphi) - \varphi \ln(\mu + \varphi). \end{equation*}\]
Using the inverse log link and writing in terms of \(\mu = \exp(w)\), the log-likelihood can be written as \[\begin{equation*} \ln f(y | \mu) = \ln(\Gamma(y + \varphi)) - \ln(\Gamma(\varphi)) - \ln(y!) + y [w - \ln(\exp(w) + \varphi)] + \varphi [\ln(\varphi) - \ln(\exp(w) + \varphi)]. \end{equation*}\]
The derivative of the negative binomial distribution with respect to \(w\) is \[\begin{equation*} \begin{split} \frac{d}{d w} \ln f(y | \mu) & = y\left(1 - \frac{\exp(w)}{\exp(w) + \varphi}\right) + \varphi \left(- \frac{\exp(w)}{\exp(w) + \varphi} \right) \\ & = \frac{y\varphi}{\exp(w) + \varphi} - \frac{\varphi \exp(w)}{\exp(w) + \varphi} \\ & = \frac{\varphi (y - \exp(w))}{\exp(w) + \varphi}. \end{split} \end{equation*}\]
The second derivative of the negative binomial distribution with respect to \(w\) is \[\begin{equation*} \frac{d^2}{d w^2} \ln f(y | \mu) = - \frac{\varphi \exp(w) (y + \varphi)}{(\varphi + \exp(w))^2} \end{equation*}\]
Twice the log-likelihood of the saturated model is \[\begin{equation*} 2 \ln f(\mathbf{y} | \boldsymbol{\mu}_s) = \sum_i \ln(\Gamma(y_i + \varphi)) - \ln(\Gamma(\varphi)) - \ln(y_i!) + y_i \ln(y_i) - y_i \ln(y_i + \varphi) + \varphi \ln(\varphi) - \varphi \ln(y_i + \varphi). \end{equation*}\]
Twice the log-likelihood of the fitted (observed) model is \[\begin{equation*} 2 \ln f(\mathbf{y} | \hat{\boldsymbol{\mu}}) = \sum_i \ln(\Gamma(y_i + \varphi)) - \ln(\Gamma(\varphi)) - \ln(y_i!) + y_i \ln(\hat{\mu}_i) - y_i \ln(\hat{\mu}_i + \varphi) + \varphi \ln(\varphi) - \varphi \ln(\hat{\mu}_i + \varphi). \end{equation*}\]
Thus the deviance is \[\begin{equation*} 2 \sum_i y_i [\ln(y_i) - \ln(y_i + \varphi) - \ln(\hat{\mu}_i) + \ln(\hat{\mu}_i + \varphi)] + \varphi [ - \ln(y_i + \varphi) + \ln(\hat{\mu}_i + \varphi)]. \end{equation*}\]
Binomial Distribution
The binomial distribution is defined as \[\begin{equation*} f(y | \mu, m) = \binom{m}{y} \mu^y (1 - \mu)^{m - y}, \end{equation*}\] where \(m\) is the (known) number of Bernoulli trials, \(y\) is a non-negative integer, \(0 \le \mu \le 1\), \(\text{E}(y) = m\mu\), and \(\text{Var}(y) = m\mu (1 - \mu)\).
The log-likelihood (of a single observation) is defined as \[\begin{equation*} \ln f(y | \mu) = \ln \left[ \binom{m}{y} \right] + y \ln(\mu) + (m - y) \ln(1 - \mu). \end{equation*}\]
Using the inverse logit link and writing in terms of \(\mu = \exp(w) / (1 + \exp(w))\), the log-likelihood can be written as \[\begin{equation*} \ln f(y | \mu) = \ln \left[ \binom{m}{y} \right] + y \ln(\exp(w) / (1 + \exp(w))) + (m - y) \ln(1 - \exp(w) / (1 + \exp(w))). \end{equation*}\]
The derivative of the binomial distribution with respect to \(w\) is \[\begin{equation*} \frac{d}{d w} \ln f(y | \mu) = y - \frac{m \exp(w)}{1 + \exp(w)} \end{equation*}\]
The second derivative of the binomial distribution with respect to \(w\) is \[\begin{equation*} \frac{d^2}{d w^2} \ln f(y | \mu) = - \frac{m \exp(w)}{(1 + \exp(w))^2}. \end{equation*}\]
Twice the log-likelihood of the saturated model is \[\begin{equation*} 2 \ln f(\mathbf{y} | \boldsymbol{\mu}_s) = \sum_i \ln \left[ \binom{m_i}{y_i} \right] + y_i \ln(y_i) + (m_i - y_i) \ln(m_i - y_i). \end{equation*}\]
Twice the log-likelihood of the fitted (observed) model is \[\begin{equation*} 2 \ln f(\mathbf{y} | \hat{\boldsymbol{\mu}}) = \sum_i \ln \left[ \binom{m_i}{y_i} \right] + y_i \ln(m_i\hat{\mu}_i) + (m_i - y_i) \ln(m_i - m_i \hat{\mu}_i). \end{equation*}\]
Thus the deviance is \[\begin{equation*} 2 \sum_i y_i[ \ln(y_i) - \ln(m_i \hat{\mu}_i)] + (m_i - y_i)[ \ln(m_i - y_i) - \ln(m_i - m_i \hat{\mu}_i) ] \end{equation*}\]
Beta Distribution
The beta distribution is defined as \[\begin{equation*} f(y | \mu, \varphi) = \frac{\Gamma(\varphi)}{\Gamma(\mu \varphi) \Gamma((1 - \mu)\varphi)} y^{\mu \varphi - 1} (1 - y)^{(1 - \mu)\varphi - 1}, \end{equation*}\] where \(0 < y < 1\), \(0 < \mu < 1\), \(\text{E}(y) = \mu\), and \(\text{Var}(y) = \mu (1 - \mu) / (1 + \varphi)\).
The log-likelihood (of a single observation) is defined as \[\begin{equation*} \ln f(y | \mu) = \ln(\Gamma(\varphi)) - \ln(\Gamma(\mu \varphi)) - \ln(\Gamma((1 - \mu)\varphi)) + (\mu \varphi - 1) \ln(y) + ((1 - \mu)\varphi - 1) \ln(1 - y). \end{equation*}\]
Using the inverse logit link and writing in terms of \(\mu = \exp(w)\), the log-likelihood can be written as \[\begin{equation*} \begin{split} \ln f(y | \mu, \varphi) & = \ln(\Gamma(\varphi)) - \ln(\Gamma(\frac{\exp(w)}{1 + \exp(w)} \varphi)) - \ln(\Gamma((1 - \frac{\exp(w)}{1 + \exp(w)})\varphi)) \\ & + (\frac{\exp(w)}{1 + \exp(w)} \varphi - 1) \ln(y) + ((1 - \frac{\exp(w)}{1 + \exp(w)})\varphi - 1) \ln(1 - y). \end{split} \end{equation*}\]
It can be shown that the derivative of beta distribution with respect to \(w\) is \[\begin{equation*} \frac{d}{d w} \ln f(y | \mu) = - \frac{\varphi \exp(w) k_0(w | y, \varphi)}{(1 + \exp(w))^2}, \end{equation*}\] where \(k_0(w | y, \varphi) = \psi^{(0)}(\frac{\varphi \exp(w)}{1 + \exp(w)}) - \psi^{(0)}(\frac{\varphi}{1 + \exp(w)}) + \ln( \frac{1}{y} - 1)\) and \(\psi^{(0)}\) is the \(0th\) derivative of the digamma function.
It can be shown that the second derivative of the beta distribution with respect to \(w\) is \[\begin{equation*} \frac{d^2}{d w^2} \ln f(y | \mu) = - \frac{\varphi \exp(2w) k_1(w | y, \varphi)}{(1 + \exp(w))^4}, \end{equation*}\] where \(k_1(w | y, \varphi) = \varphi [\psi^{(1)}(\frac{\varphi \exp(w)}{1 + \exp(w)}) + \psi^{(1)}( \frac{\varphi}{1 + \exp(w)})] - 2\sinh(w)[k_0(w | y, \varphi) + 2\tanh^{-1}(1 - 2y)]\) and \(\psi^{(n)}\) is the \(nth\) derivative of the digamma function.
Twice the log-likelihood of the saturated model is \[\begin{equation*} 2 \ln f(\mathbf{y} | \boldsymbol{\mu}_s) = \sum_i \ln(\Gamma(\varphi)) - \ln(\Gamma(y_i \varphi)) - \ln(\Gamma((1 - y_i)\varphi)) + (y_i \varphi - 1) \ln(y_i) + ((1 - y_i)\varphi - 1) \ln(1 - y_i). \end{equation*}\]
Twice the log-likelihood of the fitted (observed) model is \[\begin{equation*} 2 \ln f(\mathbf{y} | \hat{\boldsymbol{\mu}}) = \ln(\Gamma(\varphi)) - \ln(\Gamma(\hat{\mu}_i \varphi)) - \ln(\Gamma((1 - \hat{\mu}_i)\varphi)) + (\hat{\mu}_i \varphi - 1) \ln(y_i) + ((1 - \hat{\mu}_i)\varphi - 1) \ln(1 - y_i). \end{equation*}\]
Thus the deviance is \[\begin{equation*} 2 \sum_i - \ln(\Gamma(y_i \varphi)) - \ln(\Gamma((1 - y_i) \varphi )) + \ln(\Gamma(\hat{\mu}_i \varphi)) + \ln(\Gamma((1 - \hat{\mu}_i) \varphi )) + (y_i - \hat{\mu}_i) \varphi \ln(y_i) + (\hat{\mu}_i - y_i) \varphi \ln(1 - y_i) \end{equation*}\]
Sometimes the deviance contribution from the \(i\)th observation can be computationally unstable and yield a negative value (Espinheira et al. 2008). This can happen, for example, when \(y_i\) is close to zero or one. When this happens, the deviance contribution is truncated to zero to reflect the fact that the theoretical deviance contribution must be non-negative.
Gamma Distribution
The gamma distribution is defined as \[\begin{equation*} f(y | \mu, \varphi) = \frac{1}{\Gamma(\varphi)} \left( \frac{\varphi}{\mu} \right)^\varphi y^{\varphi - 1} \exp(\frac{-y \varphi}{\mu}), \end{equation*}\] where \(y > 0\), \(\mu > 0\), \(\text{E}(y) = \mu\), and \(\text{Var}(y) = \mu^2/\varphi\).
The log-likelihood (of a single observation) is defined as \[\begin{equation*} \ln f(y | \mu) = - \ln(\Gamma(\varphi)) + \varphi [\ln(\varphi) - \ln(\mu)] + (\varphi - 1) \ln(y) - \frac{y \varphi}{\mu}. \end{equation*}\]
Using the inverse log link and writing in terms of \(\mu = \exp(w)\), the log-likelihood can be written as \[\begin{equation*} \ln f(y | \mu) = - \ln(\Gamma(\varphi)) \varphi [\ln(\varphi) - w] + (\varphi - 1) \ln(y) - \frac{y \varphi}{\exp(w)}. \end{equation*}\]
The derivative of the gamma distribution with respect to \(w\) is \[\begin{equation*} \frac{d}{d w} \ln f(y | \mu) = -\varphi + \frac{\varphi y}{\exp(w)}. \end{equation*}\]
The second derivative of the gamma distribution with respect to \(w\) is \[\begin{equation*} \frac{d^2}{d w^2} \ln f(y | \mu) = - \frac{\varphi y}{\exp(w)}. \end{equation*}\]
Twice the log-likelihood of the saturated model is \[\begin{equation*} 2 \ln f(\mathbf{y} | \boldsymbol{\mu}_s) = - \ln(\Gamma(\varphi)) + \varphi [\ln(\varphi) - \ln(y_i)] + (\varphi - 1) \ln(y_i) - \frac{y_i \varphi}{y_i}. \end{equation*}\]
Twice the log-likelihood of the fitted (observed) model is \[\begin{equation*} 2 \ln f(\mathbf{y} | \hat{\boldsymbol{\mu}}) = \sum_i y_i - \ln(\Gamma(\varphi)) + \varphi [\ln(\varphi) - \ln(\hat{\mu}_i)] + (\varphi - 1) \ln(y_i) - \frac{y_i \varphi}{\hat{\mu}_i}. \end{equation*}\]
Thus the deviance is \[\begin{equation*} 2 \sum_i - \ln(\frac{y}{\hat{\mu}_i}) + \frac{y - \hat{\mu}_i}{\hat{\mu}_i} \end{equation*}\] after scaling by \(\varphi\).
Inverse Gaussian Distribution
The inverse Gaussian distribution is defined as \[\begin{equation*} f(y | \mu, \varphi) = \sqrt{\frac{\varphi \mu}{2 \pi y^3}} \exp \left( - \frac{\varphi (y - \mu^2)}{2 \mu y} \right), \end{equation*}\] where \(y > 0\), \(\mu > 0\), \(\text{E}(y) = \mu\), and \(\text{Var}(y) = \mu^2/\varphi\).
The log-likelihood (of a single observation) is defined as \[\begin{equation*} \ln f(y | \mu) = \frac{1}{2}[\ln(\varphi / 2 \pi y^3) + \ln(\mu)] - \varphi \frac{(y - \mu)^2}{2 \mu y}. \end{equation*}\]
Using the inverse log link and writing in terms of \(\mu = \exp(w)\), the log-likelihood can be written as \[\begin{equation*} \ln f(y | \mu) = \frac{1}{2}[\ln(\varphi / 2 \pi y^3) + w] - \varphi \frac{(y - \exp(w))^2}{2 \exp(w) y}. \end{equation*}\]
The derivative of the gamma distribution with respect to \(w\) is \[\begin{equation*} \frac{d}{d w} \ln f(y | \mu) = \varphi \left( \frac{y}{2 \exp(w)} - \frac{\exp(w)}{2y} \right) + \frac{1}{2}. \end{equation*}\]
The second derivative of the gamma distribution with respect to \(w\) is \[\begin{equation*} \frac{d^2}{d w^2} \ln f(y | \mu) = - \frac{\varphi(\exp(2w) + y^2)}{2y\exp(w)}. \end{equation*}\]
Note that this is not a typical parameterization of the inverse Gaussian distribution. The typical parameterization of the inverse Gaussian distribution is \[\begin{equation*} f(y | \mu, \lambda) = \sqrt{\frac{\lambda}{2 \pi y^3}} \exp \left( - \frac{\lambda(y - \mu)^2}{2u^2y} \right), \end{equation*}\] where \(y > 0\), \(\mu > 0\), \(\text{E}(y) = \mu\), and \(\text{Var}(y) = \mu^3/\lambda\), and \(\lambda = \mu \varphi\).
Twice the log-likelihood of the saturated model is \[\begin{equation*} 2 \ln f(\mathbf{y} | \boldsymbol{\mu}_s) = \frac{1}{2} \left( \frac{\lambda}{2 \pi y_i^3} \right) \end{equation*}\]
Twice the log-likelihood of the fitted (observed) model is \[\begin{equation*} 2 \ln f(\mathbf{y} | \hat{\boldsymbol{\mu}}) = \frac{1}{2} \left( \frac{\lambda}{2 \pi y_i^3} \right) - \frac{\lambda (y_i - \hat{\mu}_i)^2}{2 \hat{\mu}_i^2 y_i}. \end{equation*}\]
Thus the deviance is \[\begin{equation*} \sum_i (y_i - \hat{\mu}_i)^2 / (\hat{\mu}_i^2 y_i), \end{equation*}\] after scaling by \(\lambda\).
Table of Inverse Link Functions, \(d_i\), and \(D_{i, i}\)
The following table contains a table of inverse link functions, \(d_i\), and \(D_{i, i}\) for each spatial generalized linear model family. See more details for each family in the previous subsections.
| Family | \(u = g^{-1}(w)\) | \(d_i\) | \(D_{i,i}\) |
|---|---|---|---|
| Poisson | \(\mu = \exp(w)\) | \(y_i - \exp(w_i)\) | \(- \exp(w_i)\) |
| Negative Binomial | \(\mu = \exp(w)\) | \(\frac{\varphi (y_i - \exp(w_i))}{\exp(w_i) + \varphi}\) | \(- \frac{\varphi \exp(w_i) (y_i + \varphi)}{(\varphi + \exp(w_i))^2}\) |
| Binomial | \(\mu = \frac{\exp(w)}{1 + \exp(w)}\) | \(y_i - \frac{m_i \exp(w_i)}{1 + \exp(w_i)}\) | \(- \frac{m_i \exp(w_i)}{(1 + \exp(w_i))^2}\) |
| Beta | \(\mu = \frac{\exp(w)}{1 + \exp(w)}\) | \(- \frac{\varphi \exp(w_i) k_0(w_i | y_i, \varphi)}{(1 + \exp(w_i))^2}\) | \(- \frac{\varphi \exp(2w_i) k_1(w_i | y_i, \varphi)}{(1 + \exp(w_i))^4}\) |
| Gamma | \(\mu = \exp(w)\) | \(-\varphi + \frac{\varphi y_i}{\exp(w_i)}\) | \(- \frac{\varphi y_i}{\exp(w_i)}\) |
| Inverse Gaussian | \(\mu = \exp(w)\) | \(\varphi \left( \frac{y_i}{2 \exp(w_i)} - \frac{\exp(w_i)}{2y_i} \right) + \frac{1}{2}\) | \(- \frac{\varphi(\exp(2w_i) + y_i^2)}{2y_i\exp(w_i)}\) |
The Empirical Semivariogram and Autocovariance (esv()
and eacf())
The empirical semivariogram is a moment-based estimate of the
theoretical semivariogram. The empirical semivariogram quantifies half
of the average squared difference in the response among observations in
several distance classes. More formally, the empirical semivariogram,
\(\hat{\gamma}(h)\), is defined as
\[\begin{equation}\label{eq:esv}
\hat{\gamma}(h) = \frac{1}{2|N(h)|} \sum_{N(h)} (y_i - y_j)^2,
\end{equation}\] where \(N(h)\)
is the set of observations in \(\mathbf{y}\) that are \(h\) distance apart (distance classes) and
\(|N(h)|\) is the cardinality of \(N(h)\) (Cressie
1993). Often the set \(N(h)\)
contains observations that are \(h \pm
c\) apart, where \(c\) is some
constant. This approach is known as “binning” the empirical
semivariogram. The default in spmodel is to construct the
semivariogram using 15 equally spaced bins where \(h\) is contained in \((0, h_{max}]\), and \(h_{max}\) is known as a “distance cutoff”.
Distance cutoffs are commonly used when constructing \(\hat{\gamma}(h)\) because there tend to be
few pairs with large distances. The default in spmodel is
to use a cutoff of half the maximum distance (hypotenuse) of the
domain’s bounding box. Because we are typically interested in
characterizing residual semivariance, \(y_i\) and \(y_j\) tend to represent residuals from an
ordinary least squares fit given some fixed effects design matrix, \(\mathbf{X}\), and fixed effects, \(\hat{\boldsymbol{\beta}}\).
The main purpose of the empirical semivariogram is its use in semivariogram weighted least squares estimation for spatial linear models, though it can also be used as a visual diagnostic to assess the fit of a spatial covariance function.
The empirical semivariogram is closely related to the empirical
autocovariance (Zimmerman and Ver Hoef
2024). The empirical autocovariance quantifies the average
covariance among observations in several distance classes. Using similar
notation as for the empirical semivariogram, \[\begin{equation}\label{eq:eacf}
\hat{eacf}(h) = \frac{1}{|N(h)|} \sum_{N(h)} (y_i - \hat{y})(y_j -
\hat{y}),
\end{equation}\] where \(\hat{y} =
\bar{y}\), the sample mean of all the observations. Like with
esv(), the default is to use 15 equally spaced bins with a
distance cutoff of half the maximum distance (hypotenuse) of the
domain’s bounding box. Because we are typically interested in
characterizing residual autocovariance, \(y_i
- \hat{y}\) and \(y_j -
\hat{y}\) tend to represent residuals from an ordinary least
squares fit given some fixed effects design matrix, \(\mathbf{X}\), and fixed effects, \(\hat{\boldsymbol{\beta}}\).
A Note on Covariance Square Roots and Inverse Products
Often \(\boldsymbol{\Sigma}^{-1}\) is not strictly needed for estimation, prediction, or other purposes, but at least the product between \(\boldsymbol{\Sigma}^{-1}\) and some other matrix is needed. Consider the example of the covariance matrix of \(\hat{\boldsymbol{\beta}}\) and observe \(\mathbf{X}^\top \boldsymbol{\Sigma}^{-1} \mathbf{X}\) is needed. The most direct way to find this product is certainly to obtain \(\boldsymbol{\Sigma}^{-1}\) and then multiply by \(\mathbf{X}^\top\) on the left and \(\mathbf{X}\) on the right. This is both computationally expensive and cannot be used to compute products that involve \(\boldsymbol{\Sigma}^{-1/2}\), which are often useful. It is helpful to define \(\boldsymbol{\Sigma} = \mathbf{S} \mathbf{S}^\top\) for some matrix \(\mathbf{S}\) and rewrite \(\mathbf{X}^\top \boldsymbol{\Sigma}^{-1} \mathbf{X}\) as \(\mathbf{X}^\top (\mathbf{S}^\top)^{-1} \mathbf{S}^{-1} \mathbf{X} = (\mathbf{S}^{-1} \mathbf{X})^\top \mathbf{S}^{-1} \mathbf{X}\). Then one computes the inverse products by finding \(\mathbf{S}\).
One way to find \(\mathbf{S}\) is to use an eigendecomposition. The eigendecomposition of \(\boldsymbol{\Sigma}\) (which is real and symmetric) is given by \[\begin{equation*} \boldsymbol{\Sigma} = \mathbf{U} \mathbf{D} \mathbf{U}^\top, \end{equation*}\] where \(\mathbf{U}\) is an orthogonal matrix of eigenvectors of \(\boldsymbol{\Sigma}\) and \(\mathbf{D}\) is a diagonal matrix with eigenvalues of \(\boldsymbol{\Sigma}\) on the diagonal. Then taking \(\mathbf{S} = \mathbf{U}\mathbf{D}^{1/2}\) implies \(\mathbf{S}^{-1} = \mathbf{D}^{-1/2} \mathbf{U}^\top\), which follows because \(\mathbf{U}\) is orthonormal (\(\mathbf{U}^{-1} = \mathbf{U}^\top\)) and is straightforward to calculate as \(\mathbf{D}^{1/2}\) is diagonal. Also notice that \(\boldsymbol{\Sigma}^{1/2} = \mathbf{U} \mathbf{D}^{1/2} \mathbf{U}^\top\), where \(\mathbf{D}^{1/2}\) is a diagonal matrix with square roots of eigenvalues of \(\boldsymbol{\Sigma}\) on the diagonal. This result follows because \[\begin{equation*} \boldsymbol{\Sigma}^{1/2}\boldsymbol{\Sigma}^{1/2} = \mathbf{U} \mathbf{D}^{1/2} \mathbf{U}^\top \mathbf{U} \mathbf{D}^{1/2} \mathbf{U}^\top = \mathbf{U} \mathbf{D}^{1/2} (\mathbf{U}^\top \mathbf{U}) \mathbf{D}^{1/2} \mathbf{U}^\top = \mathbf{U} \mathbf{D} \mathbf{U}^\top = \boldsymbol{\Sigma}. \end{equation*}\] So not only does the eigendecomposition approach give us the inverse products, it also gives us \(\boldsymbol{\Sigma}^{1/2}\) and \(\boldsymbol{\Sigma}^{-1/2}\). While straightforward, this approach is less efficient than the Cholesky decomposition (Golub and Van Loan 2013), which we discuss next.
The Cholesky decomposition decomposes \(\boldsymbol{\Sigma}\) into the product between \(\mathbf{C}\) and \(\mathbf{C}^\top\) (\(\boldsymbol{\Sigma} = \mathbf{C}\mathbf{C}^\top\)), where \(\mathbf{C}\) is a lower triangular matrix. Note that \(\mathbf{C}\) is generally not equal to \(\boldsymbol{\Sigma}^{1/2}\). Taking \(\mathbf{S}\) to be \(\mathbf{C}\), we see that finding the inverse products requires solving \(\mathbf{C}^{-1}\mathbf{X}\). Observe that \(\mathbf{C}^{-1}\mathbf{X} = \mathbf{A}\) for some matrix \(\mathbf{A}\). This implies \(\mathbf{X} = \mathbf{C}\mathbf{A}\), which for \(\mathbf{A}\) can be efficiently solved using forward substitution because \(\mathbf{C}\) is lower triangular.
The products in this document that involve \(\boldsymbol{\Sigma}^{1/2}\) and \(\boldsymbol{\Sigma}^{-1}\) are generally
implemented in spmodel using \(\mathbf{C}\) and \(\mathbf{C}^{-1}\). The products in this
document that involve \(\boldsymbol{\Sigma}^{-1/2}\) still rely on
an eigendecomposition (because recall that generally, \(\mathbf{C}^{-1} \mathbf{A} \neq
\boldsymbol{\Sigma}^{-1/2} \mathbf{A}\)). An example is computing
the Pearson residuals.
A Note on Computational Stability
Spatial covariance matrices that have approximately no independent
error variance (\(\sigma^2_{ie}\)) can
have unstable inverses. When this occurs, a small value can be added to
the diagonal of the covariance matrix (via updating \(\sigma^2_{ie}\)) to impose some
computational stability. In spmodel, if \(\sigma^2_{ie}\) is approximately zero, a
small amount is added to the diagonal of the covariance matrix.
Specifically, for spatial linear models, \(\sigma^2_{ie, up} = \text{max}(\sigma^2_{ie},
\sigma^2_{de}/10^4)\), where \(\sigma^2_{ie, up}\) denotes an “updated”
version of \(\sigma^2_{ie}\). For
spatial generalized linear models, \(\sigma^2_{ie, up} = \text{max}(\sigma^2_{ie},
\sigma^2_{de}/10^4, d)\), where d = \(1/10^4\). Previously (spmodel
v\(\le 0.8.0\)), \(d = \text{min}(1/10^4, s^2/10^4)\), where
\(s^2\) is the sample variance of a
linear regression of \(\ln(\mathbf{y} +
1)\) on \(\mathbf{X}\). This
value of \(\sigma^2_{ie, up}\) is also
added to the diagonal of \(\mathbf{X}^\top
\boldsymbol{\Sigma}^{-1} \mathbf{X} + \mathbf{X}^\top
\boldsymbol{\Sigma}^{-1} (\mathbf{D} - \boldsymbol{\Sigma}^{-1})^{-1}
\boldsymbol{\Sigma}^{-1} \mathbf{X}\), used via the
Sherman-Morrison-Woodbury formula required to efficiently find the log
determinant and inverse of the Hessian, \(\mathbf{G}\), when using spatial indexing
for big data. For more on stability of spatial covariance matrices, see
Diamond and Armstrong (1984), Posa (1989), O’Dowd
(1991), Ababou et al. (1994), Booker et al. (1999), Martin and Simpson (2005), Bivand et al. (2013), and Ver Hoef (2018), among others.