Function creates a ggplot2 pie chart showing the relative proportions of values in a given field in a TADA dataset.
Arguments
- .data
TADA dataframe
- field
The field (column) the user would like to see represented in a pie chart.
- characteristicName
Optional. Defaults to "null". A vector of TADA-converted (all caps) WQP characteristics a user may provide to filter the results to one or more characteristics of interest. "null" will show a summary table for the whole dataset.
Examples
# Load example dataset:
utils::data(Data_Nutrients_UT)
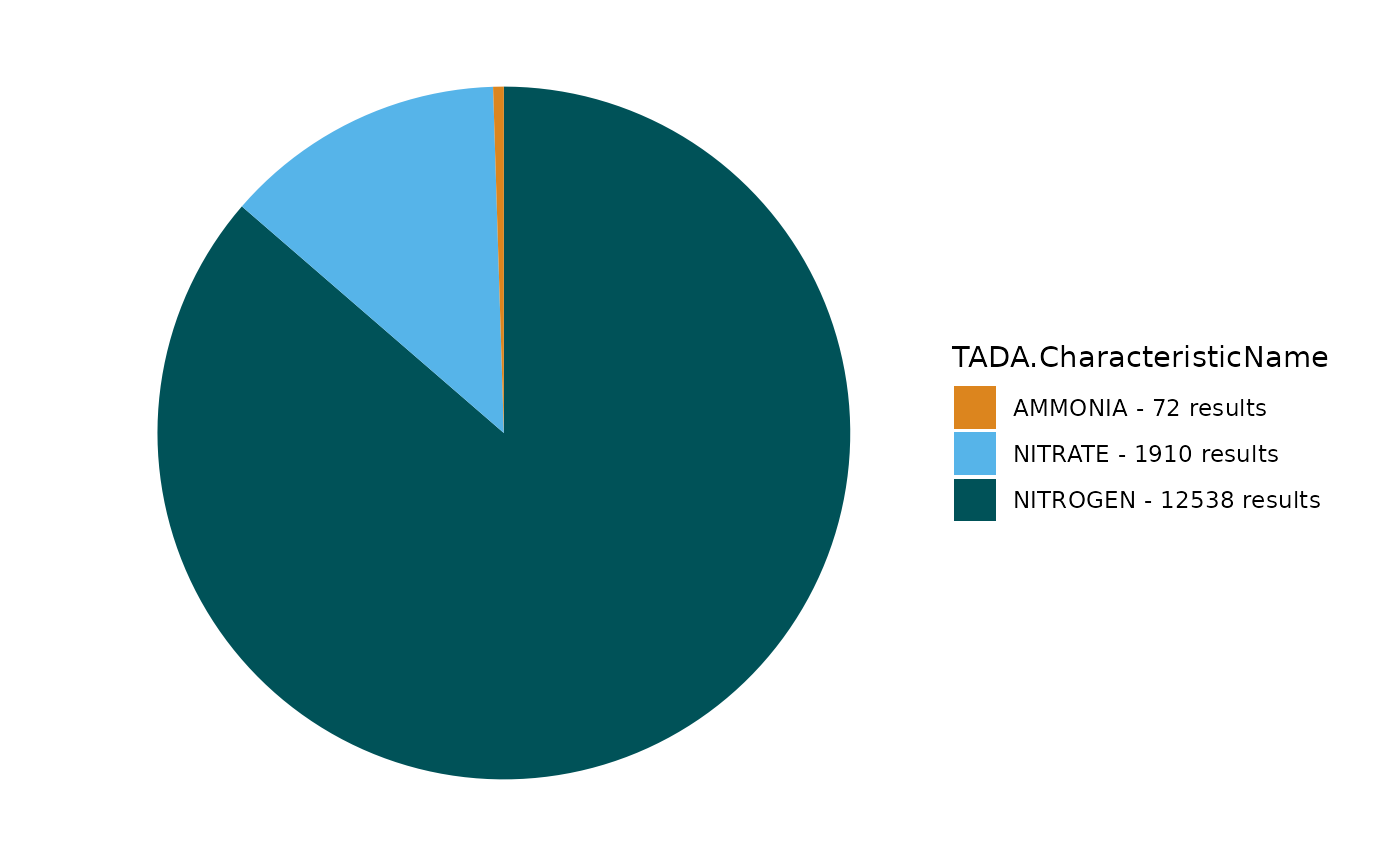
# Create a list of parameters in the dataset and the number of records of
# each parameter:
TADA_FieldValuesPie(Data_Nutrients_UT, field = "TADA.CharacteristicName")
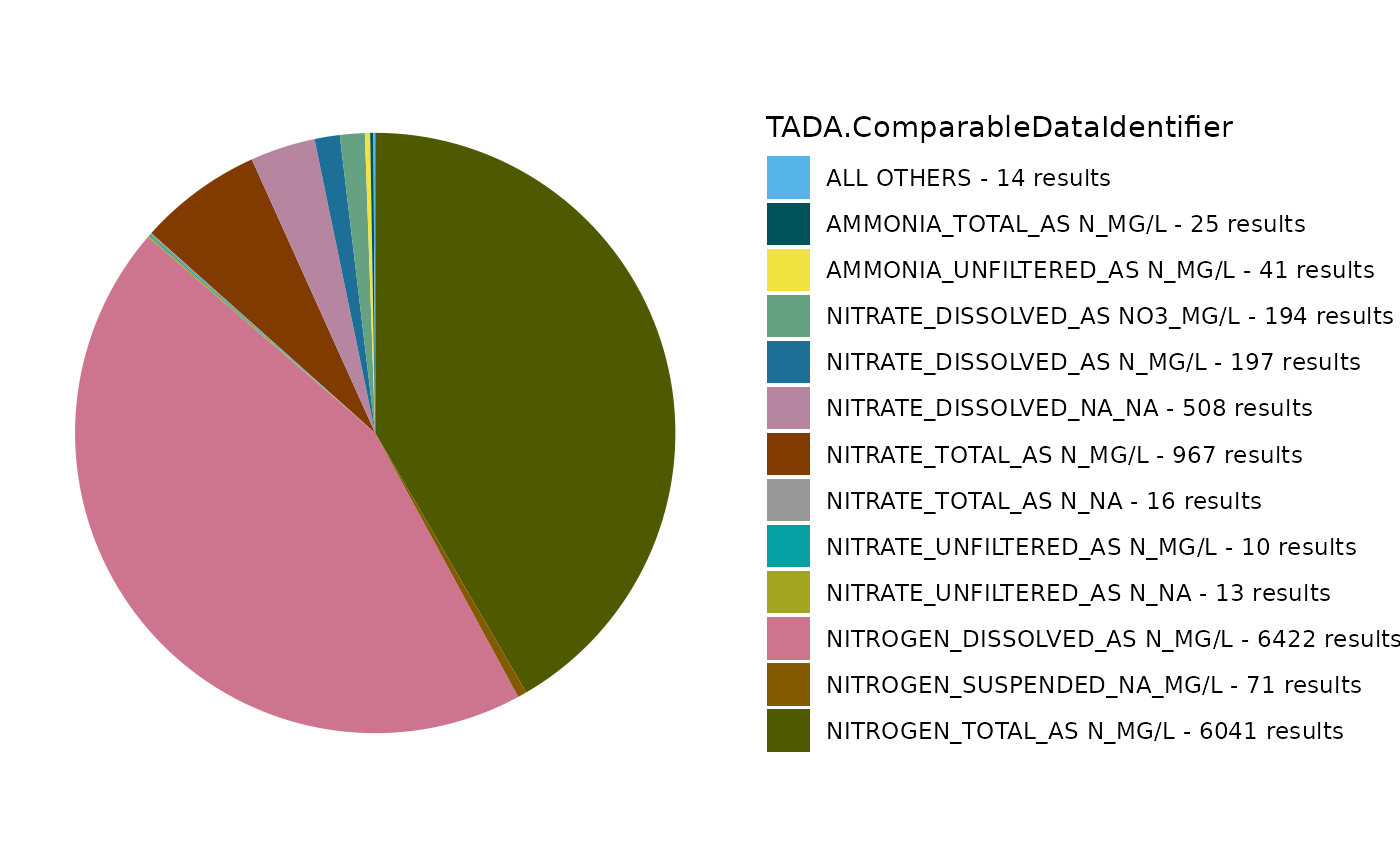
 # If there are more than 12 categories to display, any remaining categories,
# the ones that have the smallest number of results,
# are combined into an "ALL OTHERS" category.
TADA_FieldValuesPie(Data_Nutrients_UT,
field =
"TADA.ComparableDataIdentifier"
)
# If there are more than 12 categories to display, any remaining categories,
# the ones that have the smallest number of results,
# are combined into an "ALL OTHERS" category.
TADA_FieldValuesPie(Data_Nutrients_UT,
field =
"TADA.ComparableDataIdentifier"
)