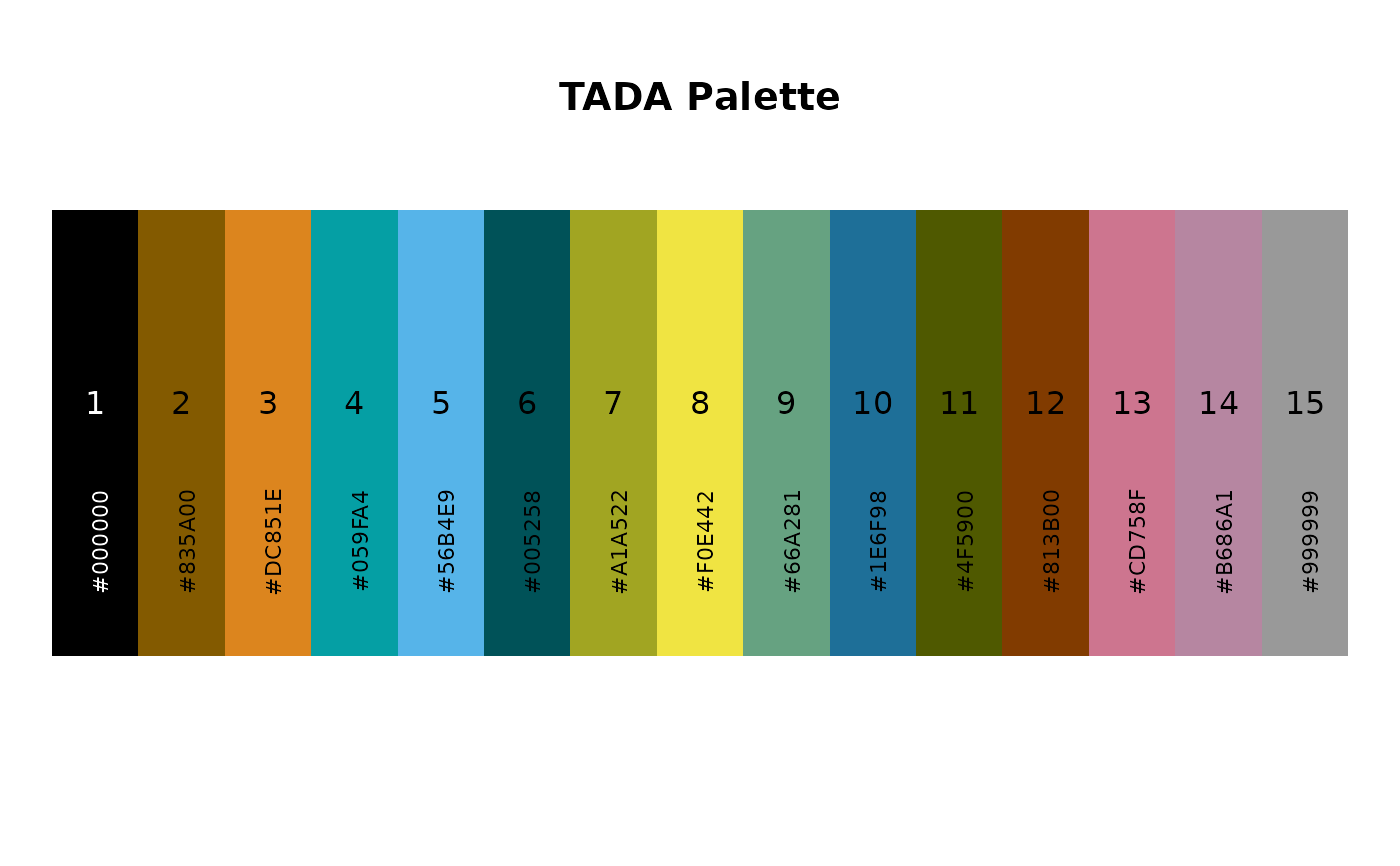
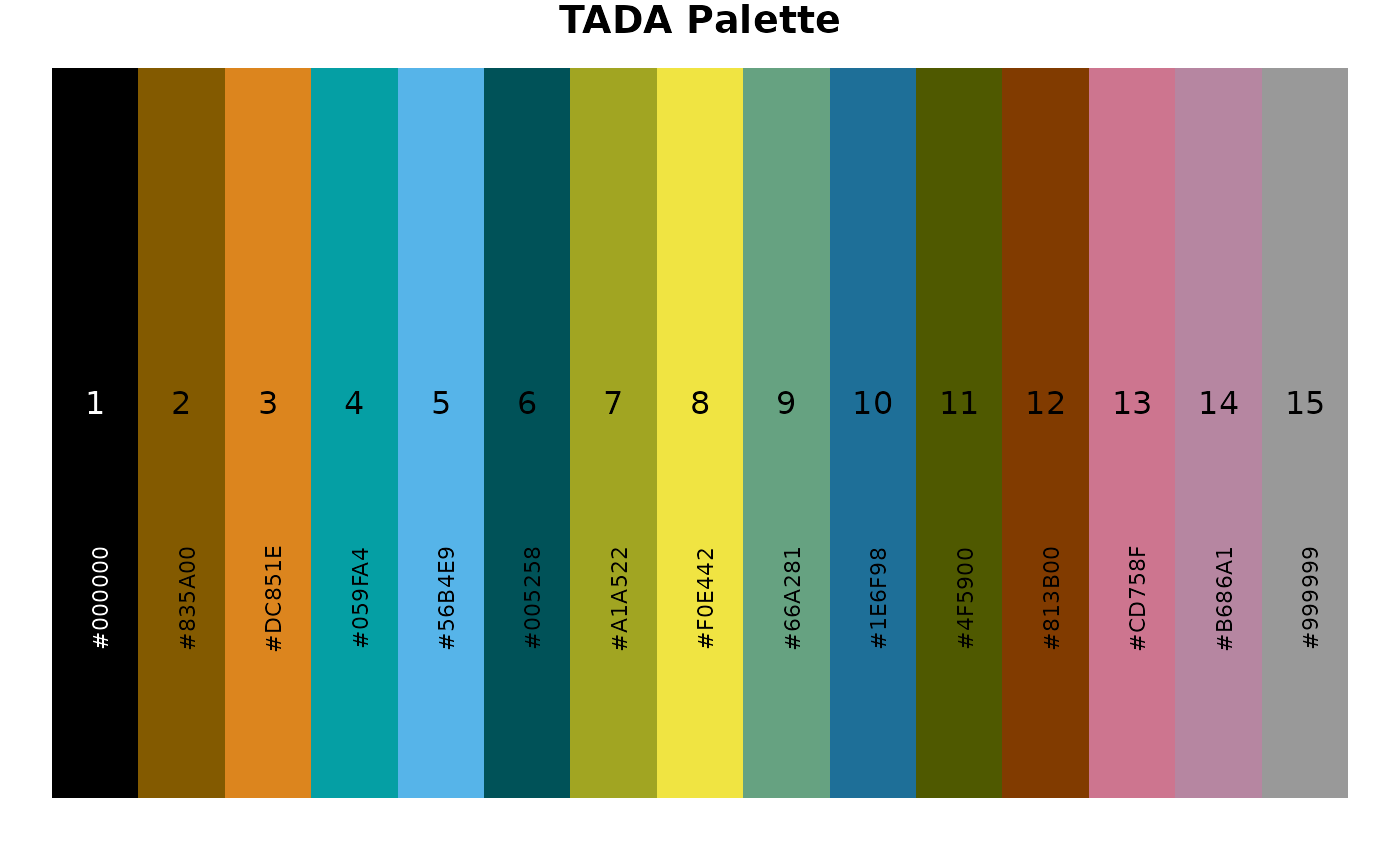
View a swatch of the colors in the TADA Color palette labeled by color and
index number. TADA developers can reference this function when deciding which
colors to use in TADA visualizations. TADA users can also reference this
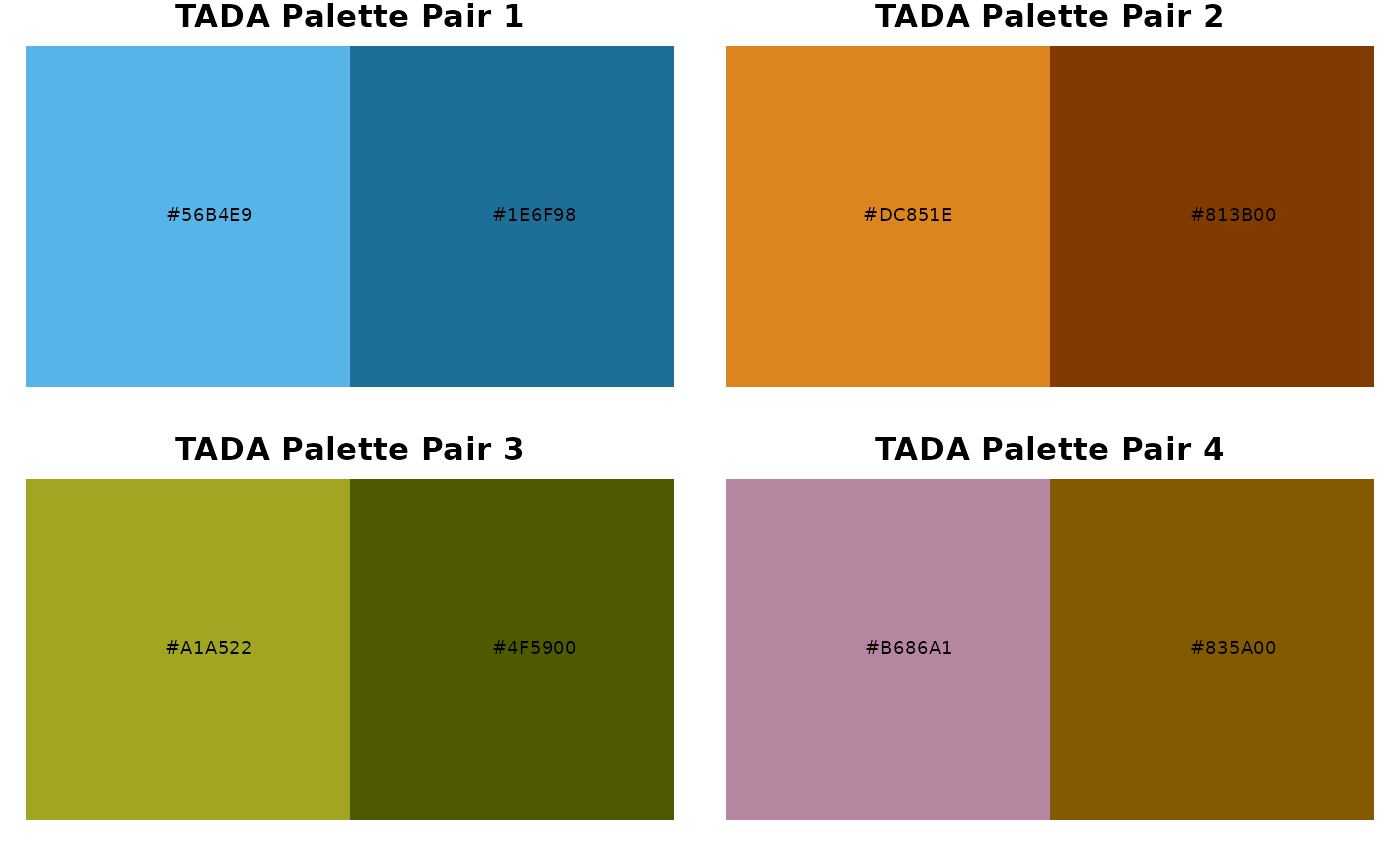
palette function to create their own visually consistent figures. TADA consistent
color pairings when col_pair = TRUE can be viewed in a matrix format.
Usage
TADA_ViewColorPalette(col_pair = FALSE)
Arguments
- col_pair
Boolean argument. Optional argument to view consistent color
pairings for outlines/fills of TADA figures defined by the row values in a dataframe.
Value
A color swatch figure based on the TADA color palette.
Examples
TestViewPalette <- TADA_ViewColorPalette()

TestViewPalettePairing <- TADA_ViewColorPalette(col_pair = TRUE)


