pybmds Quickstart
The pybmds package is designed for those familiar with basic scripting in languages like R or Python. In Python there are many different environments (jupyter notebooks, ipython, RStudio, Sypder, etc) commonly used for scripting; the example below will work in any of them.
The following example is recommended for people already familiar with scripting.
To create a dataset and fit a suite of dose-response models to the dataset:
import pybmds

# create a dataset
dataset = pybmds.DichotomousDataset(
    doses=[0, 10, 50, 150, 400],
    ns=[25, 25, 24, 24, 24],
    incidences=[0, 3, 7, 11, 15],
)

# create a BMD session
session = pybmds.Session(dataset=dataset)

# add all default models
session.add_default_models()

# execute the session
session.execute()

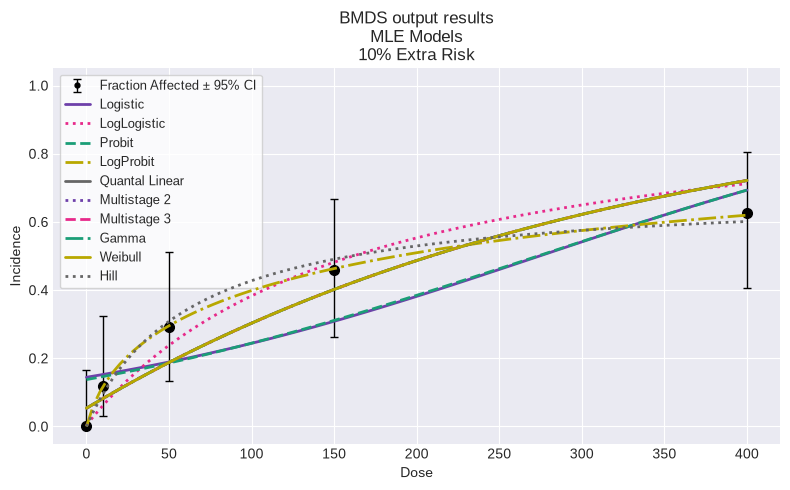
# show a summary figure
session.plot(colorize=True)
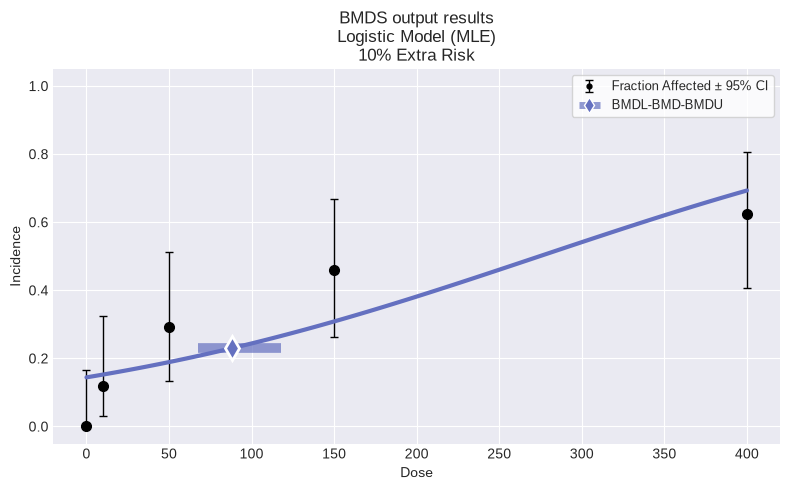
Show the first model output from the current session (i.e. Logistic):
first_model = session.models[0]
first_model.plot()
Detailed outputs are available with the results attribute on each model, or you can view a text summary of the model fit:
print(first_model.text())
        Logistic Model
══════════════════════════════

Version: pybmds 25.2 (bmdscore 25.2)

Input Summary:
╒══════════════════════════════╤══════════════════════════╕
│ BMR                          │ 10% Extra Risk           │
│ Confidence Level (one sided) │ 0.95                     │
│ Modeling approach            │ frequentist_unrestricted │
╘══════════════════════════════╧══════════════════════════╛

Parameter Settings:
╒═════════════╤═══════════╤═══════╤═══════╕
│ Parameter   │   Initial │   Min │   Max │
╞═════════════╪═══════════╪═══════╪═══════╡
│ a           │         0 │   -18 │    18 │
│ b           │         0 │     0 │   100 │
╘═════════════╧═══════════╧═══════╧═══════╛

Modeling Summary:
╒════════════════╤═════════════╕
│ BMD            │  88.0158    │
│ BMDL           │  67.4179    │
│ BMDU           │ 117.983     │
│ AIC            │ 128.521     │
│ Log-Likelihood │ -62.2605    │
│ P-Value        │   0.0278225 │
│ Overall d.f.   │   3         │
│ Chi²           │   9.11325   │
╘════════════════╧═════════════╛

Model Parameters:
╒════════════╤═════════════╤════════════╤═════════════╕
│ Variable   │    Estimate │ On Bound   │   Std Error │
╞════════════╪═════════════╪════════════╪═════════════╡
│ a          │ -1.77998    │ no         │  0.308654   │
│ b          │  0.00648704 │ no         │  0.00143054 │
╘════════════╧═════════════╧════════════╧═════════════╛

Goodness of Fit:
╒════════╤════════╤════════════╤════════════╤════════════╤═══════════════════╕
│   Dose │   Size │   Observed │   Expected │   Est Prob │   Scaled Residual │
╞════════╪════════╪════════════╪════════════╪════════════╪═══════════════════╡
│      0 │     25 │          0 │    3.60765 │   0.144306 │         -2.0533   │
│     10 │     25 │          3 │    3.81257 │   0.152503 │         -0.452045 │
│     50 │     24 │          7 │    4.5393  │   0.189138 │          1.2826   │
│    150 │     24 │         11 │    7.40513 │   0.308547 │          1.58868  │
│    400 │     24 │         15 │   16.6353  │   0.69314  │         -0.723809 │
╘════════╧════════╧════════════╧════════════╧════════════╧═══════════════════╛

Analysis of Deviance:
╒═══════════════╤══════════════════╤════════════╤════════════╤═════════════╤═════════════╕
│ Model         │   Log-Likelihood │   # Params │ Deviance   │ Test d.f.   │ P-Value     │
╞═══════════════╪══════════════════╪════════════╪════════════╪═════════════╪═════════════╡
│ Full model    │         -56.09   │          5 │ -          │ -           │ -           │
│ Fitted model  │         -62.2605 │          2 │ 12.3409    │ 3           │ 0.00630208  │
│ Reduced model │         -74.01   │          1 │ 35.84      │ 4           │ 3.12157e-07 │
╘═══════════════╧══════════════════╧════════════╧════════════╧═════════════╧═════════════╛
Recommend a best-fitting model from the collection of models used to fit the dataset:
session.recommend()
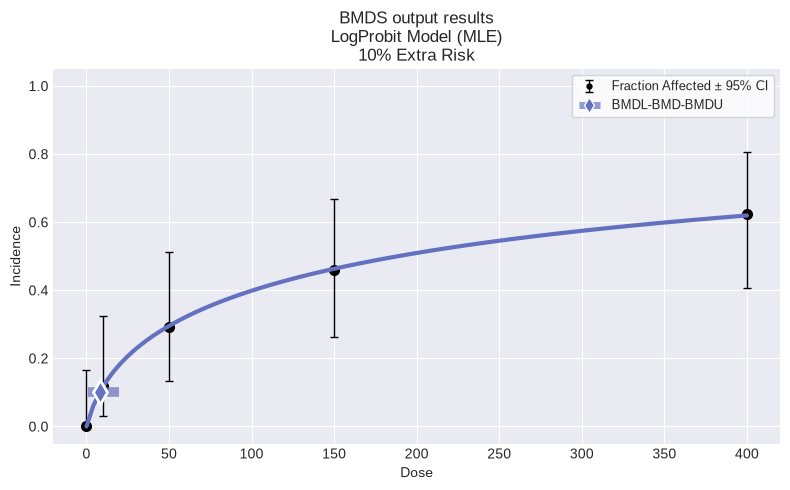
And show the recommended model:
print(session.recommended_model.text())
session.recommended_model.plot()
       LogProbit Model
══════════════════════════════

Version: pybmds 25.2 (bmdscore 25.2)

Input Summary:
╒══════════════════════════════╤══════════════════════════╕
│ BMR                          │ 10% Extra Risk           │
│ Confidence Level (one sided) │ 0.95                     │
│ Modeling approach            │ frequentist_unrestricted │
╘══════════════════════════════╧══════════════════════════╛

Parameter Settings:
╒═════════════╤═══════════╤══════════╤═══════╕
│ Parameter   │   Initial │      Min │   Max │
╞═════════════╪═══════════╪══════════╪═══════╡
│ g           │    0      │ -18      │    18 │
│ a           │    0      │ -18      │    18 │
│ b           │    0.0001 │   0.0001 │    18 │
╘═════════════╧═══════════╧══════════╧═══════╛

Modeling Summary:
╒════════════════╤══════════════╕
│ BMD            │   7.96379    │
│ BMDL           │   1.16574    │
│ BMDU           │  19.7044     │
│ AIC            │ 116.189      │
│ Log-Likelihood │ -56.0944     │
│ P-Value        │   0.999785   │
│ Overall d.f.   │   3          │
│ Chi²           │   0.00869929 │
╘════════════════╧══════════════╛

Model Parameters:
╒════════════╤════════════╤════════════╤══════════════╕
│ Variable   │   Estimate │ On Bound   │ Std Error    │
╞════════════╪════════════╪════════════╪══════════════╡
│ g          │  1.523e-08 │ yes        │ Not Reported │
│ a          │ -2.122     │ no         │ 0.504104     │
│ b          │  0.405055  │ no         │ 0.107298     │
╘════════════╧════════════╧════════════╧══════════════╛
Standard errors estimates are not generated for parameters estimated on corresponding bounds,
although sampling error is present for all parameters, as a rule. Standard error estimates may not
be reliable as a basis for confidence intervals or tests when one or more parameters are on bounds.


Goodness of Fit:
╒════════╤════════╤════════════╤══════════════╤════════════╤═══════════════════╕
│   Dose │   Size │   Observed │     Expected │   Est Prob │   Scaled Residual │
╞════════╪════════╪════════════╪══════════════╪════════════╪═══════════════════╡
│      0 │     25 │          0 │  3.80749e-07 │  1.523e-08 │      -0.000617049 │
│     10 │     25 │          3 │  2.92888     │  0.117155  │       0.0442273   │
│     50 │     24 │          7 │  7.09176     │  0.29549   │      -0.0410505   │
│    150 │     24 │         11 │ 11.1164      │  0.463183  │      -0.0476461   │
│    400 │     24 │         15 │ 14.8744      │  0.619768  │       0.0527974   │
╘════════╧════════╧════════════╧══════════════╧════════════╧═══════════════════╛

Analysis of Deviance:
╒═══════════════╤══════════════════╤════════════╤════════════╤═════════════╤═════════════╕
│ Model         │   Log-Likelihood │   # Params │ Deviance   │ Test d.f.   │ P-Value     │
╞═══════════════╪══════════════════╪════════════╪════════════╪═════════════╪═════════════╡
│ Full model    │         -56.09   │          5 │ -          │ -           │ -           │
│ Fitted model  │         -56.0944 │          2 │ 0.00869649 │ 3           │ 0.999785    │
│ Reduced model │         -74.01   │          1 │ 35.84      │ 4           │ 3.12157e-07 │
╘═══════════════╧══════════════════╧════════════╧════════════╧═════════════╧═════════════╛