Represent the well as a reservoir whose head equals the piezometric
head of the groundwater aquifer. Then connect your pump from the
reservoir to the rest of the network. You can add piping ahead of the
pump to represent local losses around the pump.
If you know the rate at which the well is pumping then an alternate
approach is to replace the well – pump combination with a junction
assigned a negative demand equal to the pumping rate. A time pattern
can also be assigned to the demand if the pumping rate varies over
time.
How do I size a pump to meet a specific flow?
Set the status of the pump to CLOSED. At the suction (inlet) node of
the pump add a demand equal to the required pump flow and place a
negative demand of the same magnitude at the discharge node. After
analyzing the network, the difference in heads between the two nodes
is what the pump needs to deliver.
How do I size a pump to meet a specific head?
Replace the pump with a Pressure Breaker Valve oriented in the
opposite direction. Convert the design head to an equivalent pressure
and use this as the setting for the valve. After running the analysis
the flow through the valve becomes the pump’s design flow.
How can I enforce a specific schedule of source flows into the
network from my reservoirs?
Replace the reservoirs with junctions that have negative demands
equal to the schedule of source flows. (Make sure there is at least
one tank or remaining reservoir in the network, otherwise EPANET will
issue an error message.)
How can I analyze fire flow conditions for a particular junction
node?
To determine the maximum pressure available at a node when the flow
demanded must be increased to suppress a fire, add the fire flow to
the node’s normal demand, run the analysis, and note the resulting
pressure at the node.
To determine the maximum flow available at a particular pressure, set
the emitter coefficient at the node to a large value (e.g., 100 times
the maximum expected flow) and add the required pressure head (2.3
times the pressure in psi) to the node’s elevation. After running the
analysis, the available fire flow equals the actual demand reported
for the node minus any consumer demand that was assigned to it.
How do I model a reduced pressure backflow prevention valve?
Use a General Purpose Valve with a headloss curve that shows
increasing head loss with decreasing flow. Information from the valve
manufacturer should provide help in constructing the curve. Place a
check valve (i.e., a short length of pipe whose status is set to CV)
in series with the valve to restrict the direction of flow.
How do I model a pressurized pneumatic tank?
If the pressure variation in the tank is negligible, use a very
short, very wide cylindrical tank whose elevation is set close to the
pressure head rating of the tank. Select the tank dimensions so that
changes in volume produce only very small changes in water surface
elevation.
If the pressure head developed in the tank ranges between \(H1\) and
\(H2\), with corresponding volumes \(V1\) and \(V2\), then use
a cylindrical tank whose cross-sectional area equals \((V2-V1)/(H2-H1)\).
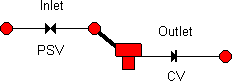
How do I model a tank inlet that discharges above the water surface?
Fig. 13.1 Example of Tank Inlet Discharging above Water Surface.
The tank’s inlet consists of a Pressure Sustaining Valve followed by
a short length of large diameter pipe. The pressure setting of the
PSV should be 0, and the elevation of its end nodes should equal the
elevation at which the true pipe connects to the tank. Use a Check
Valve on the tank’s outlet line to prevent reverse flow through it.
How do I determine initial conditions for a water quality analysis?
If simulating existing conditions monitored as part of a calibration
study, assign measured values to the nodes where measurements were
made and interpolate (by eye) to assign values to other locations. It
is highly recommended that storage tanks and source locations be
included in the set of locations where measurements are made.
To simulate future conditions start with arbitrary initial values
(except at the tanks) and run the analysis for a number of repeating
demand pattern cycles so that the
water quality results begin to repeat in a periodic fashion as well.
The number of such cycles can be reduced if good initial estimates
are made for the water quality in the tanks. For example, if modeling
water age the initial value could be set to the tank’s average
residence time, which is approximately equal to the fraction of its
volume it exchanges each day.
How do I estimate values of the bulk and wall reaction coefficients?
Bulk reaction coefficients can be estimated by performing a bottle
test in the laboratory (see Bulk Reactions in Section 3.4). Wall
reaction rates cannot be measured directly. They must be back-fitted
against calibration data collected from field studies (e.g., using
trial and error to determine coefficient values that produce
simulation results that best match field observations). Plastic pipe
and relatively new lined iron pipe are not expected to exert any
significant wall demand for disinfectants such as chlorine and
chloramines.
How can I model a chlorine booster station?
Place the booster station at a junction node with zero or positive
demand or at a tank. Select the node into the Property Editor and
click the ellipsis button in the Source Quality field to launch the
Source Quality Editor. In the editor, set Source Type to SETPOINT
BOOSTER and set Source Quality to the chlorine concentration that
water leaving the node will be boosted to. Alternatively, if the
booster station will use flow-paced addition of chlorine then set
Source Type to FLOW PACED BOOSTER and Source Quality to the
concentration that will be added to the concentration leaving the
node. Specify a time pattern ID in the Time Pattern field if you wish
to vary the boosting level with time.
How would I model trihalomethanes (THM) growth in a network?
THM growth can be modeled using first-order saturation kinetics.
Select Options – Reactions from the Data Browser. Set the bulk
reaction order to 1 and the limiting concentration to the maximum THM
level that the water can produce, given a long enough holding time.
Set the bulk reaction coefficient to a positive number reflective of
the rate of THM production (e.g., 0.7 divided by the THM doubling
time). Estimates of the reaction coefficient and the limiting
concentration can be obtained from laboratory testing. The reaction
coefficient will increase with increasing water temperature. Initial
concentrations at all network nodes should at least equal the THM
concentration entering the network from its source node.
Can I use a text editor to edit network properties while running
EPANET?
Save the network to file as ASCII text (select File >> Export >>
Network). With EPANET still running, start up your text editor
program. Load the saved network file into the editor. When you are
done editing the file, save it to disk. Switch to EPANET and read in
the file (select File >> Open). You can keep switching back and
forth between the editor program and EPANET, as more changes are
needed. Just remember to save the file after modifying it in the
editor, and re-open it again after switching to EPANET. If you use a word processor (such as
Word) or a spreadsheet as your editor, remember to save the file
as plain ASCII text.
Can I run multiple EPANET sessions at the same time?
Yes. This could prove useful in making side-by-side comparisons of
two or more different design or operating scenarios.