This chapter discusses the essential features of EPANET’s workspace.
It describes the main menu bar, the tool and status bars, and the
three windows used most often – the Network Map, the Browser, and the
Property Editor. It also shows how to set program preferences.
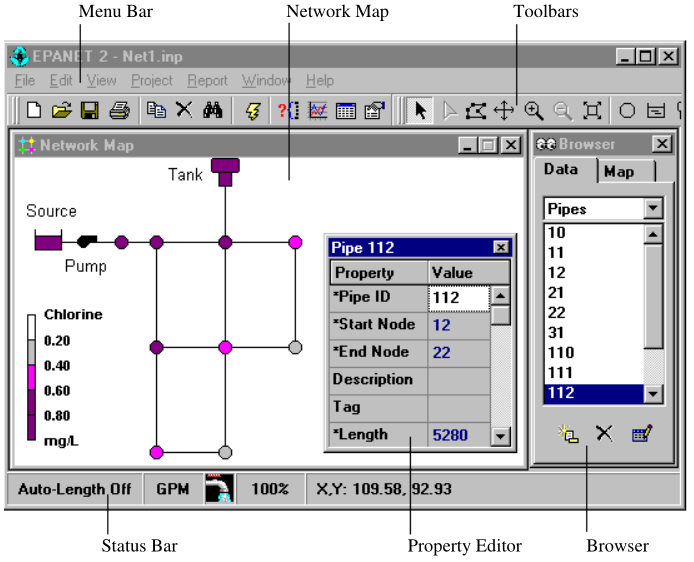
The basic EPANET workspace is pictured in Fig. 4.1 below. It consists of the
following user interface elements: a Menu Bar, two Toolbars, a Status
Bar, the Network Map window, a Browser window, and a Property Editor
window. A description of each of these elements is provided in the
sections that follow.
Rearranges all child windows to fit within the main window
Close All
Closes all open windows (except the Map and Browser)
Window List
Lists all open windows; selected window currently has focus
Help Menu
The Help Menu contains commands for getting help in using EPANET. The Help Menu contains the following commands shown in Table 4.7 below.
Context-sensitive Help is also available by pressing the F1 key.
Toolbars provide shortcuts to commonly used operations. There are two
such toolbars:
Standard Toolbar
Map Toolbar
The toolbars can be docked underneath the Main Menu bar or dragged to
any location on the EPANET workspace. When undocked, they can also be
re-sized. The toolbars can be made visible or invisible by selecting
View >> Toolbars.
Standard Toolbar
The Standard Toolbar contains speed buttons for commonly used
commands.
Opens a new project (File >> New)
Opens an existing project (File >> Open)
Saves the current project (File >> Save)
Prints the currently active window (File >> Print)
Copies selection to the clipboard or to a file (Edit >> Copy To)
Deletes the currently selected item
Finds a specific item on the map (View >> Find)
Runs a simulation (Project >> Run Analysis)
Runs a visual query on the map (View >> Query)
Creates a new graph view of results (Report >> Graph)
Creates a new table view of results (Report >> Table)
Modifies options for the currently active view (View >>
Options or Report >> Options)
Map Toolbar
The Map Toolbar contains buttons for working with the Network Map.
Selects an object on the map (Edit >> Select Object)
Selects link vertex points (Edit >> Select Vertex)
Selects a region on the map (Edit >> Select Region)
The Network Map provides a planar schematic diagram of the objects
comprising a water distribution network. The location of objects and
the distances between them do not necessarily have to conform to
their actual physical scale. Selected properties of these objects,
such as water quality at nodes or flow velocity in links, can be
displayed by using different colors. The color-coding is described in
a Legend, which can be edited. New objects can be directly added to
the map and existing objects can be clicked on for editing, deleting,
and repositioning. A backdrop drawing (such as a street or
topographic map) can be placed behind the network map for reference.
The map can be zoomed to any scale and panned from one position to
another. Nodes and links can be drawn at different sizes, flow
direction arrows added, and object symbols, ID labels and numerical
property values displayed. The map can be printed, copied onto the
Windows clipboard, or exported as a DXF file or Windows metafile.
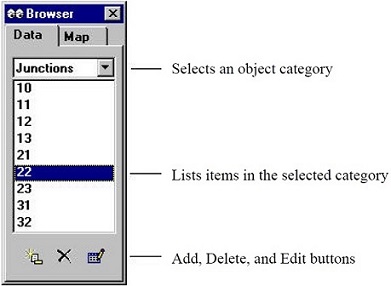
The Data Browser (shown in Fig. 4.2 below) is accessed from the Data
tab on the Browser window. It gives access to the various objects, by
category (Junctions, Pipes, etc.) that are contained in the network
being analyzed. The buttons at the bottom are used to add, delete,
and edit these objects.
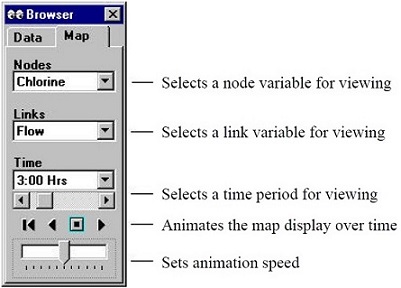
The Map Browser (shown in Fig. 4.3 below) is accessed from the Map tab
of the Browser Window. It selects the parameters and time period that
are viewed in color-coded fashion on the Network Map. It also
contains controls for animating the map through time.
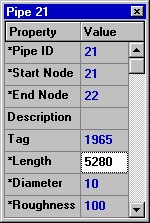
The Property Editor (shown in Fig. 4.4 below) is used to edit
the properties of network nodes, links, labels, and analysis options.
It is invoked when one of these objects is selected (either on the
Network Map or in the Data Browser) and double-clicked or the
Browser’s Edit button is clicked. The following points help explain
how to use the Editor.
Program preferences allow you to customize certain program features.
To set program preferences select Preferences from the File
menu. A Preferences dialog form will appear containing two tabbed
pages – one for General Preferences and one for Format Preferences.
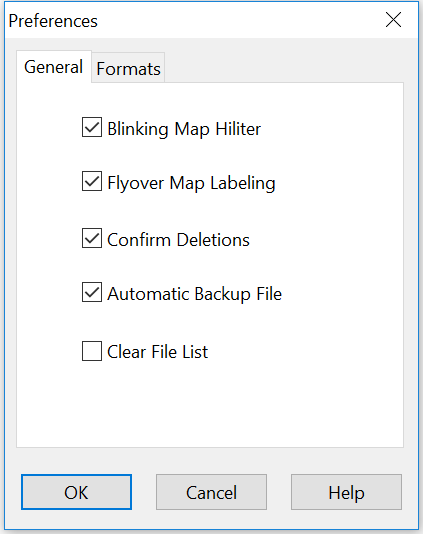
General Preferences
The following preferences can be set on the General tab of the
Preferences dialog (as shown below in Table 4.8).
Check to make the selected node,
link, or label on the map blink
on and off
Flyover Map Labeling
Check to display the ID label and
current parameter value in a
hint-style box whenever the mouse
is placed over a node or link on
the network map
Confirm Deletions
Check to display a confirmation
dialog box before deleting any
object
Automatic Backup File
Check to save a backup copy of a
newly opened project to disk
named with a .bak extension
Clear File List
Clears the list of most recently
used project files from the
File menu
Note: The automatic Backup File is placed in the same directory as the input file. However,
the backup file (.bak) is only created for .net type input files, not the .inp text files. The Preferences
Menu screen for the General Tab is shown in Fig. 4.5 below.
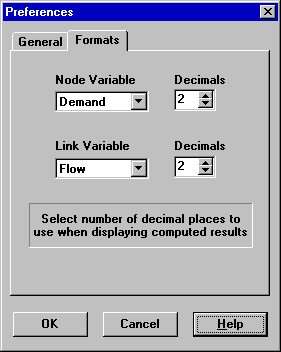
The Formats tab of the Preferences dialog box (shown in Fig. 4.6) controls how many
decimal places are displayed when results for computed parameters are
reported. Use the dropdown list boxes to select a specific Node or
Link parameter. Use the spin edit boxes to select the number of
decimal places to use when displaying computed results for the
parameter. The number of decimal places displayed for any particular
input design parameter, such as pipe diameter, length, etc. is
whatever the user enters.
Opens a new project (File >> New)
Opens an existing project (File >> Open)
Saves the current project (File >> Save)
Prints the currently active window (File >> Print)
Copies selection to the clipboard or to a file (Edit >> Copy To)
Deletes the currently selected item
Finds a specific item on the map (View >> Find)
Runs a simulation (Project >> Run Analysis)
Runs a visual query on the map (View >> Query)
Creates a new graph view of results (Report >> Graph)
Creates a new table view of results (Report >> Table)
Modifies options for the currently active view (View >> Options or Report >> Options)
Selects an object on the map (Edit >> Select Object)
Selects link vertex points (Edit >> Select Vertex)
Selects a region on the map (Edit >> Select Region)
Pans across the map (View >> Pan)
Zooms in on the map (View >> Zoom In)
Zooms out on the map (View >> Zoom Out)
Draws map at full extent (View >> Full Extent)
Adds a junction to the map
Adds a reservoir to the map
Adds a tank to the map
Adds a pipe to the map
Adds a pump to the map
Adds a valve to the map
Adds a label to the map
Rewind (return to initial time)
Animate back through time
Stop the animation
Animate forward in time