This chapter discusses how EPANET uses project files to store a
piping network’s data. It explains how to set certain default options
for the project and how to register calibration data (observed
measurements) with the project to use for model evaluation.
Project files contain all of the information used to model a network.
They are usually named with a .NET extension.
To create a new project:
Select File >> New from the Menu Bar or click on the
Standard Toolbar.
You will be prompted to save the existing project (if changes were
made to it) before the new project is created.
A new, unnamed project is created with all options set to their
default values.
A new project is automatically created whenever EPANET first begins.
To open an existing project stored on disk:
Either select File >> Open from the Menu Bar or click
on the Standard Toolbar.
You will be prompted to save the current project (if changes were
made to it).
Select the file to open from the Open File dialog form that will
appear. You can choose to open a file type saved previously as an
EPANET project (typically with a .NET extension) or exported as a
text file (typically with a .INP extension). EPANET recognizes file
types by their content, not their names.
Click OK to close the dialog and open the selected file.
To save a project under its current name:
Either select File >> Save from the Menu Bar or click
on the Standard Toolbar.
To save a project using a different name:
Select File >> Save As from the Menu Bar.
A standard File Save dialog form will appear from which you can
select the folder and name that the project should be saved under.
Note: Projects are always saved as binary .NET files. To save a
project’s data as readable ASCII text, use the Export >> Network
command from the File menu.
Default hydraulic analysis options (e.g., system of units, headloss
equation, etc.)
To set default values for a project:
Select Project >> Defaults from the Menu Bar.
A Defaults dialog form will appear with three pages, one for each
category listed above.
Check the box in the lower right of the dialog form if you want to
save your choices for use in all new future projects as well.
Click OK to accept your choice of defaults.
The specific items for each category of defaults will be discussed
next.
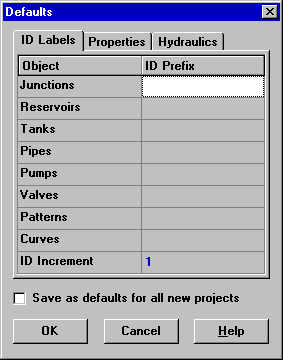
Default ID Labels
The ID Labels tab of the Defaults dialog form is shown in Fig. 5.1
below. It is used to determine how EPANET will assign default ID
labels to network components when they are first created. For each
type of object one can enter a label prefix or leave the field blank
if the default ID will simply be a number. Then one supplies an
increment to be used when adding a numerical suffix to the default
label. As an example, if J were used as a prefix for Junctions along
with an increment of 5, then as junctions are created they receive
default labels of J5, J10, J15 and so on. After an object has been
created, the Property Editor can be used to modify its ID label if
need be.
Fig. 5.1 ID Labels Tab of the Project Defaults Dialog.
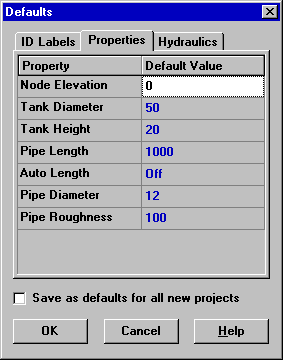
Default Node/Link Properties
The Properties tab of the Defaults dialog form is shown in Fig. 5.2. It sets default property values for newly created nodes and
links. These properties include:
Elevation for nodes
Diameter for tanks
Maximum water level for tanks
Length for pipes
Auto-Length (automatic calculation of length) for pipes
Diameter for pipes
Roughness for pipes
When the Auto-Length property is turned on, pipe lengths will
automatically be computed as pipes are added or repositioned on the
network map. A node or link created with these default properties can
always be modified later on using the Property Editor.
Fig. 5.2 Properties Tab of the Project Defaults Dialog.
Default Hydraulic Options
The third tab of the Defaults dialog form is used to assign default
hydraulic analysis options. It contains a sub-set of the project’s Hydraulic
Options that can also be accessed from the Browser
(see Section 8.1). They are repeated on the Project Defaults dialog
so that they can be saved for use with future projects as well as
with the current one. The most important Hydraulic Options to check
when setting up a new project are Flow Units, Headloss Formula, and
Default Pattern. The choice of Flow Units determines whether all
other network quantities are expressed in Customary US units or in SI
metric units. The choice of Headloss Formula defines the type of the
roughness coefficient to be supplied for each pipe in the network.
The Default Pattern automatically becomes the time pattern used to
vary demands in an extended period simulation for all junctions not
assigned any pattern.
EPANET allows you to compare results of a simulation against measured
field data. This can be done via Time Series plots for selected
locations in the network or by special Calibration Reports that
consider multiple locations. Before EPANET can use such calibration
data it has to be entered into a file and registered with the
project.
Calibration Files
A Calibration File is a text file containing measured data for a
particular quantity taken over a particular period of time within a
distribution system. The file provides observed data that can be
compared to the results of a network simulation. Separate files
should be created for different parameters (e.g., pressure, fluoride,
chlorine, flow, etc.) and different sampling studies. Each line of
the file contains the following items:
Location ID - ID label (as used in the network model) of the location
where the measurement was made
Time - Time (in hours) when the measurement was made
Value - Result of the measurement
The measurement time is with respect to time zero of the simulation
to which the Calibration File will be applied. It can be entered as
either a decimal number (e.g., 27.5) or in hours:minutes format
(e.g., 27:30). For data to be used in a single period analysis all
time values can be 0. Comments can be added to the file by placing a
semicolon (;) before them. For a series of measurements made at the
same location the Location ID does not have to be repeated. An
excerpt from a Calibration File is shown below.
To view a summary description of the current project select Project
>> Summary from the Menu Bar. The Project Summary dialog form will
appear in which you can edit a descriptive title for the project as
well as add notes that further describe the project. When you go to
open a previously saved file, the Open File dialog box will display
both of these items as different file names are selected. This makes
them very useful for locating specific network analyses. The form
also displays certain network statistics, such as the number of
junctions, pipes, pumps, etc.
on the Standard Toolbar.
on the Standard Toolbar.
on the Standard Toolbar.