Modeling Data in BMDS Online
For users new to BMDS Online, this section walks through the basics of creating and sharing an online analysis, using dichotomous data as an example. The steps also include tips on how to use BMDS Online effectively.
Before You Start
BMDS Online is best experienced in a modern web browser, such as Google Chrome or Microsoft Edge. Internet Explorer 11 is not supported.
No user information is saved or associated with any analysis.
BMDS Online will save datasets and analyses for three years on an EPA server; users can optionally “renew” an analysis so that it remains on the EPA server for another three years. Or, users can save to their computer an export of the data or analysis for later import into BMDS Online. For more information, refer to the Actions Menu.
If data sensitivity is an issue, the user can run BMDS Desktop on their local computer.
Creating a New Analysis
Navigate to the BMDS Online website.
Select the Create a new BMDS analysis button.
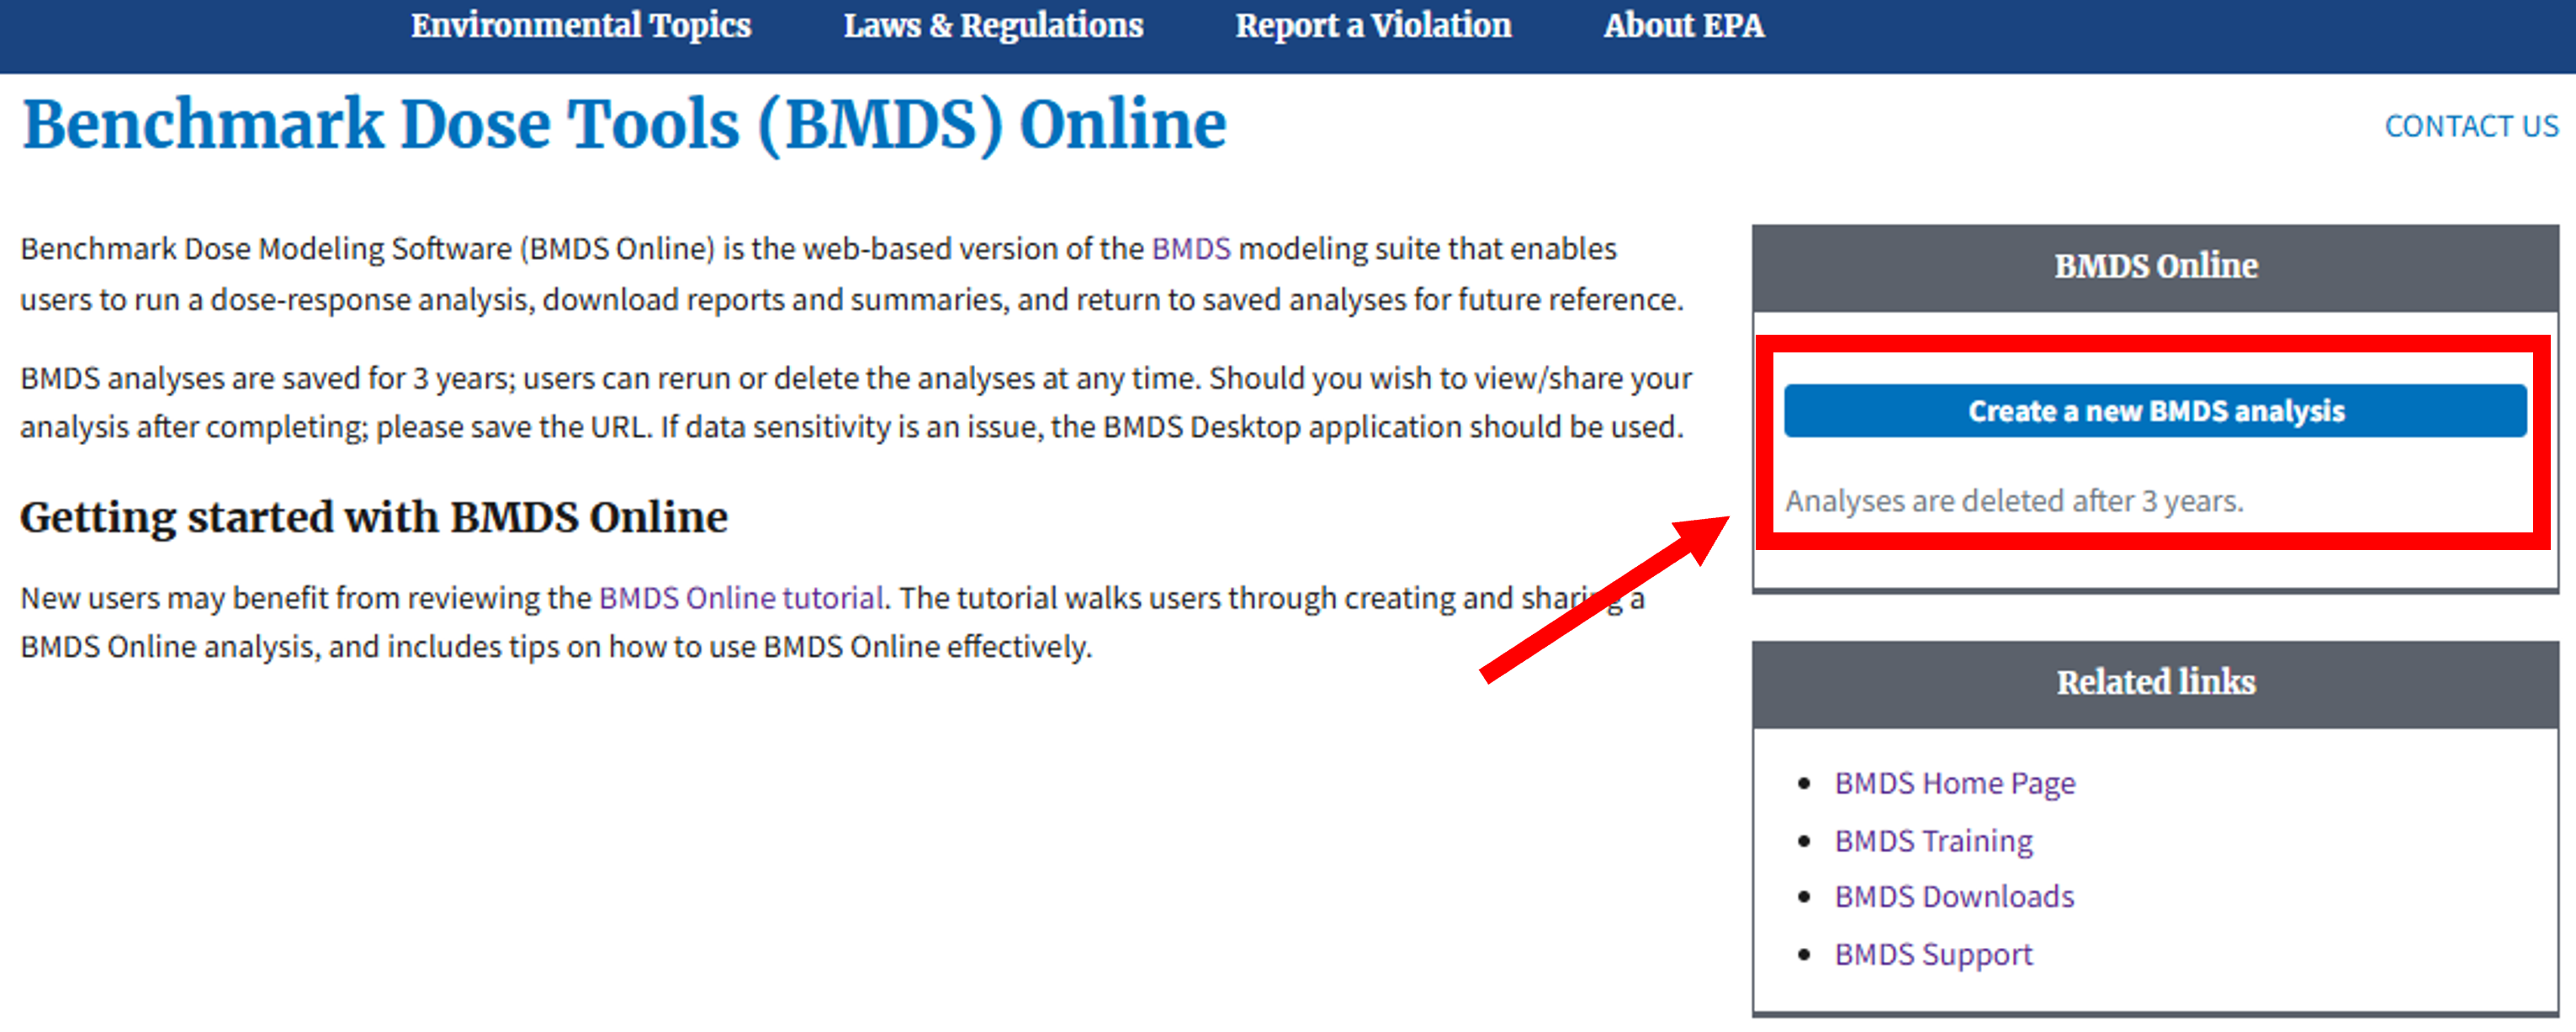
Figure 6. BMDS Online landing page, with Create a new BMDS analysis highlighted
BMDS Online displays a new, empty analysis page with the Settings tab selected. From here, you can configure an analysis, load a dataset, execute the analysis, and select results.
Each BMDS Online analysis is self-contained and includes all the inputs and outputs for the executed analysis. No user or personal information is captured by BMDS Online.
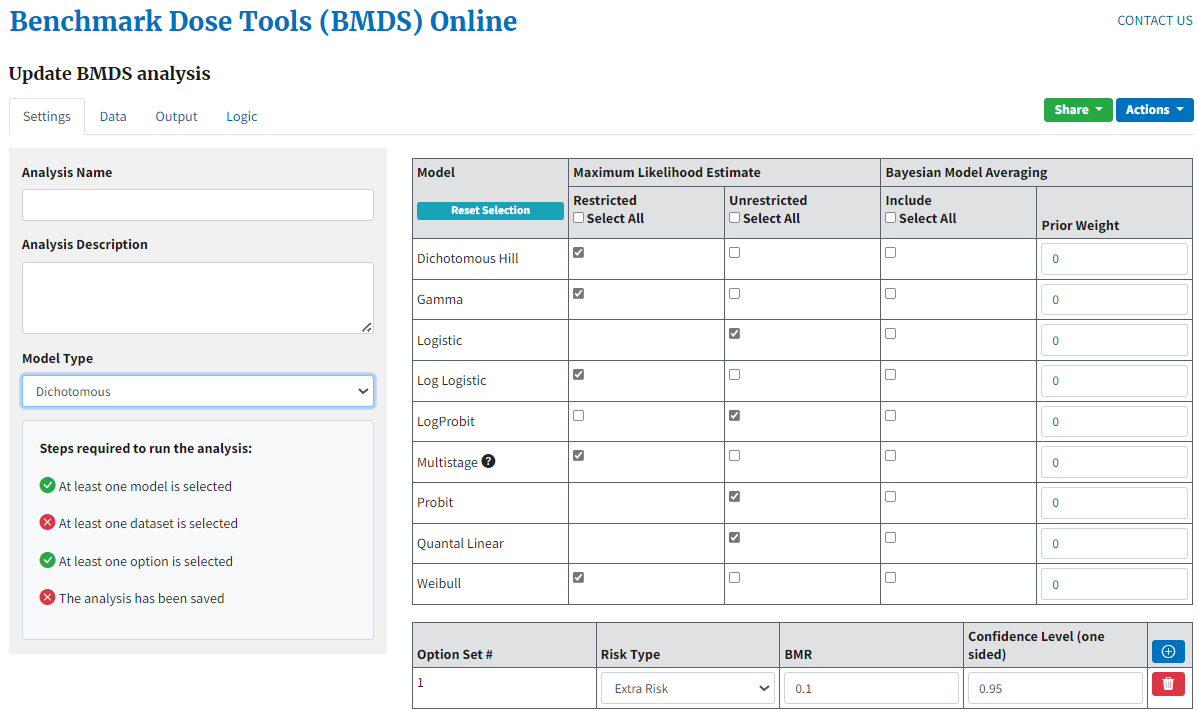
Figure 7. A new BMDS Online analysis page.
Analyses and URLs
When a new analysis is created, a unique URL is created for the analysis.
You can create as many analyses as you want, but saving an analysis saves only the most recent execution to that unique URL. If you edit the data or add new data or new options and rerun the software, then the resulting new analysis will overwrite the previous older analysis, but the URL will remain unchanged.
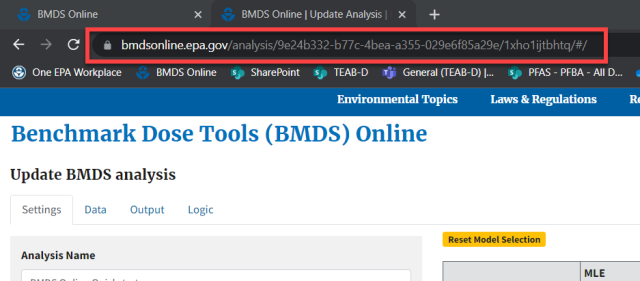
Figure 8. A new BMDS Online analysis has a unique URL.
Specifying an Analysis
Steps Required to Run the Analysis
BMDS Online tracks the steps required to run an analysis. In this example, for a new analysis, the green checkmarks show that the default set of models and options have been selected for the analysis. Red x’s show that, currently, no dataset has been selected and the analysis has not been saved.
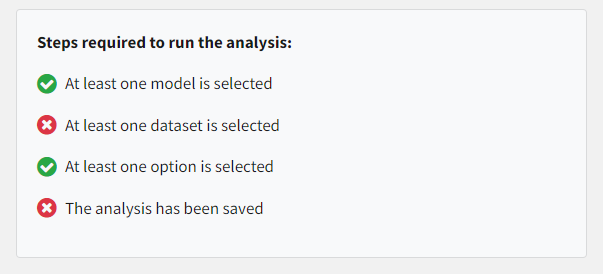
Figure 9. When all checkmarks are green, BMDS Online can run an analysis.
Important
An analysis can only be run after all four steps required are satisfied: At least one model is selected, at least one dataset is selected, at least one option set is selected, and the analysis has been saved. Changing any input parameter related to model, dataset, or option set will require the analysis to be saved again prior to running.
Specifying the Model(s) and Option(s)
On the Settings tab, specify a name and description for the analysis. BMDS uses the Analysis Name field to name the files that are created when users select the Reporting options “data,” “report,” or “analysis” from the Actions menu.
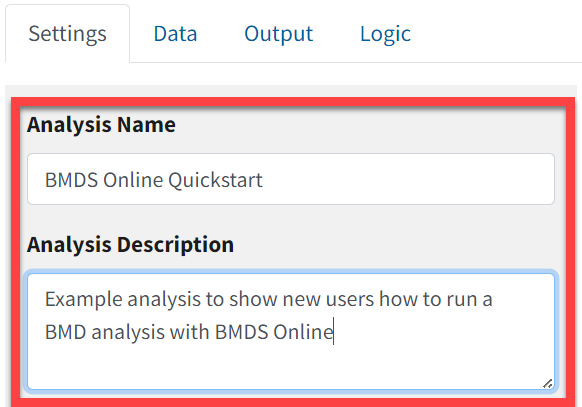
Figure 10. Enter a descriptive name and summary for the analysis; they will be included in the report.
Select the model type for your analysis (i.e., are you modeling dichotomous or continuous data?). For this example, the dichotomous model type has been selected.
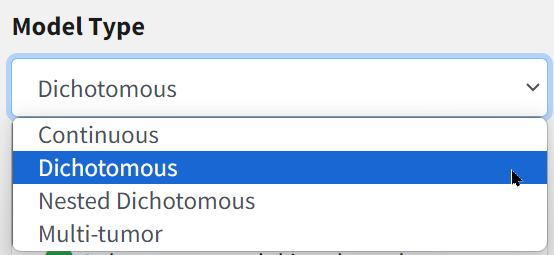
Figure 11. Dichotomous model type is selected for this analysis.
Important
An analysis can have only a single model type. You cannot mix continuous and dichotomous data in a single analysis.
Select which models will be used for the analysis. For this example, the default selection of dichotomous maximum-likelihood estimation (MLE) models will be used, plus all the Bayesian dichotomous model averaging models. To use all the models in a column, check the Select All box.
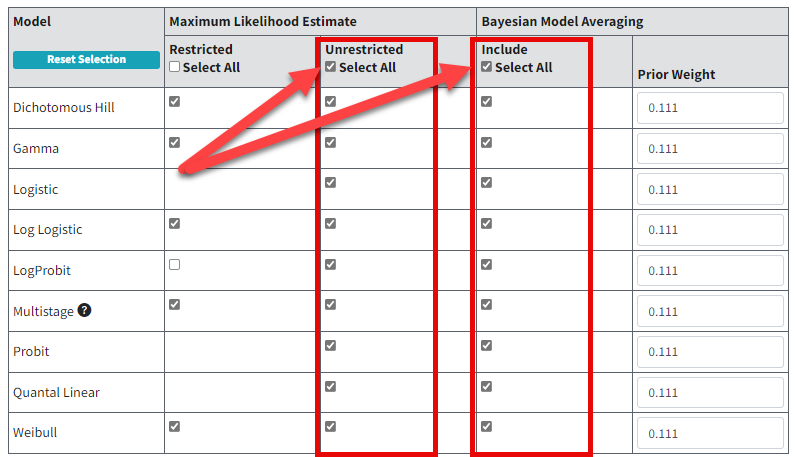
Figure 12. Tick the Select All box to select all the models in a column.
Specify the option sets to be used for the analysis. For this example, we will use a single option set with the default benchmark response (BMR) of 10% extra risk.
You can add/delete option sets by clicking the blue plus or red trash can icons, respectively, to the right of the option set panel (Figure 13.).
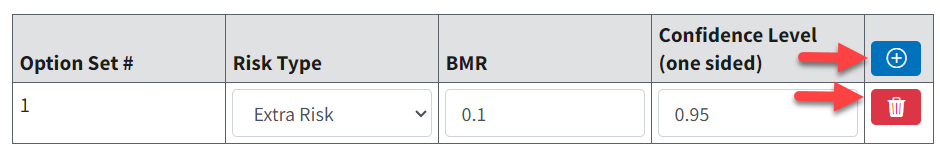
Figure 13. Select the blue plus icon to add a row for a new option set. Select the red trash can icon to delete the row.
Note
To reset the model selection to the BMDS Online defaults, select the Reset Selection button. This function does not reset the modeling options (e.g., Risk Type) already specified.
Maximum Number of Option Sets
BMDS Online: A maximum of six option sets (for continuous, dichotomous, and nested dichotomous) and up to three option sets (for multitumor).
BMDS Desktop: No limit essentially; but it is recommended to create multiple analyses instead of putting large numbers of datasets into a single analysis.
pybmds: No limit.
Specifying Datasets
Specifying Datasets by Endpoint
Select a Model Type on the Settings tab before entering datasets.
Select the Data tab.
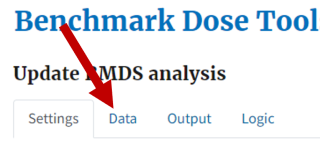
Figure 14. Select the Data tab to start specifying datasets.
On the Data tab, select the New button to add an individual dataset. For this example workflow, only the dichotomous option is shown for the New dataset field because Dichotomous was chosen as the model type on the Settings tab.
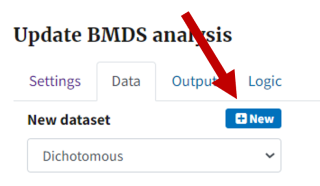
Figure 15. The New button creates a new empty dataset.
Depending on the model type selected on the Settings tab, BMDS Online will present appropriate selections for a new dataset.
Continuous data:
Summarized (data measured on a continuous scale and presented as means and standard deviations), or
Individual (data measured on a continuous scale presented as dose and response data for each test subject)
Dichotomous data (e.g., lesion incidence)
Nested Dichotomous data (dichotomous observations that are nested within experimental units, such as rodent dams and pups)
Multitumor data (most often limited to analyses of cancer data where the component datasets are for tumors occurring at various sites)
BMDS Online automatically adds five rows of data when adding a new dataset.
After a new empty dataset has been added, you can specify the dataset name, dose name and units, and response name and units. BMDS Online will use this information to identify the dataset in results and reports.
For the example shown in Figure 16., the incidence of hepatocellular hyperplasia will be modeled with dose units of mg/kg-day.
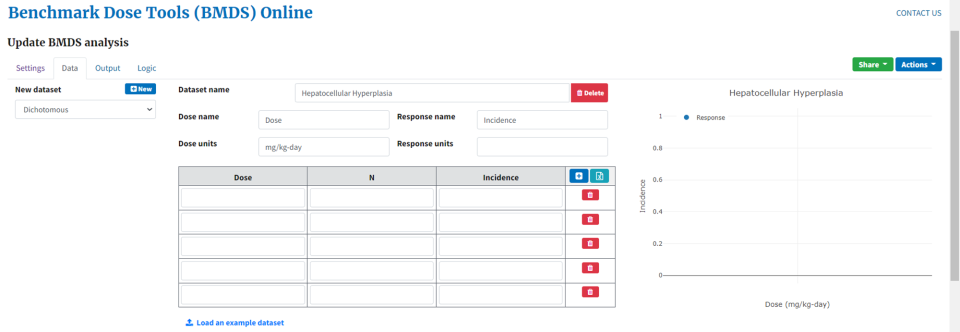
Figure 16. Data tab with empty dataset, empty graph, and details about the dataset to be analyzed.
Maximum Number of Datasets
BMDS Online: A maximum of six datasets (for continuous, dichotomous, and nested dichotomous) or 10 datasets (for multitumor).
BMDS Desktop: No limit essentially; but it is recommended to create multiple analyses instead of putting large numbers of datasets into a single analysis.
pybmds: No limit.
Adding Datasets, Method 1: Manually
Manually enter Dose, N, and Incidence data by typing the data into the table.
New rows can be added by clicking the blue plus icon; unneeded rows can be deleted by clicking the red trash can icon.
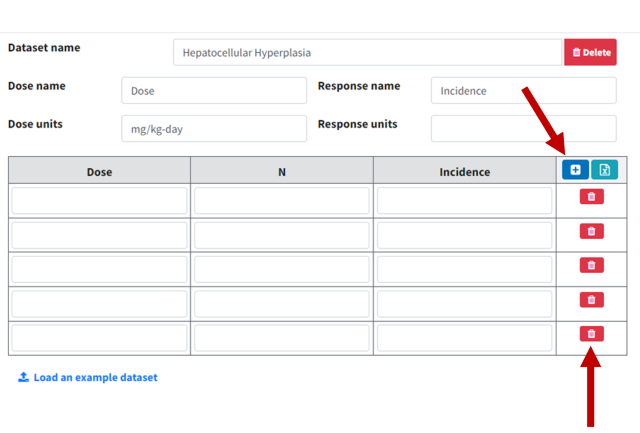
Figure 17. Select the blue plus icon to add five rows at a time; select the red trash can icon to delete that row.
Adding Datasets, Method 2: Copy and Paste
BMDS Online can import datasets by copying and pasting from an Excel or HTML formatted source.
Select and copy the cells (numbers only; do not include column titles or header text).
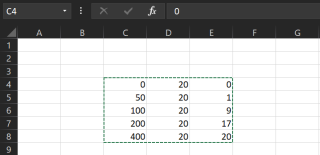
Figure 18. Select and copy the data from Excel.
In BMDS Online, select the teal Excel icon in the dataset table header. A Paste from Excel window displays.
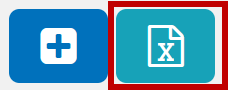
Figure 19. Select the Paste from Excel button
Click the mouse inside the Paste from Excel window’s text box, paste the data, and select the Load button. The dataset is then fully entered in BMDS Online.
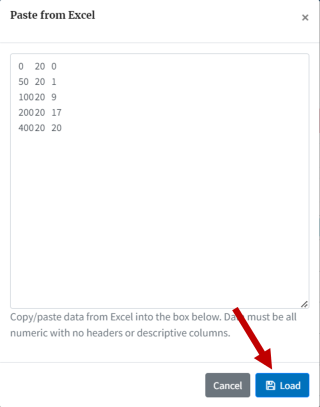
Figure 20. After pasting in the data from Excel, select Load to enter the data into BMDS Online.
Adding Datasets, Method 3: Edit Sample Data
Select the Load an example dataset link to create ready-to-customize sample data.
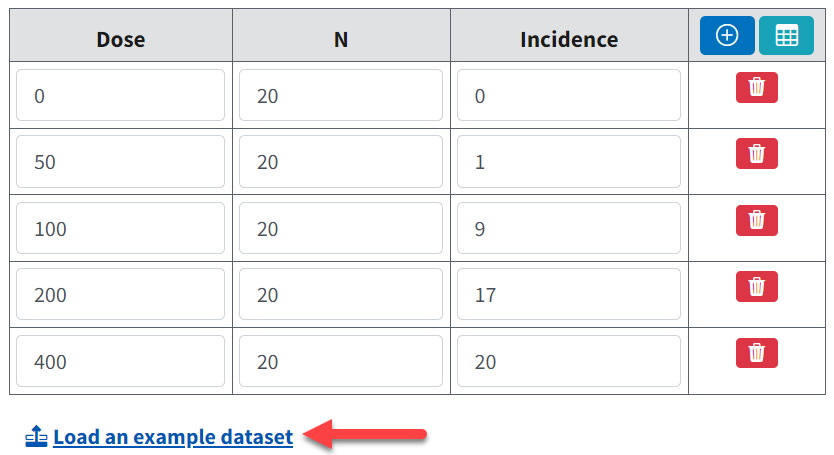
Figure 21. Sample dichotomous dataset, ready for editing.
Insert and Save Multiple Datasets
BMDS Online displays only one dataset at a time. However, it tracks all datasets created in the current session.
All datasets created during a session are saved via the Actions menu’s Download analysis option and all specified datasets in a session can be Shared.
Select the Create button to create a new default dataset with an autogenerated name. The user can switch between datasets created during the current session by selecting them from the Select existing picklist.
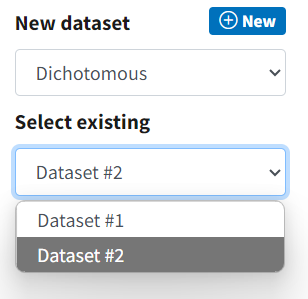
Figure 22. Creating multiple datasets in BMDS Online.
Delete a Dataset
Select the dataset from the Select existing picklist, then select the Delete button beside the Dataset name field.
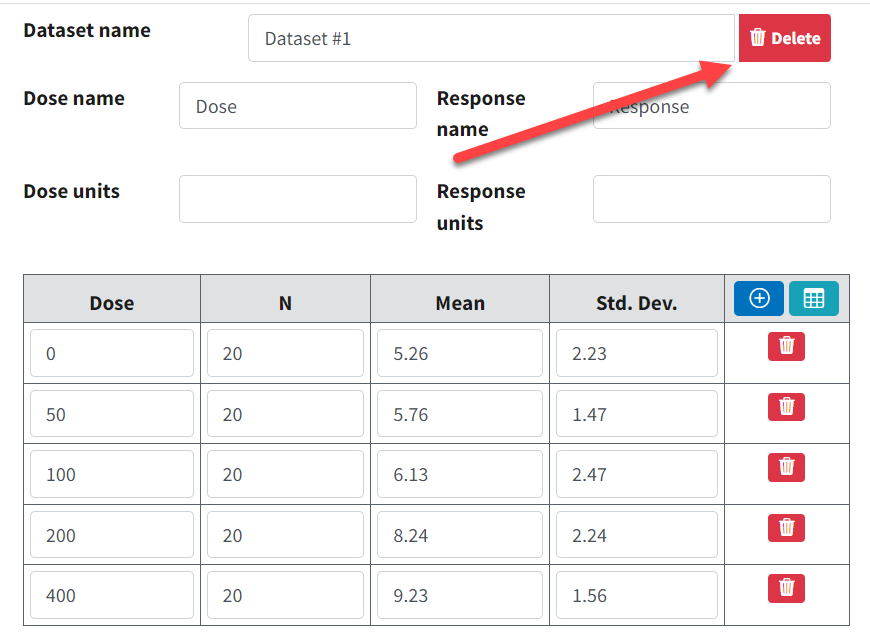
Figure 23. Data tab with Delete button highlighted.
Document the Dataset
BMDS Online enters a default dataset name as a placeholder but a good practice is to enter a unique name for the dataset. The dataset name will be used as the title for the plot.
Specifying the Dose units and Response units above the dataset will enter those units into the plot.
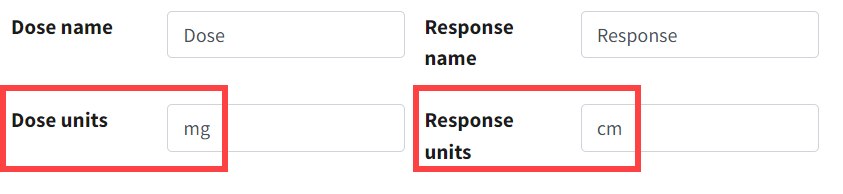
Figure 24. Specify the dataset’s units here…
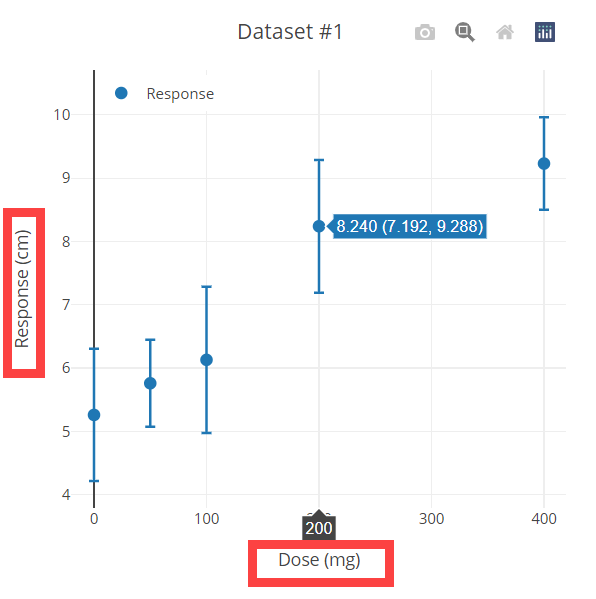
Figure 25. …and they provide additional context for the plot’s axes.
All Rows Must Have Data
When the user saves an analysis, BMDS Online displays an error if the dataset is missing any values.
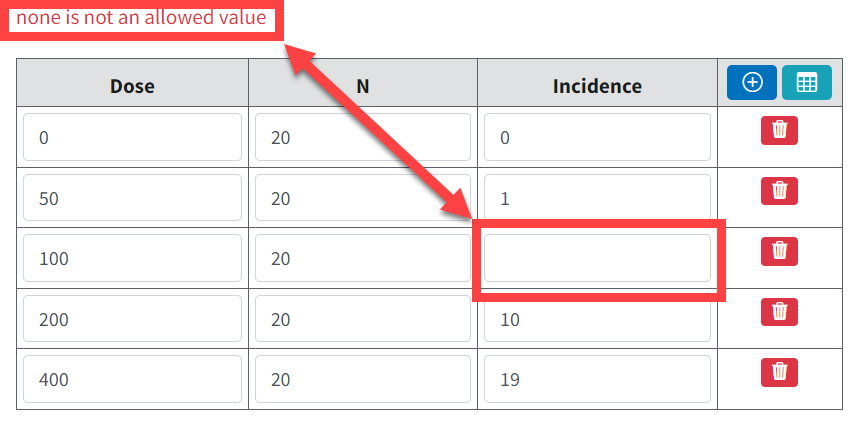
Figure 26. BMDS Online displays an error if there are missing values in a dataset.
Dataset Plot
Note that the plot to the right of the dataset table updates as data is entered. The plot provides visual feedback on the entered data to draw attention to trends or anomalies that may need correction.
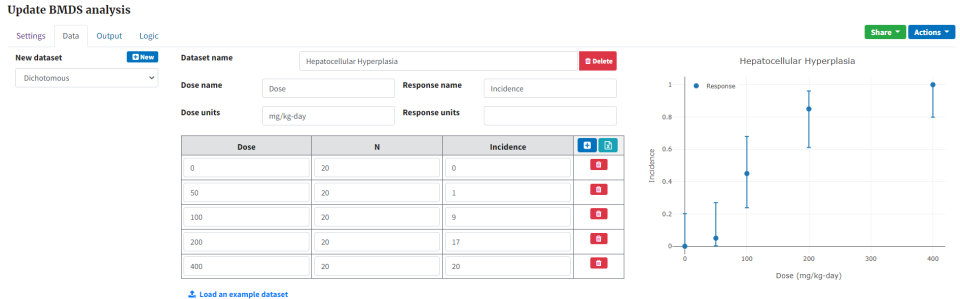
Figure 27. Dataset and plot.
Hover the cursor over a data point to see the observed incidence (calculated from the entered data) and the confidence interval (calculated using endpoint-specific methods; see Graphs/Plots All Data).
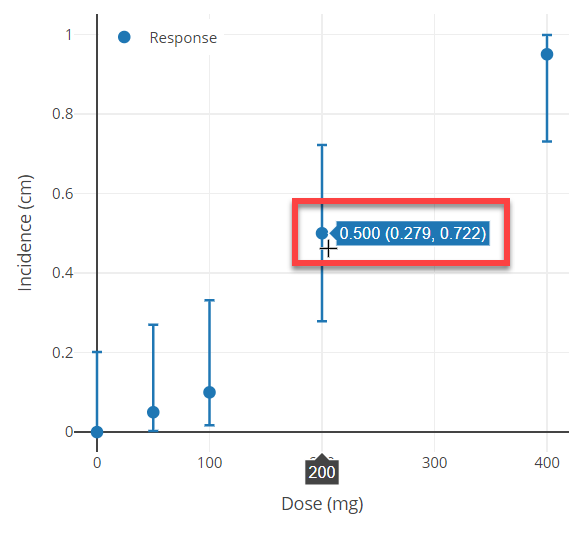
Figure 28. Hover the cursor over a data point to see extra plot details.
The plot’s upper right corner features a line of icons that help the user to, from left to right:
Download the plot as a PNG image (camera icon)
Zoom into the plot (magnifying glass icon)
Restore the plot to default view (home icon)
Display the Plotly.com website, who are makers of the plotting feature (graph icon)

Figure 29. Plotly accessories.
Visit the Plotly Website Help Page for detailed instructions on the use of these plot controls.
Running an Analysis
After all datasets are loaded, return to the Settings tab to run the analysis.
Use the Enabled column’s checkboxes to select all datasets to include in the analysis. On the Settings tab, a green checkmark now appears next to At least one dataset is selected.
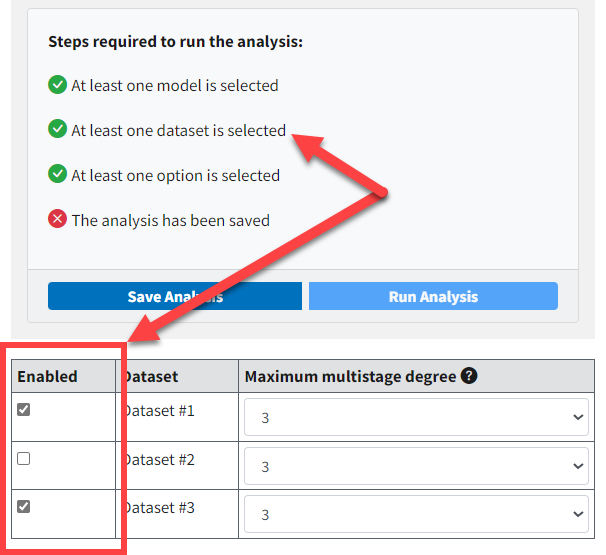
Figure 30. Enable datasets to satisfy another analysis requirement.
For dichotomous data, BMDS Online automatically selects the Maximum multistage degree to be 3. However, you can manually select a range of options from the Maximum multistage degree picklist. For this example analysis, the default setting is used. For more information, see Maximum Multistage Degree.
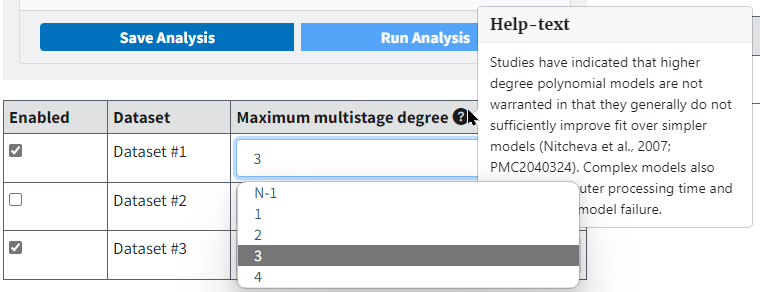
Figure 31. Hover the mouse over the question mark icon for help text on Maximum multistage degree setting.
Select the Save Analysis button to complete all the steps required to enable the Run Analysis button. Notice that all steps now have a green checkmark next to them.
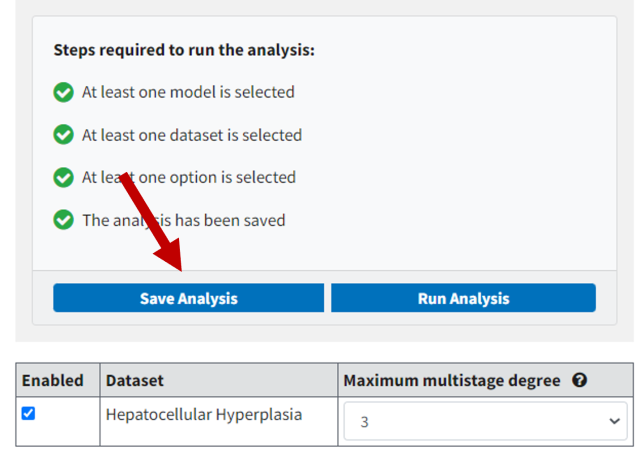
Figure 32. Selecting Save Analysis ensures all specifications are in place for an analysis.
Select the Run Analysis button to execute the analysis. A running analysis can be stopped by selecting the Cancel execution button.
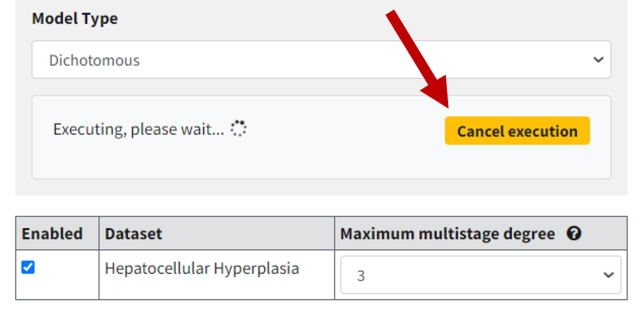
Figure 33. Select Cancel execution to stop a running analysis.
After successful execution, the modeling results are displayed on the Output tab.
Viewing Analysis Results
BMDS Online displays a set of results for one dataset at a time on the Output tab. The display includes the dataset under analysis, option settings, results, and a plot.
The large Model Results table is an abbreviated display showing the most frequently used and referenced values from a BMD analysis.
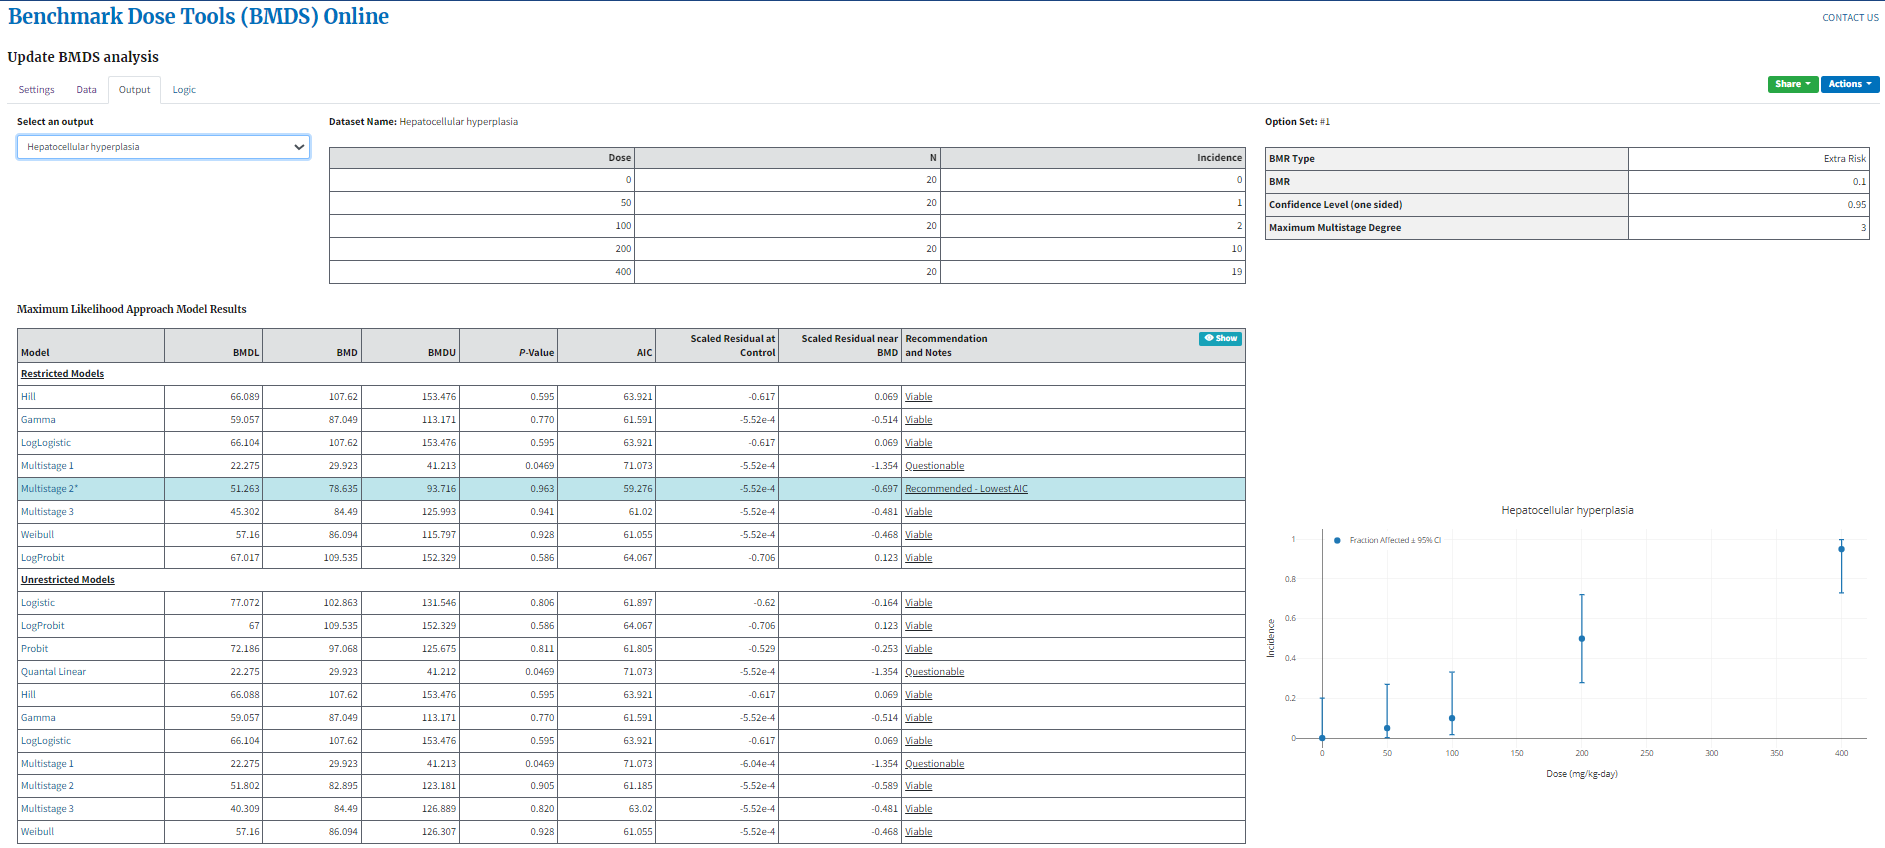
Figure 34. The Output tab is a large scrolling page showing results for one dataset at a time.
To select a different set of results, select the specific dataset+option set combination from the Select an output picklist.
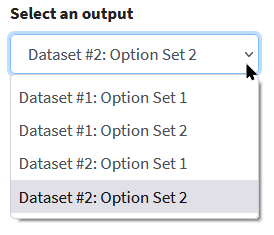
Figure 35. Select the output results to display in the Output tab.
Summary Results Table
Numerical results are displayed in a summary table for all models. Select the Show icon in the Recommendation and Notes column header to display a full set of model notes and warnings. Select the Hide icon to hide the model notes.
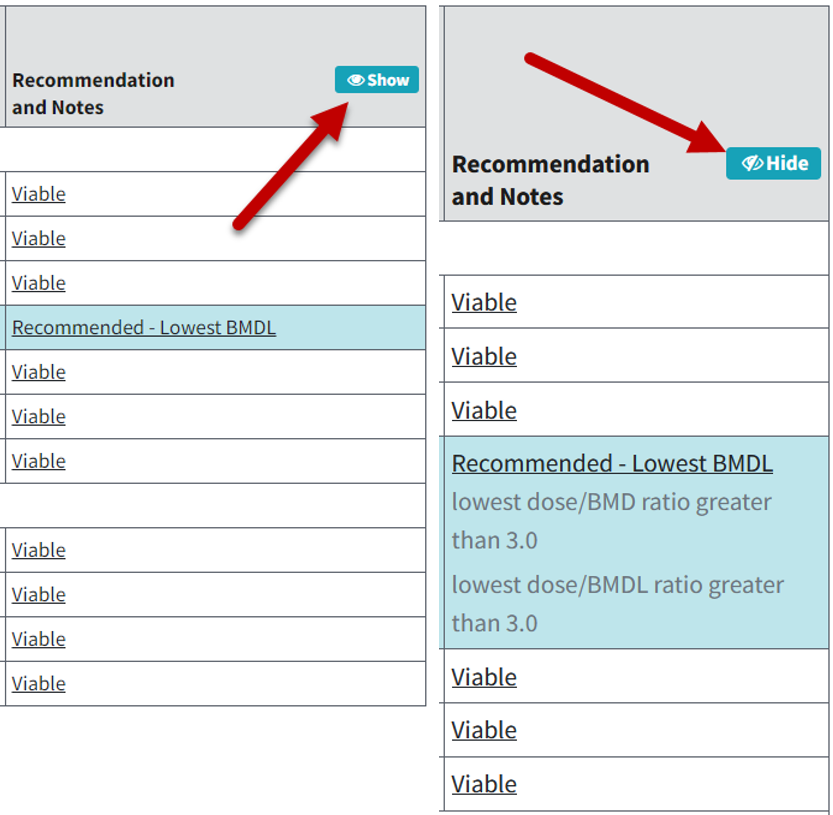
Figure 36. The Show/Hide buttons toggle display of additional model warnings and messages.
Hover the cursor over rows within the Model Results table to display individual model curves in the plot.
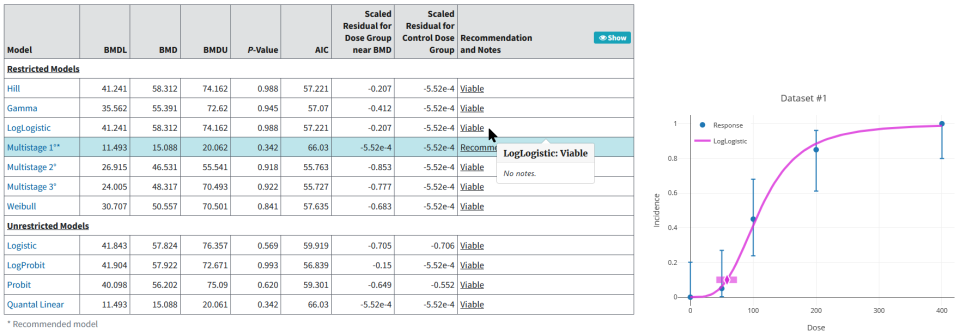
Figure 37. Hovering the cursor over a model row displays that model’s plot.
To investigate an individual model’s results, select that model’s name in the Model column. BMDS will overlay a window showing all the numerical and graphical model outputs for that model.
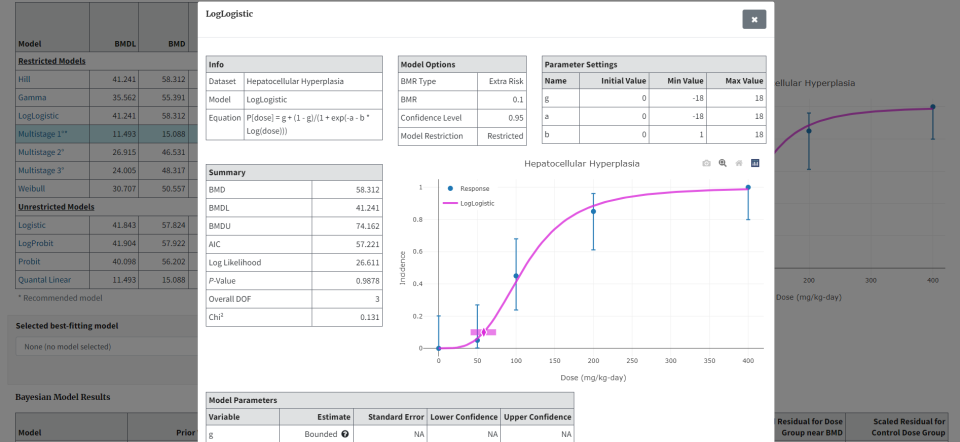
Figure 38. Select a model’s name to display a window showing all results for that model.
Recommended MLE Models
For the maximum-likelihood estimation (MLE) models, BMDS Online applies a set of model selection logic criteria to recommend a best fitting model (the blue row marked Recommended). The logic criteria used to make the recommendations are located on the Logic tab.
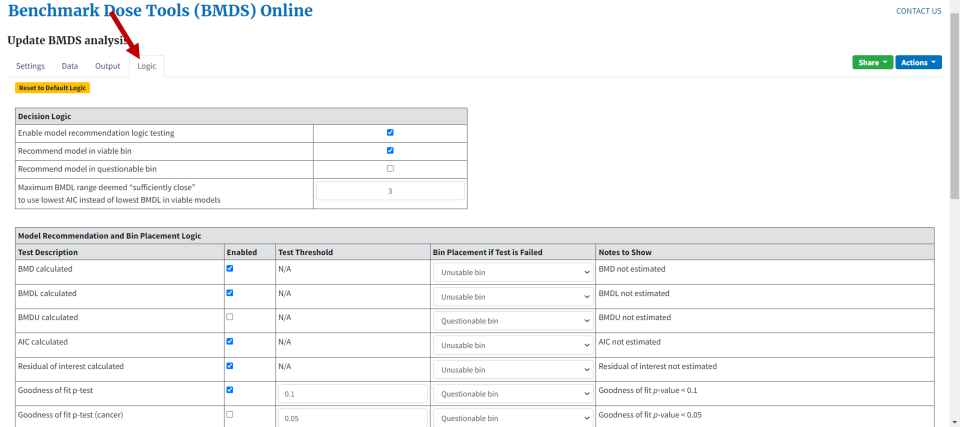
Figure 39. The Logic tab contains the rules BMDS Online uses to make model recommendations. It is highly recommended to leave the settings as-is.
On the Logic tab, you can investigate the criteria BMDS Online used to recommend the best-fitting model. Users can change any of the criteria for model selection based on the needs of their analysis or to comport with the modeling guidance of their organizations. However, it is highly recommended that new users leave the logic settings as-is; logic settings should only be changed under the guidance of experienced modelers. For more information, refer to Model Recommendations and Decision Logic.
If any logic setting changes, the default logic settings can be reapplied by selecting the Reset to Default Logic button.
Selecting the Best Fitting Model
Back on the Output tab, the user can choose the recommended model, or an alternative, from the Selected best-fitting model picklist.
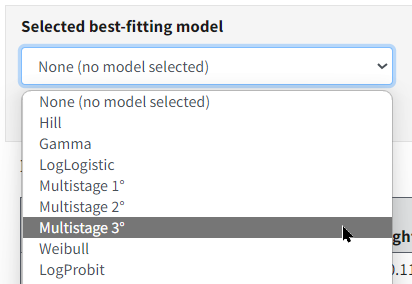
Figure 40. The Selected best-fitting model picklist, with the Multistage 3 model selected.
Enter notes on model selection in the Selection notes field. Click the Save model selection button to save this documentation with the results analysis. This documentation will be included in the downloaded Word report.
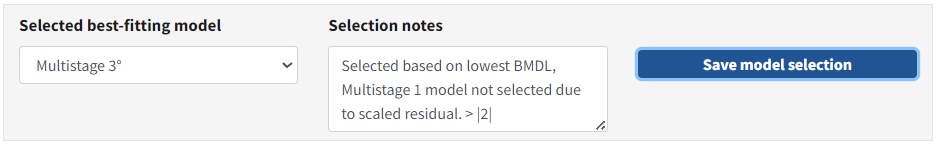
Figure 41. Use the Selection notes box to record the reason why a specific model was selected.
Select the Save model selection button to finalize model selection. BMDS Online displays the selected model row in green, and any selection notes will be displayed in a footnote at the bottom of the table.
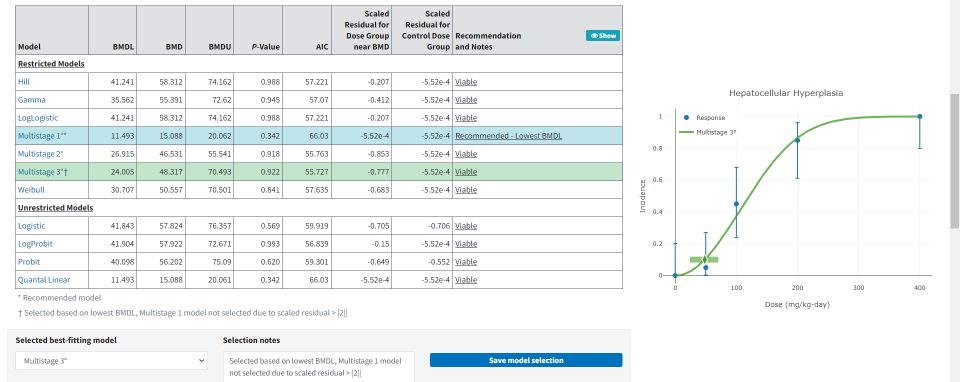
Figure 42. The final output table: recommended row in blue, user-selected row in green, and footnotes.
Individual model and model averaging results can also be investigated by clicking on the desired row in the results table. In the following figure, the Model Average link is selected to display the Model Average results graph. Hover the mouse across the curves to investigate results in more detail.
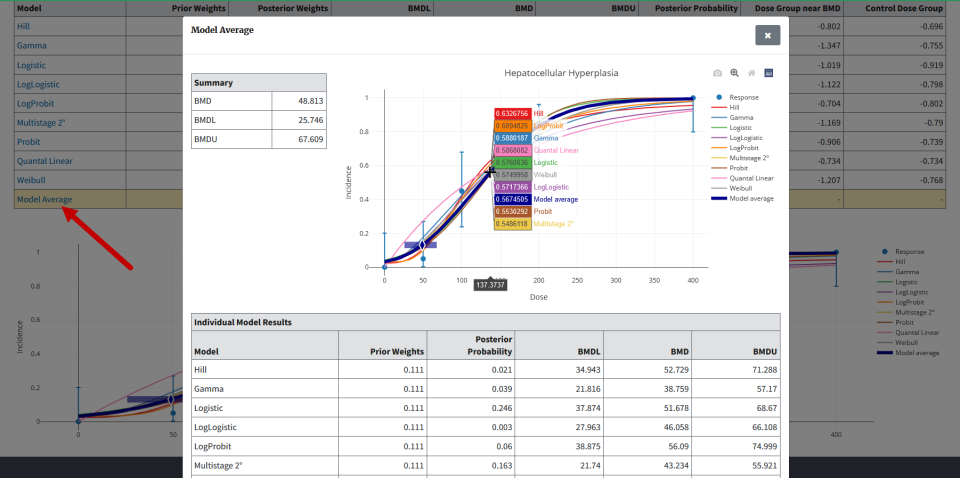
Figure 43. Selecting the Model Average link from the Bayesian Model Results table displays the Model Average results window. Hover the cursor over the results curves to display more details on each model’s result.
Sharing and Downloading Analyses and Results
After an analysis has been configured and successfully executed, it can be shared with others or downloaded.
The Share and Actions menus in the top-right corner of the BMDS Online application include options for other ways to interact with the analysis.
Note
BMDS Online analyses are linked to the URL of the current session. To get back to that analysis later: email the link to yourself or save the link in a Microsoft Word document with a full description of the analysis.
Share Menu
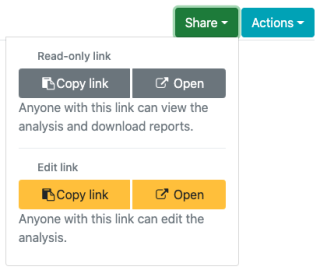
Figure 44. BMDS Online Share menu options.
Read-only links: users can share read-only links so collaborators can view the current analysis and download reports but cannot edit or execute the analysis. When users click on a Read-only link, they now have an option to “clone” the analysis. Essentially this allows recipients of the Read-only link to copy the original analysis and modify it without altering the original analysis.
Edit link: users can share links to collaborators so they can edit the analysis settings, change input data, and re-execute the analysis.
Constraints on Sharing Analysis URLs
Only the most recent analysis is available. BMDS Online analyses are linked to the URL of the current session. When a link is shared, only the most recent execution of that analysis is preserved and will be available to others. Therefore, if you need to perform more work after sharing an analysis link, we recommend creating a new analysis.
Analyses are deleted after three years unless extended. If you share the link with others, note that analyses are deleted after three years, unless retention of the analysis is extended from the Actions menu. The Download analysis feature can be used to save and share analyses that need to be retained long-term.
Actions Menu
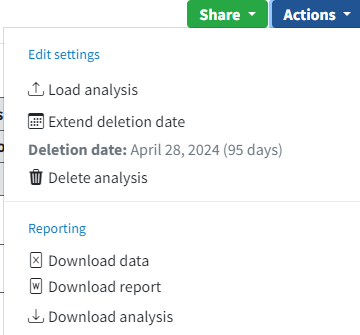
Figure 45. BMDS Online Actions menu options.
Load analysis: Load a previously downloaded analysis.
Extend deletion date: BMDS Online will store analyses for three years after the date of creation. Select Extend deletion date to extend deletion to three years from the time this button was clicked.
Delete analysis: Delete the current analysis. If an analysis is deleted, it cannot be restored.
Download data: Download the analysis as an Excel file. By default, the user-specified Analysis Name is the Excel filename; the user can change the filename before saving. The Excel file contains all the datasets, their option settings, and their analysis results.
Download report: Download the analysis results as a Word file. Options for the Word report can include only the user-selected model, all models, and all models with the BMD Cumulative Data Function (CDF) table. Note that the Word report contains the analysis URL, and users can access their analyses via the generated report. The name given to the Word file is the user-specified Analysis Name.
Important
The BMDS Desktop report does not include URLs because the analysis resides on the user’s local system rather than the Internet.
Download analysis: Download the analysis as a JSON file. This is a machine-readable file format that can be saved or shared, and then uploaded into BMDS Online via Load analysis. The name given to the JSON file is the user-specified Analysis Name.
Microsoft Word Report
Select the Actions menu’s Download report option to display the following panel where the user can customize what will appear in the report.
The Long dataset format option is recommended for most users. Selecting the options Include all models and Include BMD CDF Table make the report considerably longer.
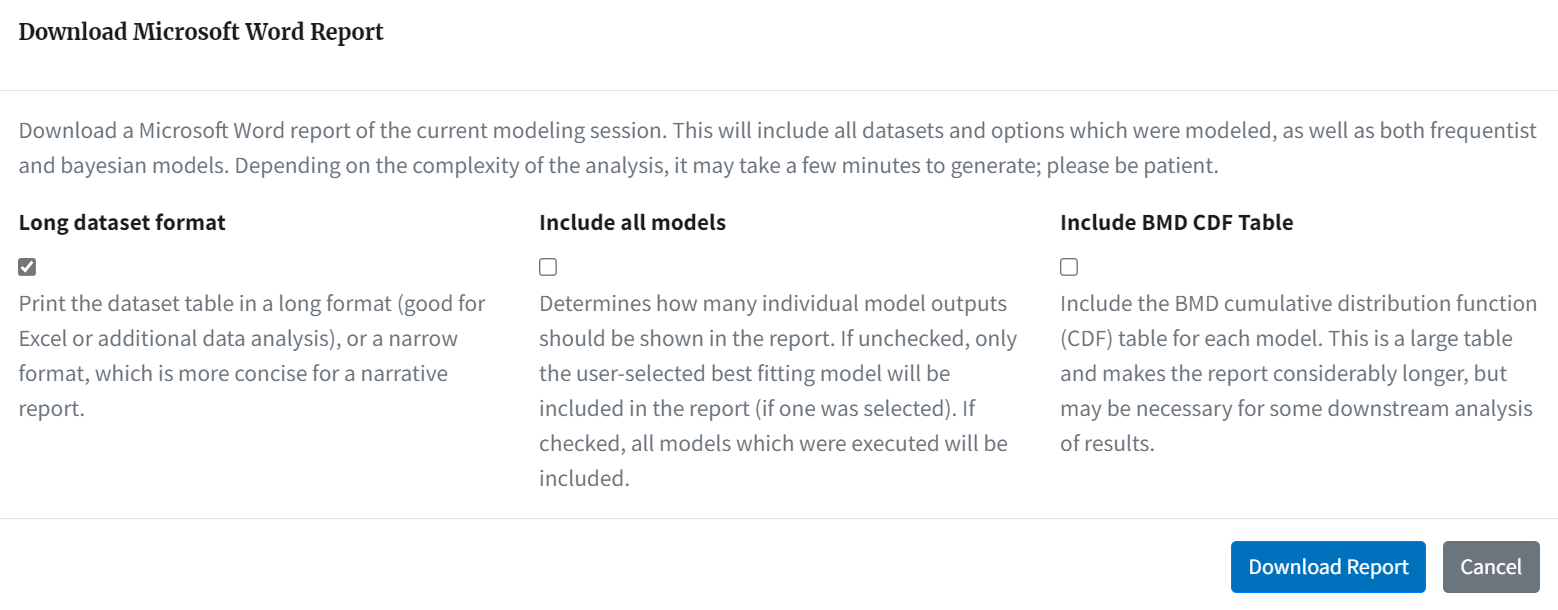
Figure 46. The Actions Download report option displays items the user can include in the Word report.
Citing BMDS Results
An exported Word report contains a recommended citation for that product; for example, a report from BMDS Desktop will show only the BMDS Desktop citation. The user can adapt the citation as appropriate.
The following example citations include each application’s package version and timestamps to aid in reproducing the analysis.
U.S. Environmental Protection Agency. (2025). BMDS Online (25.1; pybmds 25.1; bmdscore 25.1) [Software]. Available from https://bmdsonline.epa.gov. Accessed March 17, 2025.
U.S. Environmental Protection Agency. (2025). BMDS Desktop (25.1; pybmds 25.1; bmdscore 25.1) [Software]. Available from https://pypi.org/project/bmds-ui/. Accessed March 17, 2025.
U.S. Environmental Protection Agency. (2025). pybmds (25.1; bmdscore 25.1) [Software]. Available from https://pypi.org/project/pybmds/. Executed on Accessed March 17, 2025.