Overview
BMDS for Dose-Response Modeling
BMDS facilitates dose-response modeling. BMDS models are currently accessible via an online browser-based web application (BMDS Online), a desktop application (BMDS Desktop), or in a scripting environment (pybmds).
Dose-Response Modeling
Dose-response modeling is a technique, often used in toxicology and risk assessment, for quantitatively relating exposure (the dose) to a biological outcome (the response). It may be thought of as an elaborate form of regression, which is the statistical technique used to explore or represent the relationship(s) between two (or more) variables.
In the dose-response context, the dose term (e.g., mg of chemical per kg body weight per day) is most often viewed as the “cause” of the response (e.g., presence of a tumor or other manifestation of disease or a measure of the weight of some organ that might be susceptible to the toxic effects of the exposure).
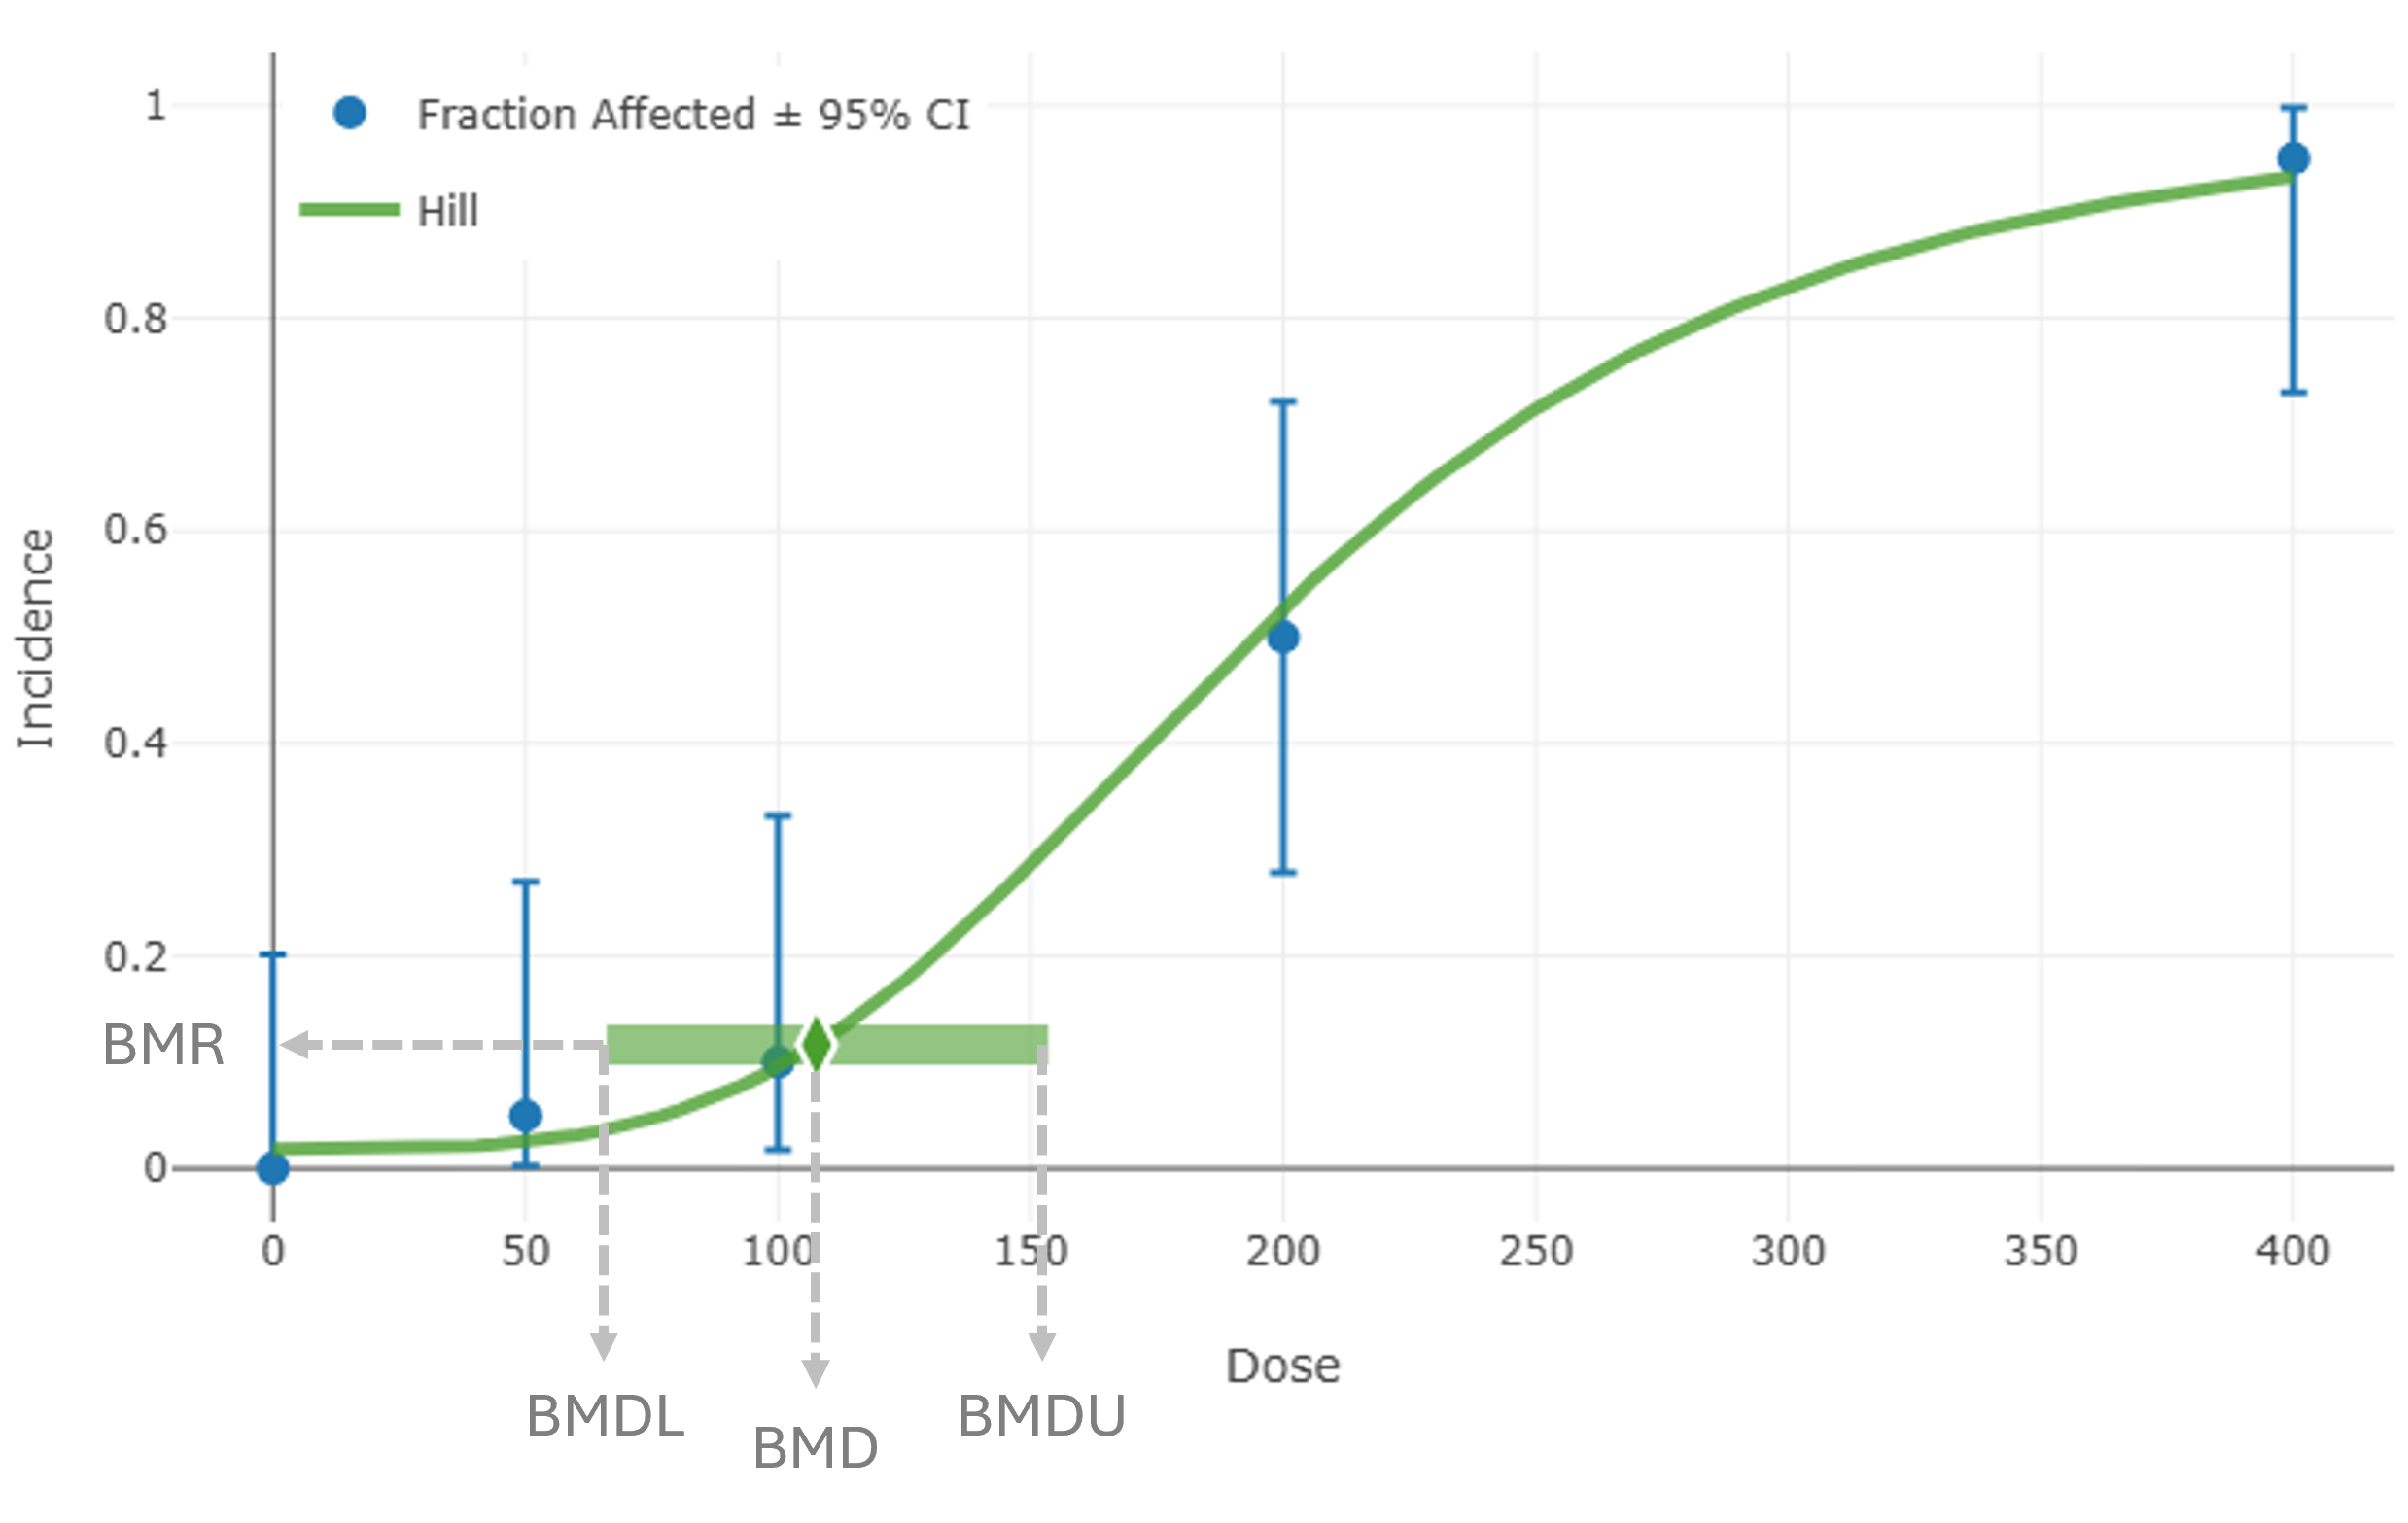
Figure 1. The dose-response relationship
As Figure 1. shows, the benchmark dose (BMD) is the dose amount estimated to produce a response (BMR) of a specific magnitude in the test subject.
The BMD is a dose estimated to produce a response level of a defined (benchmark) magnitude. The online BMDS Glossary defines the BMD as follows:
An exposure due to a dose of a substance associated with a specified low incidence of risk, generally in the range of 1% to 10%, of a health effect; or the dose associated with a specified measure or change of a biological effect.
The BMD can be thought of as a range, rather than a fixed number. The BMD’s lower confidence limit (BMDL) is a dose where the observable physical effect is less than the predetermined BMR. The BMD’s upper confidence limit (BMDU) is a dose where the observable effect is greater than the predetermined BMR.
EPA’s Benchmark Dose Software (BMDS) provides easy access to numerous dose-response models that help risk assessors estimate the quantitative relationship between a chemical dose and the test subject’s response. The user can select from and/or compare the models to make predictions about the quantitative relationship between dose and response. A specific focus of this software is the estimation of a statistical benchmark dose (BMD), including bounds (e.g., 95% confidence intervals) on such estimates.
Types of Responses Modeled
Another key aspect of dose-response modeling is that the models, statistical assumptions, and techniques that it uses depend on the type of response under consideration.
For BMDS, as reflected many times over in this user guide, the distinctions that are made (i.e., for which separate and distinct modeling approaches are applied) can be categorized with respect to the following three types of response: continuous endpoints, dichotomous endpoints, and nested dichotomous endpoints. (Nested continuous endpoints will be added to a future release.)
The key features of those response (endpoint) types are as follows:
Continuous Endpoints: the response is measured on a continuous scale, so its valid values are real numbers (often restricted to positive values, but not always). Organ weight, body weight, and concentration levels of biological markers are all examples of continuous endpoints whose values might be affected by exposure to the compound under consideration.
Dichotomous Endpoints: the response here is the presence or absence of a disease state or other “counter” of system malfunction. In this case, each experimental unit will either have the response or not. Dichotomous dose-response models predict the proportion of such units that have the response. Tumor responses are a subcategory of dichotomous endpoints with cancer-specific model selection considerations that are automated in the BMDS Multitumor model; for more information, see Multiple Tumor Analysis.
Nested Dichotomous Endpoints: as for Dichotomous endpoints, the presence or absence of a disease state or counter is the response. However, in this case each experimental unit may have more than one such count (i.e., the counts are nested within an experimental unit). The most common example of such an endpoint is with developmental toxicity experiments in which the experimental unit is the pregnant dam and the fetuses or offspring from each dam’s litter are examined for the presence or absence of an effect (e.g., malformation).
Collectively, the application of the methods for fitting mathematical models to data is referred to as BMD modeling or the BMD approach. BMDS facilitates these operations by providing simple data-management tools and an easy-to-use interface to run multiple models on one or more dose-response datasets.
Presentation of Model Results
As Figure 2. shows, BMDS presents model results in text and graphic outputs that can be printed or saved and incorporated into other documents. Results from all models include:
Model-run options chosen by the user
Goodness-of-fit information
BMD
Estimates of the bounds (e.g., confidence limits) on the BMD (notated BMDL and BMDU for the lower bound and upper bound, respectively)
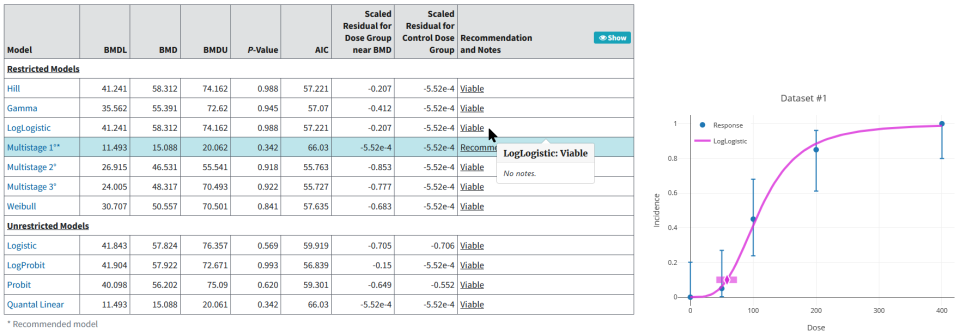
Figure 2. BMDS results for a dichotomous endpoint, presented using graph and tables
How EPA Uses BMD Methods
EPA uses BMD methods to derive reference doses estimates (such as reference doses (RfDs), reference concentrations (RfCs), and slope factors, which are used along with other scientific information to set standards for human health effects.[1]
Prior to the availability of tools such as BMDS, noncancer risk assessment benchmarks such as RfDs and RfCs were determined from no-observed-adverse-effect levels (NOAELs), which represent the highest experimental dose for which no statistically or biologically significant increase in an adverse health effect has been documented.
However, using the NOAEL in determining RfDs and RfCs has long been recognized as having limitations:
It is limited to one of the doses in the study and is dependent on study design.
It does not account for variability in the estimate of the dose-response.
It does not account for the slope of the dose-response curve.
It cannot be applied when there is no NOAEL, except through the application of an uncertainty factor (Kimmel and Gaylor, 1988; Crump, 1984).
A goal of the BMD approach is to define a starting point of departure (POD) for the computation of a reference value (RfD or RfC) or slope factor that is more independent of study design. The EPA Risk Assessment Forum has published technical guidance for the application of the BMD approach in cancer and non-cancer dose-response assessments (U.S. EPA, 2012).
BMDS Development History
Research into model development for BMDS started in 1995 and the first BMDS prototype was internally reviewed by EPA in 1997. After external and public reviews in 1998-1999, and extensive Quality Assurance testing in 1999-2000, the first public version of BMDS, version 1.2, was released in April 2000. Since that time, BMDS has been transformed from a standalone Windows application to an Excel-based application in 2018, and then to a browser-based web application in 2022. Python-based BMDS Desktop and pybmds were released in 2024.
The 2018 release of BMDS 3.0 included Bayesian versions of all maximum-likelihood estimation (MLE) dichotomous models, and Bayesian model averaging using all or weighted dichotomous models.
The BMDS application history is documented on the BMDS website.
What’s New in BMDS
BMDS is the U.S. EPA’s primary application for benchmark dose-response modeling and includes multiple applications for conducting dose-response analyses according to user needs and preferences.
BMDS Online leverages aspects of the familiar BMDS 3.x Excel interface yet delivers faster performance and enables greater accessibility for users. Now, instead of downloading and installing an Excel macro-based application, users only need an internet connection to run a BMD analysis.
There is also the added flexibility of offline processing with BMDS Desktop and pybmds.
Privacy is Respected
The BMDS Online application does not track personal information about users of the software.
Results Saved for Three Years
BMDS Online will save datasets and analyses for three years; users can rerun or delete an analysis at any time, and they can optionally “renew” an analysis to continue saving for another three years.
If data sensitivity is an issue, BMDS Desktop or pybmds should be used for offline analysis.
Work Offline with BMDS Desktop and pybmds
The 2024 BMDS Online upgrade included the release of two new applications:
BMDS Desktop is a Python-based version of BMDS Online that runs offline in a web browser and replaces the Excel-based BMDS 3.3. It is intended for users with increased data privacy or sensitivity concerns that prevent them from being able to run BMD analyses on EPA infrastructure. The user interface for BMDS Desktop is identical to that of BMDS Online.
pybmds enables users to run dose-response analyses in a scripting environment, along with running high-throughput or batch analyses of thousands of individual datasets. pybmds is a command-line application and is intended for the advanced user with some development experience.
For more information, refer to BMDS Desktop and pybmds.
Active Development Stopped on BMDS 3.3
Active development has stopped on the Excel-based BMDS 3.3 application. While the Excel framework for the application was modern and familiar to users when BMDS 3.0 was released in 2018, several issues hampered innovation and maintenance:
Excel incompatibilities across different versions of Microsoft Office.
Limitations to the design of the user interface both functionally and aesthetically.
Slow performance when writing to Excel workbooks and Word reports.
Limitations in Excel’s Visual Basic for Applications (VBA) programming language hindered BMDS development and complicated its maintenance.
BMDS Excel’s macro-based nature occasionally triggered workplace security restrictions that stalled or prevented uptake of BMDS within some organizations.
BMDS Online, BMDS Desktop, and pybmds are now the primary applications where new development and innovation will occur. As a web-application with no requirement to download any software, BMDS Online also offers an easier introduction to BMD analysis for new users.
BMDS 3.3 will remain downloadable but will receive no further updates.
Recent Key Improvements and Enhancements
All improvements and enhancements listed below are available in BMDS Online, BMDS Desktop, and pybmds:
Addition of Multistage Cancer/Multitumor model, along with a poly-k adjustment tool (24.1 release)
Addition of the Nested Logistic nested dichotomous model for developmental toxicity data (24.1 release)
Addition of the NCTR nested dichotomous model for developmental toxicity data (25.1 release)
Addition of the Rao-Scott transformation tool (25.1 release)
Ability to clone an analysis after clicking a Read-only link (25.1 release)
Enhancements and under-the-hood fixes to improve efficiency, error handling, and stability for future development (24.1 and 25.1 releases)
Bug fixes (24.1 and 25.1 releases)
For a complete list of what’s new or changed in the current release, refer to the BMDS website’s Release History page.
BMDS Resources
BMDS Website
The BMDS website contains the most up-to-date information on BMDS.
In addition to the latest downloadable version of BMDS, the site includes links to troubleshooting and usage tips, BMDS Online Release History, links to technical guidance, links to external and peer-review information on models used in BMDS, and opportunities to participate in the development of the next generation of BMDS models.
BMDS Mailing List
The BMDS mailing list is the best way to stay current with software development, training opportunities, and other information relevant to your work with BMDS.
The BMDS mailing list is low traffic; members receive about 2-4 announcements per year.
To join the mailing list, please sign up on the BMDS website.
BMDS Source Code
The BMDS source code is available from the following GitHub sites:
pybmds and BMDS core code: https://github.com/USEPA/bmds
BMDS Desktop and BMDS Online: https://github.com/USEPA/bmds-ui
Python packages to install pybmds and BMDS Desktop are available from the Python package inventory (pypi) at:
The documentation for BMDS Desktop and pybmds are at https://usepa.github.io/BMDS/.
BMDS Support
The BMDS Contact Us page serves as the online Help Desk for all BMDS applications. Post questions, concerns, comments, or suggestions on any aspect of the software or its usage.
Important
Final Product This document has been reviewed in accordance with the U.S. Environmental Protection Agency, Office for Applied Science and Environmental Solutions, and approved for publication