Results Output Common to MLE Models
BMDS results provide the user with goodness-of-fit criteria and model results to aid in determining the appropriateness of the Model and Option Set to the benchmark dose derivation.
BMDS Online displays summary results for the analysis for the Model and Option Set in the Output tab. From the Output tab, the user can then select an individual model’s detailed results and statistics. Individual model results open in their own window when the model name is selected.
All Models: Output Tab
The Output tab displays several tables of results and calculations depending on the type of endpoint.
Dataset and Option Set tables: Reproduces the dataset and option set selections for the analysis.
Maximum Likelihood Approach Model Results table, for both Restricted and Unrestricted models. The table includes key fit statistics with BMDS recommendations for best-fitting model.
Graph of the dataset; hover the pointer over a model name to display the curve.
Model Selection block where the user can document the best-fitting model.
Bayesian Model Results table (Dichotomous only) and graph.
The following wireframe diagrams provide a simple overview of the tables and plots shown on the Output tab for each endpoint type.
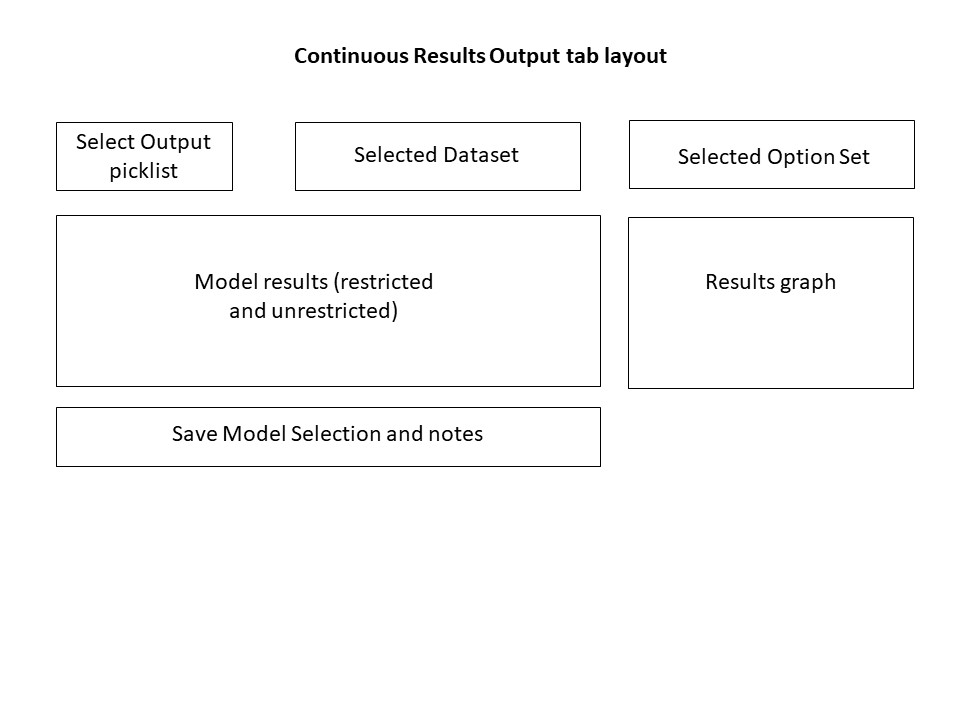
Figure 47. Continuous Results Output tab layout.
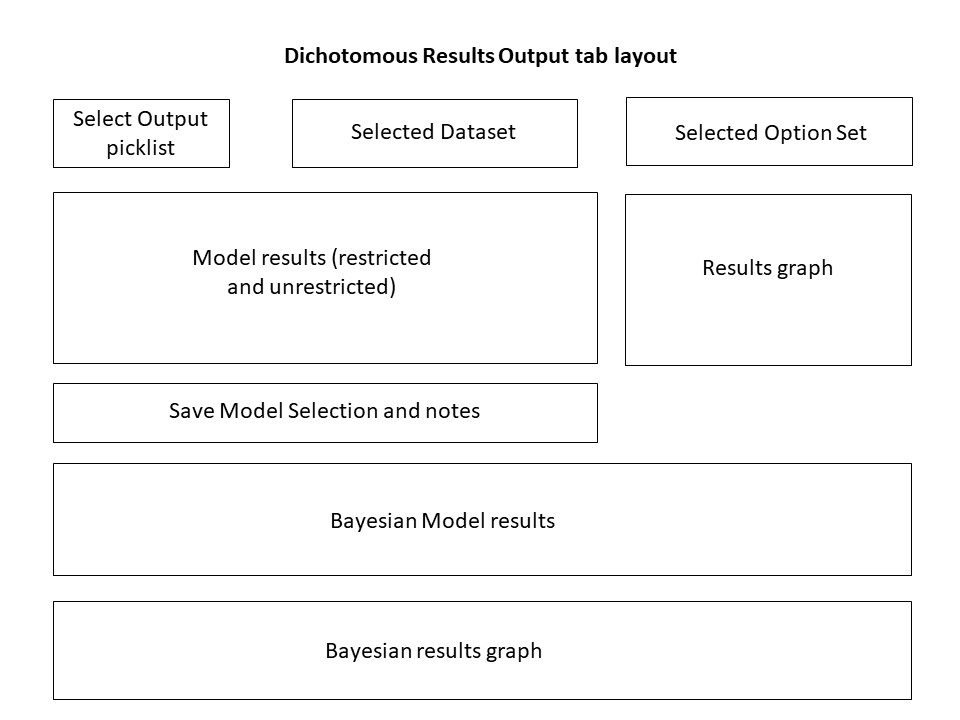
Figure 48. Dichotomous Results Output tab layout.
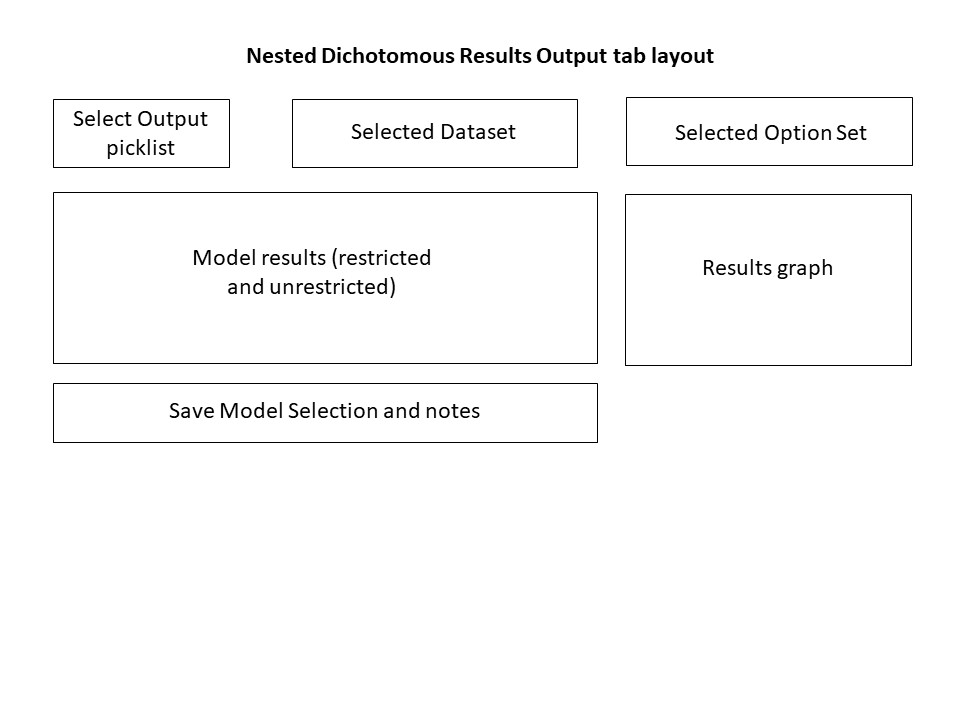
Figure 49. Nested Dichotomous Results Output tab layout.
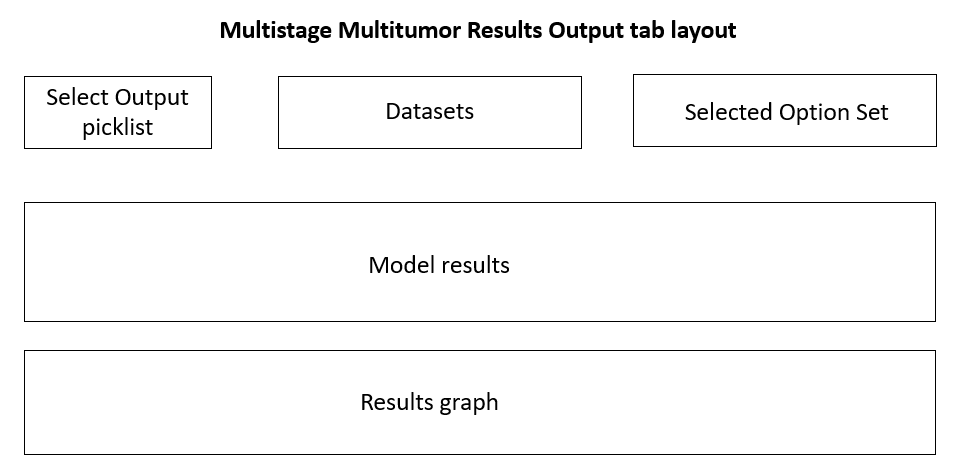
Figure 50. Multistage Multitumor Results Output tab layout.
Individual Model Results
From the Output tab’s Maximum Likelihood Approach Model Results table, select any model link Figure 51. to display a popup window thoroughly detailing that model’s stats results Figure 52..
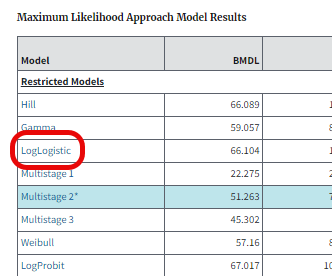
Figure 51. Select a model name in the results table …
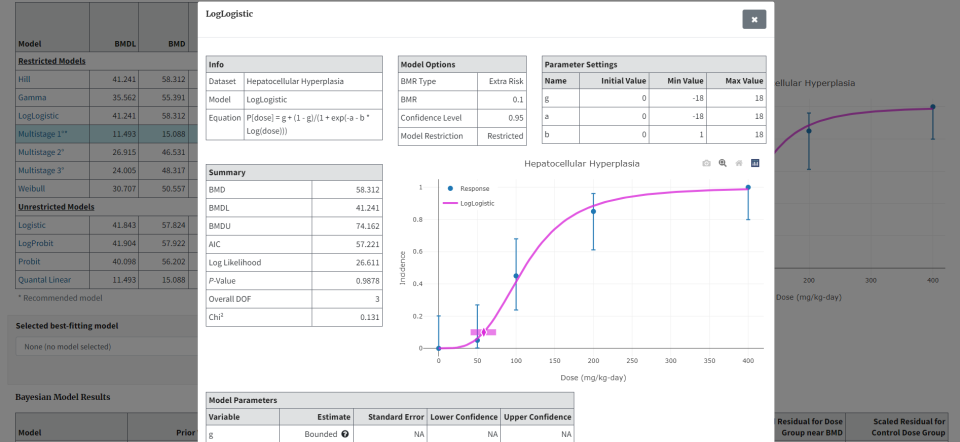
Figure 52. … to display a window showing all results for that model.
Individual Model Result Window Layouts
The individual model results window layout differs based on the type of endpoint: continuous, dichotomous, and nested dichotomous. The following wireframe diagrams illustrate the results displayed by BMDS for each model type.
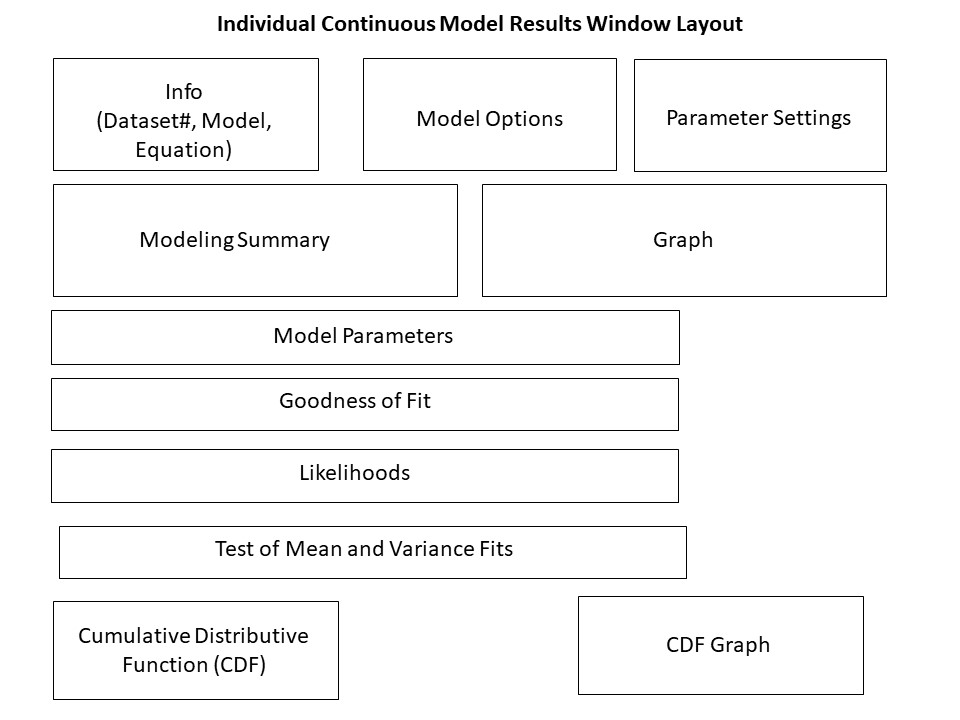
Figure 53. Continuous model result window layout.
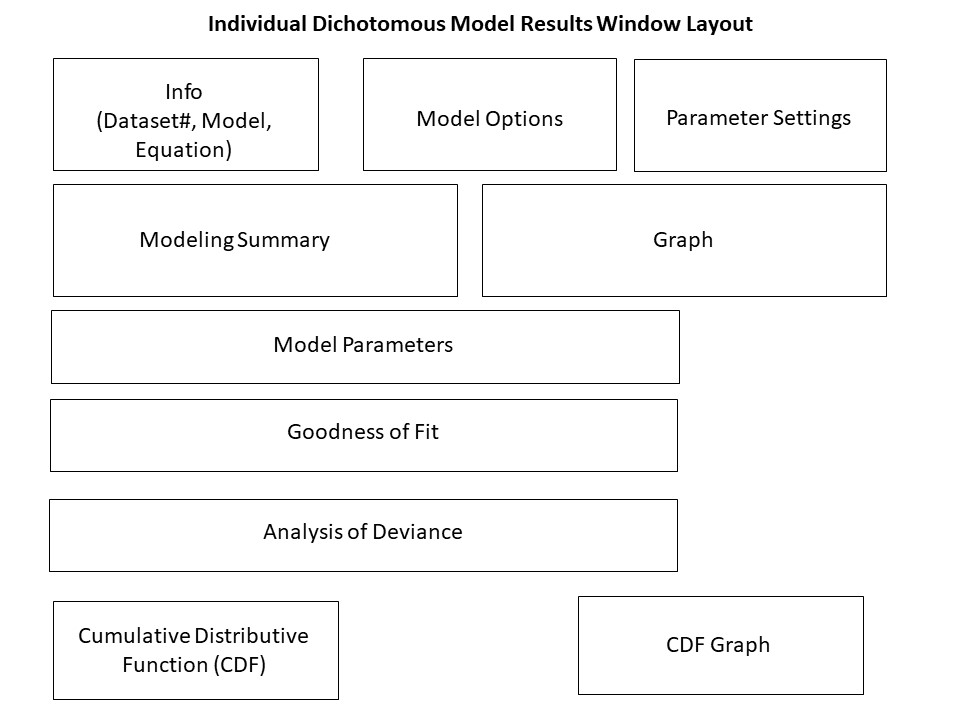
Figure 54. Dichotomous model result window layout.
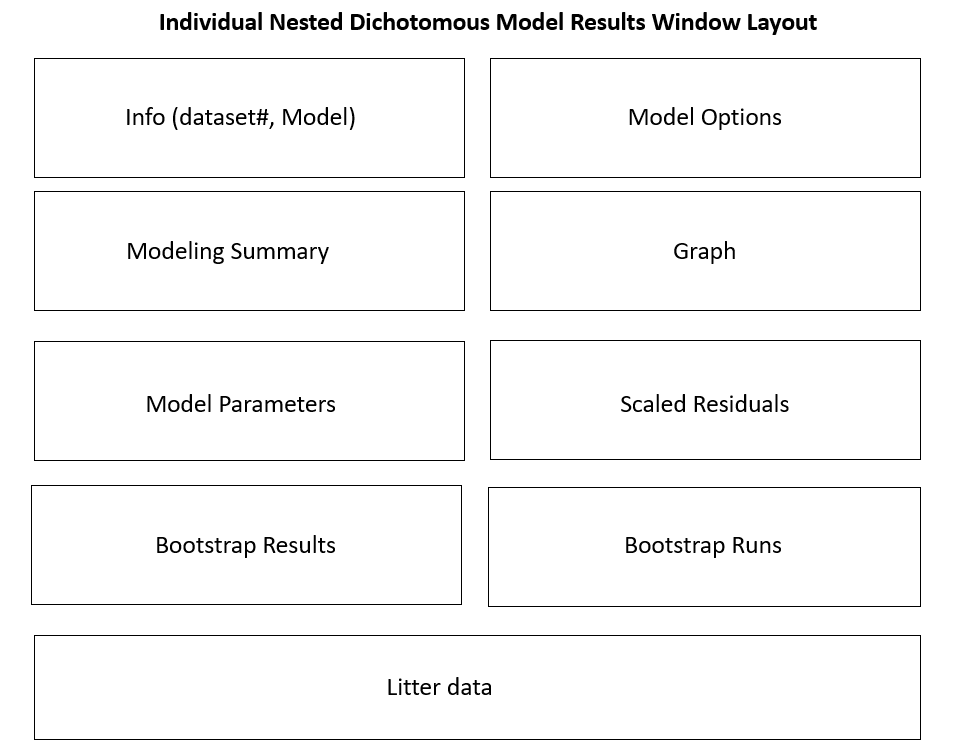
Figure 55. Nested Dichotomous model results window layout.
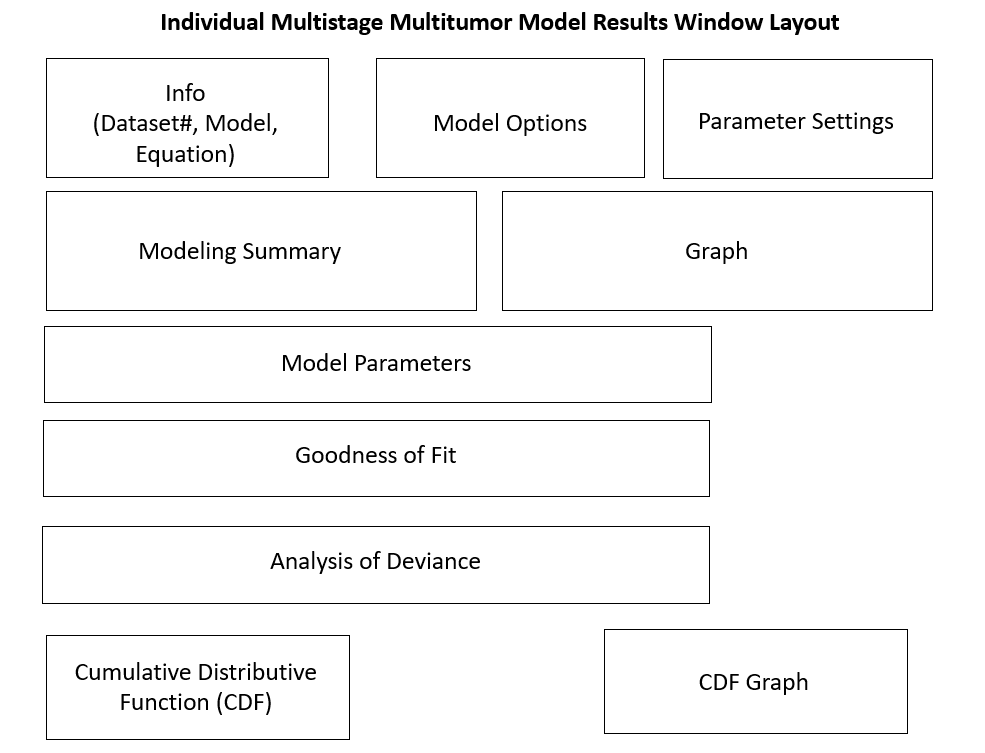
Figure 56. Multistage Multitumor model results window layout.
Summary Table of Key Fit Statistics (All Endpoints)
A model result window’s Modeling Summary table for the Model-Option set contains—depending on the endpoint type—the BMD, BMDL, and BMDU estimates, AIC, Log Likelihood, the overall goodness-of-fit test p-value, and degrees of freedom (d.f.).
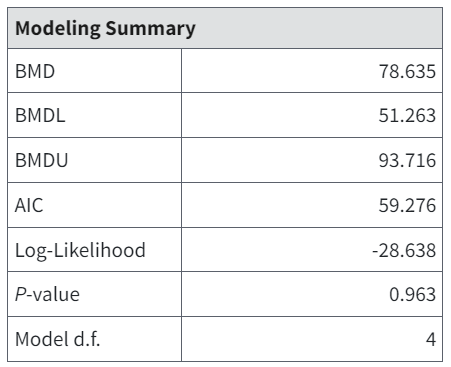
Figure 57. Example Modeling Summary table for a dichotomous model.
AIC
The Akaike Information Criterion (AIC) (Akaike, 1973) value is calculated as follows:
where \(LL\) is the log-likelihood at the maximum likelihood estimates for the parameters, and \(p\) is the number of model parameters estimated (and not on a restriction boundary).
Important
For the dichotomous and nested dichotomous models, an additivity constant is not included in the LL calculations.
The AIC can be used to compare different models fit (using the same fitting method, e.g., least squares or maximum likelihood) to the same dataset. Smaller values of the AIC indicate better fit. Although AIC comparisons are not exact (they rely on rules of thumb for interpreting AIC differences), they can provide useful guidance in model selection.
Model-type specific details on the AIC are discussed in the following sections:
P-value
The goodness-of-fit p-value is computed based on the degrees of freedom and the Chi-square, \(\chi^{2}\), value. The \(\chi^{2}\) value is assumed to be distributed as a Chi-square distribution having degrees of freedom equal to the number of dose groups minus the number of model parameters estimated off a boundary.
The p-value measures the “closeness” of the model predictions to the observed data. If the overall p-value is larger than some predetermined critical p-value, then the user might infer that the model appropriately describes the observed dose-response pattern. The critical p-value used by EPA is generally 0.1 but is sometimes relaxed to 0.05 for the Multistage model when it is applied to cancer data (U.S. EPA, 2012).
Model Parameters Table (All Endpoints)
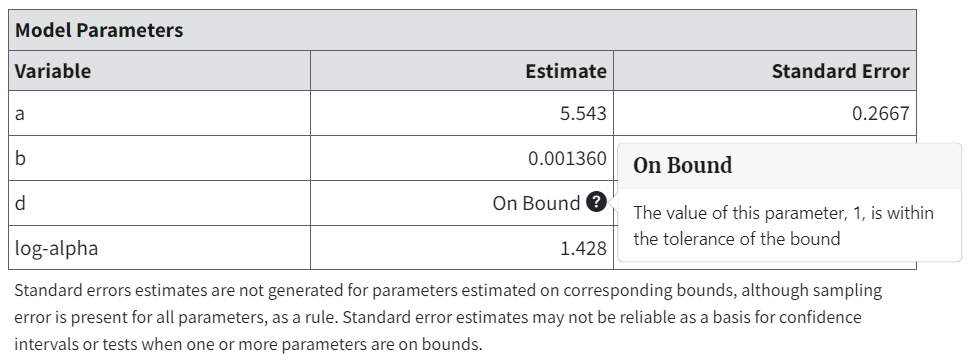
Figure 58. Model Parameters table for Exponential 3 (Continuous), with popup description of bounded variable.
The Model Parameters table includes the estimates for the parameter values that “optimize” the model fit.
Parameter estimates are checked to see if they fall within a given tolerance (\(1.0e^{-6}\)) of parameter boundaries. If so, they are marked as On Bound. This tolerance value applies to all parameters.
Cumulative Distribution Function (CDF) Table (All Endpoints)
CDF stands for cumulative distribution function, in this case for the BMD estimate. It lists the percentiles associated with the CDF for the BMD being estimated (Figure 59.).
Note that the BMD value associated with the CDF value of 0.5 is the MLE of the BMD (and matches the value reported for the BMD in the Summary table discussed above).
The CDF block may also correspond to the Summary table in terms of the BMDL and BMDU values reported in the latter. Recall that the confidence level specified by the user in the options is a one-sided confidence level. So, if that confidence level is related to one of the cumulative percentiles in the CDF block, the BMD values will match.
As an example, if the confidence level specified by the user is 0.95 (95% one-sided confidence limits requested), then the BMDU from the Benchmark Dose table will match the BMD value listed for 0.95 in the CDF block. And the BMDL will match the BMD value listed for 0.05 in the CDF block.
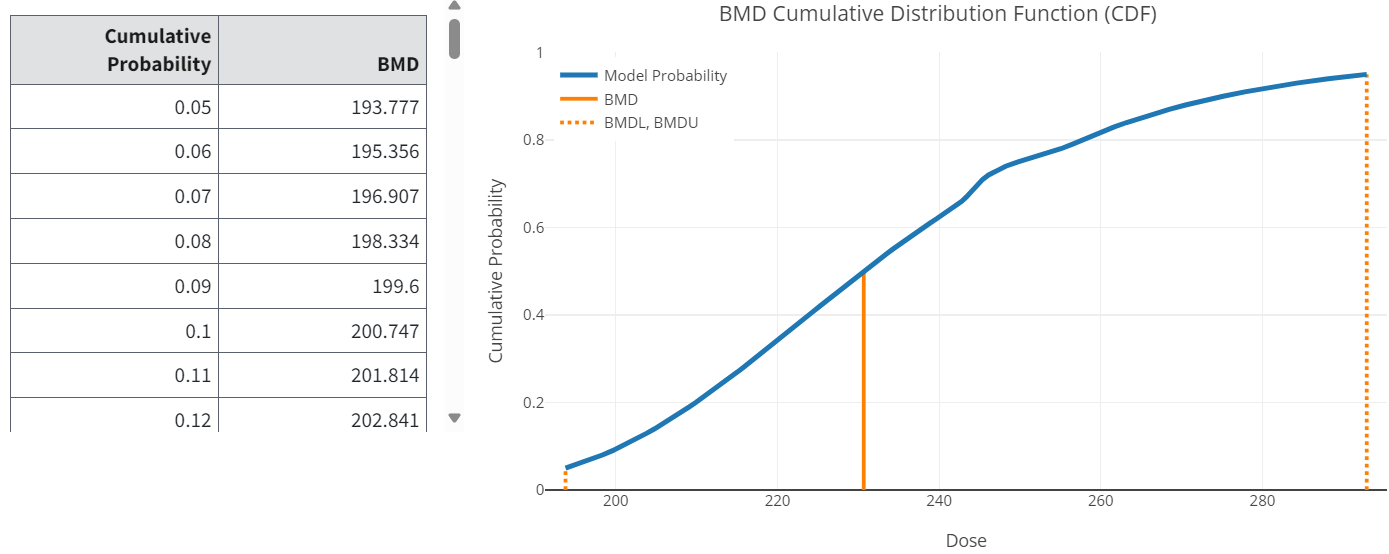
Figure 59. CDF table and graph.
Important
Why is BMDS reporting different cumulative distribution function values for different confidence levels?
BMDS may report different Cumulative Distribution Function (CDF) percentile values when different user-specified confidence levels (alphas) are chosen. These differences are not a bug in BMDS. Rather, these CDF ranges — and any differences in CDFs based on different confidence levels — are calculated by the underlying Gnu Scientific Library’s methods, not by BMDS. Differences in CDFs should not affect repeatability or reliability of results. However, users should use discretion when comparing CDF values to BMDL/BMDU values calculated from different confidence levels. For example, if a user inputs a 90% confidence level (alpha = 0.1), the BMDU is not guaranteed to match the 90% percentile from the CDF when using a 95% confidence level (alpha = 0.5).
Graphs/Plots (All Endpoints)
Graphical outputs (plots) are displayed on both the Output tab and on the individual model result window.
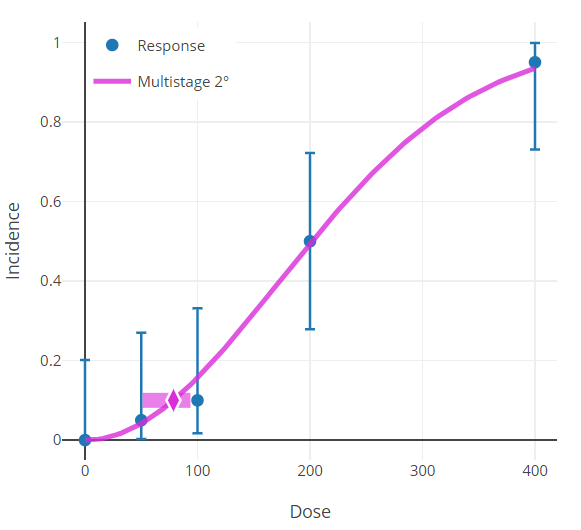
Figure 60. Results plot for the Multistage 2 model.
The results plot shows the dose-response curve estimated by the model.
Data points are shown as blue dots with their individual group confidence intervals.
The horizontal bar is centered on the y-axis at the modeled BMR.
The diamond symbol inside the horizontal bar is the BMD.
The horizontal bar’s left edge is the BMDL, the right is the BMDU.
Error bar calculations for the data points differ slightly based on the endpoint: