Multiple Tumor Analysis
Multiple tumor analysis is most often limited to analyses of cancer data where the component datasets are for tumors occurring at various sites, hence its name.
The BMDS modeling option Multistage Cancer/Multitumor is a special application of dichotomous modeling. It is offered as a convenience to the user who may be interested in evaluating the combined effect of two or more independent, dichotomous responses.
The multiple tumor model is specialized in the additional sense that it only runs multistage models to fit the dose-response relationship. The model returns BMD estimates (and related bounds) for the risk of responding with one or more of the endpoints in question.
Users can run the BMDS Multistage Multitumor model to determine the BMD, BMDL, and BMDU that are associated with a specified added or extra risk of experiencing at least one of the multiple tumor types.
BMDS also provides users with the option to manually select or allow BMDS to auto-select the degree of Multistage model to apply to each dataset. The auto-selection process follows the most recent EPA technical guidance for selecting the Multistage model degree for the analysis of cancer datasets, which differs from the model selection process described by EPA (2012) for other modeling scenarios.
Previous versions of BMDS referred to the EPA’s Multistage Multitumor model as MS_Combo, but this term is no longer used.
Assumptions
The analyses of multiple tumors have the following assumptions and results:
The tumors are statistically independent of one another.
Note
Unless there is substantial biological evidence to indicate that the tumor types are not independent—conditional on model parameter values—the approach based on independence is considered appropriate.
A multistage model is an appropriate model for each of the tumors separately. However, the individual multistage models fit to the individual tumors need not have the same multistage degree.
The user is interested in estimating the risk of getting one or more of the tumors under analysis; the results indicate the BMD and BMDL associated with the user-defined benchmark response (BMR) level, where the BMD and BMDL are the maximum likelihood and lower bound estimates of the dose that is estimated to give an extra risk equal to the BMR for the combination (getting one or more of the tumors).
In accordance with EPA cancer guidelines (U.S. EPA, 2005), a Multiple Tumor Analysis will always run the restricted form of the Multistage model.
Users can choose to have BMDS auto-select the appropriate multistage degree of the Multistage model for each tumor dataset. The option is available from the Degree picklist on the Settings tab (Figure 97.).
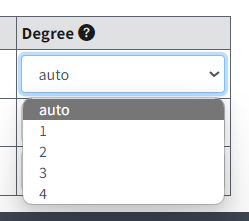
Figure 97. The Degree picklist with the auto-select option highlighted.
When the auto-select feature is used, BMDS runs all relevant forms of the Multistage Multitumor model and selects the multistage degree to use based on the current EPA Multistage model selection criteria for tumor analyses.
Although auto-select is the BMDS default option, the user can choose to manually set the multistage degree for each dataset. In any case, it is ultimately the user’s responsibility to ensure that the degree of the multistage and other selections for modeling parameters are as desired and appropriate for the dataset(s) being analyzed.
Multistage Multitumor Model Description
Note
Before using the Multistage Multitumor model, it is strongly recommended that users refer to the Technical Guidance on choosing the appropriate stage of a multistage model for cancer modeling.
The purpose of the Multistage Multitumor model in BMDS is to enable the user to calculate BMDs and BMDLs for a combination of tumors (corresponding to a defined risk of getting one or more of those tumors) when the individual tumor dose-responses have been modeled using a Multistage-Cancer model.
The output of a Multistage Multitumor model run will present the results of fitting each individual tumor (including the BMD and BMDL for that tumor) plus the combined log-likelihood, BMD, and BMDL for the combination of specified tumor responses.
In practice, the user should investigate each tumor individually and determine which degree of the Multistage-Cancer model is most appropriate for each individual tumor. That determination will involve all the usual considerations of fit, AIC, etc.
When a specific form of the Multistage-Cancer model is chosen for each of the tumors of interest (they need not have the same degree across all the tumors in question), the user should specify those choices in the analysis.
Note
The following descriptions are valid only when the tumors are assumed to be independent of one another (conditional on dose level).
Because of the form of the multistage model, the MLE estimates for the combined risk are a function of the parameter values obtained for the individual tumor multistage model fits. In fact, the combined probability function has a multistage model form:
and the terms of the combined probability function \((\beta_{0},\beta_{1},\ldots)\) are specified as follows:
etc.
where the sums are over \(i = 1, \ldots, t\), with
\(t\) being the number of tumors under consideration, and
\(β_{xj}\) being the \(x^{th}\) parameter (0, 1, …) for tumor \(j\).
The \(β_{xj}\) values are available directly from the Multistage-Cancer runs performed on the individual tumors. However, the Multistage Multitumor model performs the calculations for the user, completing the summations of the individual terms and computing the BMD based on the combined parameter values and the user-specified BMR.
A profile-likelihood approach is used to derive the BMDL:
Given the BMD and the log-likelihood associated with the MLE solution, a target likelihood is defined based on the user-specified confidence level (e.g., 95%).
That target likelihood is derived by computing the percentile of a Chi-square (1 degree of freedom) corresponding to the confidence level specified by the user (actually, the alpha associated with the confidence level, times 2).
That percentile is divided by 2 and subtracted from the maximum log-likelihood.
That derivation is based on a likelihood ratio test with one degree of freedom; it can be shown that estimating the BMDL corresponds to losing one degree of freedom, regardless of the number of tumors being combined.
The BMDL for the combined response (one or more of the tumors of interest) is defined as the smallest dose, \(d\), for which the following two conditions are satisfied:
There is a set of parameters such that the combined log-likelihood using \(d\) and those parameters is greater than or equal to the target likelihood, and
For that set of parameters, the risk at \(d\) is equal to the user-specified BMR.
Note that the combined log-likelihood is a function of the fits of the individual tumors (the sum of the individual log-likelihoods), obtained using their tumor-specific β values. Thus, the search for the parameters of the combined Multistage-Cancer model varies the individual-tumor β values in such a way that the individual log-likelihoods add up to a combined likelihood within the range desired (greater than or equal to the target). However, to satisfy the second constraint, the sums of the individual-tumor parameters (shown above to be the parameters of the combined probability function) are used to evaluate the risk for any proposed BMDL, D.
Note that the individual tumors need not be modeled with the same degree of the Multistage-Cancer model. Any terms not included for an individual tumor are assumed to be zero (and will remain at zero during BMDL optimization) in the summations shown above.
Entering Multitumor Data
A BMDS Online multitumor analysis can have a maximum of 10 datasets and up to three option sets. Add multiple datasets to BMDS as described in Insert and Save Multiple Datasets. Enable the datasets to be included in the analysis.
BMDS Desktop and pybmds have essentially no limit on the number of datasets or option sets, but it is recommended to create multiple analyses instead of putting large numbers of datasets into a single analysis.
Setting Degree for a Dataset
The user can specify the multistage degree for each dataset.
Choose whether BMDS auto-selects the appropriate multistage degree or whether it should be user-specified. Selectable values are auto, 1, 2, 3, or 4.
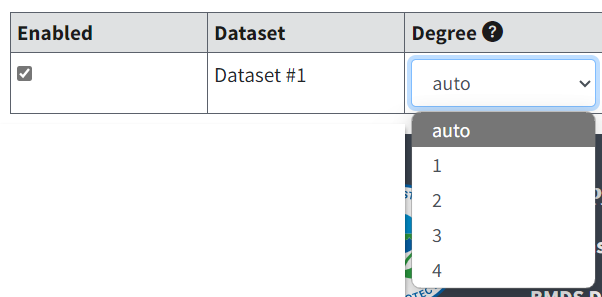
Figure 98. Dataset options for multitumor data.
The help text for the Degree column reads as follows:
If set to auto (default), all degrees to N-1 are executed and the best-fitting is used. If a numeric value, only that degree will be modeled.
BMDS will recommend a model degree based on the decision logic and settings found on the Logic tab for Dichotomous endpoints. For more details, refer to Model Recommendations and Decision Logic.
If the user opts for the auto-select functionality, the best fitting model is chosen according to the Technical Guidance on choosing the appropriate stage of a multistage model for cancer modeling. If no model can be chosen based on that criterion, then the model is removed from the Multistage Multitumor model results.
The Multistage Multitumor model decision logic uses the following criteria for the user-defined test thresholds from the Dichotomous Logic tab:
Ratio of BMD/BMDL (caution)
|Residual near BMD| too large
|Residual at control| too large
If a user specifies a degree for a given model, that degree will be used regardless of model fit.
If the results do not meet the Test Threshold value set in the Ratio of BMD/BMDL (Caution) setting on the Logic tab (Figure 99.), BMDS displays a pop-up message to the user that BMD/BMDL ratio > [value]; consider consulting a statistician. However, the model is not removed from the results.

Figure 99. BMDS Online will display an error message if the result does not meet the threshold value specified in this Dichotomous Logic tab setting.
Poly K Adjustment
The Poly K Adjustment is a special case of multitumor data analysis. The data displayed after the adjustment can be used in a standard BMDS multitumor analysis.
The Poly K Adjustment is an approach (based on the poly-k trend test developed by Portier and Bailer (1989)) to correct for treatment-related differences in survival across dose-groups in standard two-year cancer bioassays.
To access the Poly K adjustment tool:
Select Multistage Cancer/Multitumor on the Settings tab.
Select the Data tab.
Beneath the data table, select the link for Poly K Adjustment.
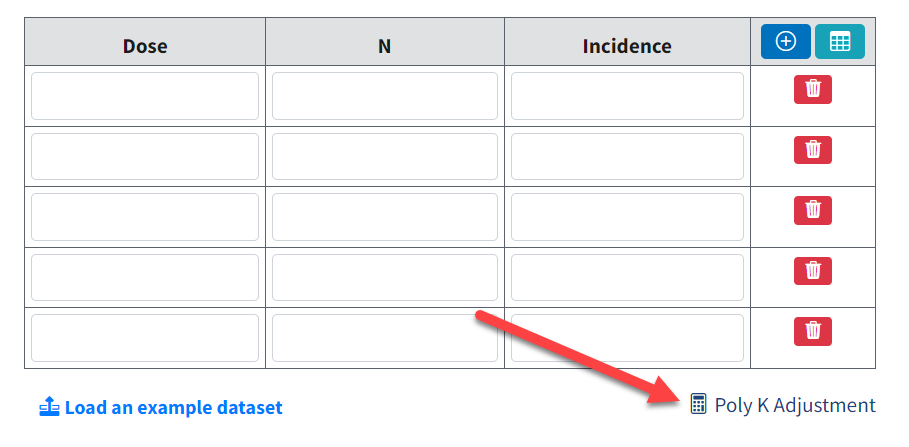
Figure 100. With Multistage Cancer/Multitumor as the model type, BMDS Online displays a Poly K Adjustment link under the data table.
Selecting the link displays the Poly K Adjustment page (Figure 101.), where the user can enter their data and specify settings. Users can copy and paste data from a CSV file or an Excel sheet into the Dataset text box.
Under the Dataset table:
Select the Load link to have BMDS Online load an example dataset, or
Select the download link to download an example dataset formatted specifically for poly-k adjustment; the example dataset can be used as a framework for the user’s data.
The dataset used for poly-k adjustment should have the following columns in this sequence:
Dose. Numeric value of dose group
Day. Numeric value of survival time
Tumor status. Numeric value indicating if animal did not have tumor (0) or did have tumor (1)
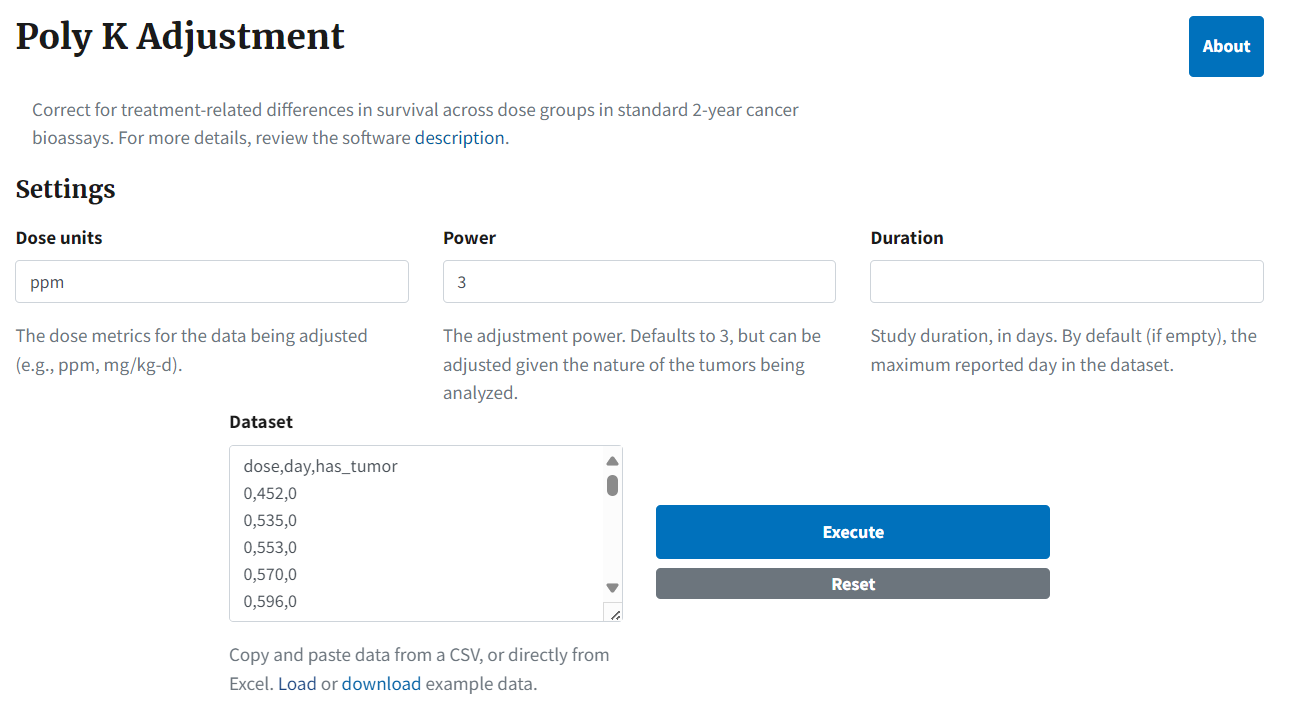
Figure 101. The Poly K Adjustment page, with an example dataset.
Select the About button to display a complete description of the poly-adjustment approach, and the rationale supporting it. The text of the About screen is reproduced in More on the Poly K Adjustment Approach.
The inputs for the Poly K tool are:
Dose units. The dose metrics for the data being adjusted (e.g., ppm, mg/kg-d).
Power. The power to be used for the adjustment. Defaults to 3, but can be adjusted given the nature of the tumors being analyzed.
Duration. The duration of the study in days. By default (if empty), the maximum reported day in the dataset. In Kissling et al.(2008), the authors note that the poly-3 adjustment has not been validated for carcinogenicity studies longer than two years, consistent with the conclusion of the Portier et al. (1986) analysis that acknowledges that “animals used in historical control data base were generally sacrificed if they lived to 109 weeks…. Thus, the application of these models beyond 109 weeks would be speculative.”
Dataset. The dose-response data that will be adjusted, provided in an uploaded CSV file with the following structure:
Dose: numeric value of dose group
Day: numeric value of survival time
Tumor status: numeric value indicating if animal did not have tumor (0) or did have tumor (1)
Select the Execute button to run the analysis. BMDS Online extends the Poly K Adjustment page with the following outputs (Figure 102.):
A summary table of the original and adjusted data
A plot of the adjusted proportions compared to the original proportions
A plot of the tumor incidence over study duration (Plots tab)
A table for the full dataset reporting the original data and the weight that each animal provides to the denominator (Data tab)
The Copy Data for BMDS Modeling link copies the summary table data to the clipboard. From here, the user can return to their Multistage/Multitumor analysis, return to the Data tab, select the Load dataset from Excel button, and paste the clipboard contents to create a new dataset. Or they can paste the clipboard contents into Excel for further analysis.
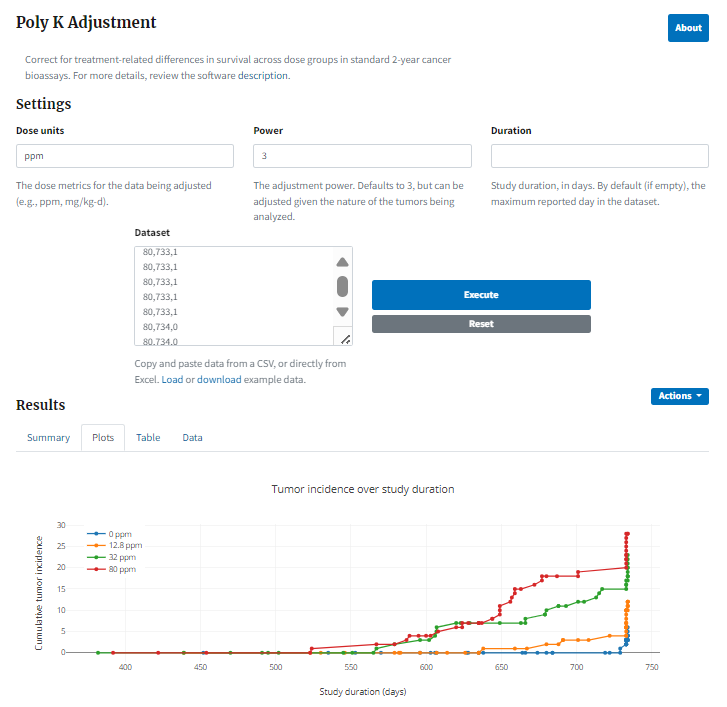
Figure 102. Result of running a Poly K adjustment, with plot of tumor incidence over study duration
More on the Poly K Adjustment Approach
The Poly K adjustment is an approach (based on the poly-k trend test developed by Portier and Bailer (1989) to correct for treatment-related differences in survival across dose-groups in standard 2-year cancer bioassays.
Consider the example provided in Portier and Bailer (1989): there exists a tumor type that does not appear before 90 weeks of age and has 10% incidence, so that the lifetime incidence would be 5 animals in a group of 50. If exposure to a carcinogen increases the lifetime incidence to 30%, 15 animals out of a group of 50 would develop the tumor. But, if exposure to the carcinogen also decreases survival to 60% at 90 weeks, as few as 9 out of the 30 surviving exposed animals would develop a tumor. If this decrease in survival is not taken into account, the incidence used in dose-response modeling would be as low as 9/50.
Thus, by not taking differential survival into account, it is possible to understate a chemical’s true carcinogenic potential when performing dose-response analyses.
Determining the Denominator Contribution for the Poly K Adjustment
Animals in a carcinogenicity experiment can be placed into four bins for the purpose of analysis:
Numerator Contribution: 0
Denominator Contribution: 1
Rationale for Denominator Contribution: Animal observed for an entire lifetime without developing the tumor of interest
Numerator Contribution: 1
Denominator Contribution: 1
Rationale for Denominator Contribution: Animal observed for an entire lifetime and developed the tumor of interest
Numerator Contribution: 1
Denominator Contribution: 1
Rationale for Denominator Contribution: Animal observed for less than a full lifetime but observed for long enough time to develop the tumor of interest
Numerator Contribution: 0
Denominator Contribution: \((\frac{t}{t_{max}})^{k}\), where \(t\) = time of death, \(t_{max}\) =total duration of experiment, and \(k\) = multistage degree
Rationale for Denominator Contribution: Animal may have developed a tumor within a normal lifetime; contribution should account for acceleration of rate with age.
Portier and Bailer (1989) provide a rationale for how to determine the denominator contribution of animals that die early without developing a tumor:
If an animal in a 2-year bioassay dies after one year, this animal can be considered to be at less risk of developing a tumor than animals that lived until the end of the experiment. Thus, this animal should not contribute the same amount of information as animals that survived until the end of the experiment (irrespective of tumor status) or animals that did develop a tumor (irrespective of survival time). In other words, this animal should not be given a weight of 1 (i.e., should not be counted as 1 when determining the denominator). If the risk of developing a tumor is constant throughout a lifetime, this animal should be given a weight of ½. However, if tumor risk accelerates with age, this animal would be at \((½)^{k}\) the risk of developing the tumor compared to animals that survive until the end of the experiment, where k is the exponent for the polynomial function describing the cumulative rate of tumor onset as a function of time. Portier et al. (1986) analyzed the untreated control groups of 47 NTP studies in mice and rats and concluded that a 3rd order polynomial was a reasonable general value of k.
Given the example above, an animal dying at one year would contribute a weight of \((½)^{3}=0.125\). For tumors that are quicker to develop, a lower value of k can be used (such that animals dying early provide more information). Conversely, for slower developing tumors, a higher value of k can be used (such that animals dying early provide less information).
Use of the poly-3 adjustment will result in survival adjusted Ns (frequently non-integer values) that can be used in dose-response analyses.
Option Set
The Multitumor options are the same as for the Dichotomous option sets.
Risk Type
Choices for the Risk Type options are Extra Risk (Default) or Added Risk.
Added risk is the additional proportion of total animals that respond in the presence of the dose, or the predicted probability of response at dose \(d\), \(P(d)\), minus the predicted probability of response in the absence of exposure \(P(0)\),
Extra risk is the added risk divided by the predicted proportion of animals that will not respond in the absence of exposure, \(1\ - \ P(0)\)
BMR
The BMR is the value of risk (extra or added, as specified by the user) for which a BMD is estimated. BMR must be between 0 and 1 (not inclusive). If \(P(0)\ > \ 0\), then values for BMR greater than \(1 - \ P(0)\) will result in an error when the risk type is added risk. That is because the maximum added risk that can ever be achieved is \(1 - \ P(0)\). In practice, this should not typically be an issue because one usually is interested in BMR values in the range of 0.01 to around 0.10.
Confidence Level (one sided)
The Confidence Level is a real number between 0 and 1; 0.95 is recommended by EPA (U.S. EPA, 2012).
Multistage Multitumor Results
The Output tab includes results for each individual tumor considered separately (using the chosen dataset-specific options), and the corresponding estimate of the BMD and BMDL for the combined tumor probability for the risk type, BMR, and confidence levels specified by the user.
The user can select a specific individual model’s results to display its plot and additional results.
If the auto-select feature was used to select the Multistage degree, the user should verify that the model fits are adequate in the desired dose-response region. If the user wants to try a different Multistage degree, they can re-run the analysis using a specified degree instead of auto-select.
For more information, refer to Specific Dichotomous Results.
Cancer Slope Factor
By default, BMDS runs the Multistage model as restricted. This is the EPA standard setup for modeling cancer data.
The Modeling Summary table for the restricted Multistage model includes an estimate of the slope factor, defined by EPA as the linear slope between the extra risk (0.1) at the BMDL(10) and the extra risk (0) at background (generally 0 dose).
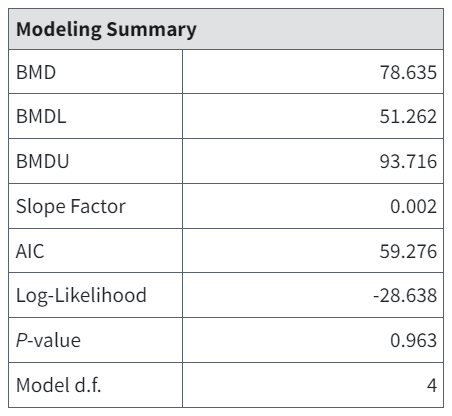
Figure 103. Slope Factor (fourth row in table) appears only on restricted Multistage model results for multistage/multitumor endpoints.
The Multistage model plot also includes a dashed line representing this linear slope.
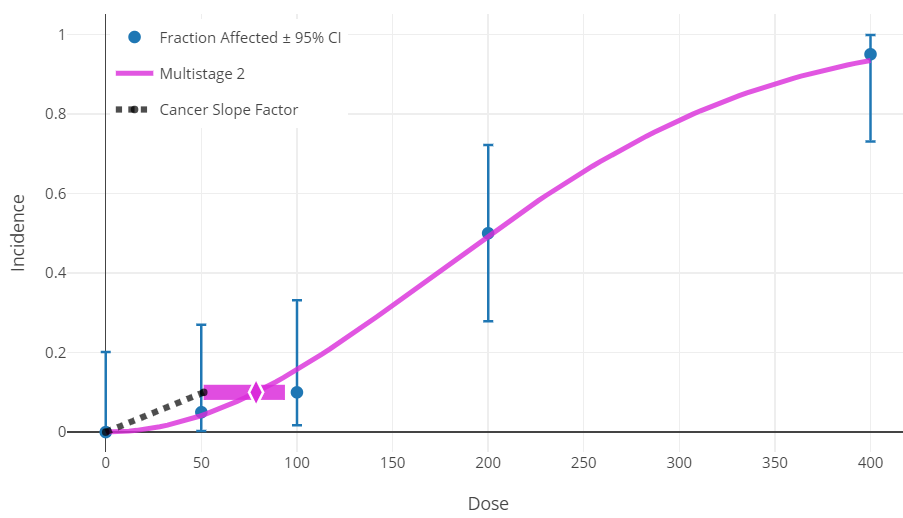
Figure 104. The dashed line for the Multistage model plot representing cancer slope factor.
If dose units are in mg/kg-day, this equals the oral slope factor (OSF) as defined by IRIS. If the dose units are µg/m3, this equals the inhalation unit risk (IUR) as defined by IRIS. For more information, see the IRIS Toxicity Values section of the Basic Information about the Integrated Risk Information System (IRIS) web page.
Troubleshooting a Tumor Analysis
If BMDS estimates one or more of the tumors to have a BMD greater than three times the highest dose tested (for that tumor), then the multiple tumor analysis will stop at an intermediate point, i.e., after the fitting has been done for the tumor in question and the magnitude of that BMD has been determined. No tumors listed below that tumor will be analyzed, and no combination will be completed.
It is probably the case that the tumor in question will not add substantially to the estimation of a BMD for the combinations of tumors, assuming other tumors have BMDs less than three times the highest dose; that is because the magnitude of response for the tumor in question has not even reached the benchmark response level for such a high exposure and so its individual contribution to the risk of getting one or more of the tumors being analyzed will be small in comparison to that for the other tumors. The user might attempt a combination that does not include the tumor in question.