Participatory (Volunteer) Scientists are Monitoring Waters and Sharing Data via EPA's Water Quality eXchange (WQX)
TADA Team
2026-07-08
Source:vignettes/Participatory-Science-Water-Projects-in-WQX.Rmd
Participatory-Science-Water-Projects-in-WQX.RmdInstall and Load the EPATADA R Package
First, install and load the remotes package specifying the repo. This is needed before installing EPATADA because it is only available on GitHub (not CRAN).
install.packages("remotes")
# Load the remotes library
library(remotes)
Next, install and load TADA using the remotes package. TADA R Package dependencies will also be downloaded automatically from CRAN with the TADA install. You may be prompted in the console to update dependency packages that have more recent versions available. If you see this prompt, it is recommended to update all of them (enter 1 into the console).
remotes::install_github("USEPA/EPATADA",
  ref = "develop",
  dependencies = TRUE
)
Finally, use the library() function to load the TADA R Package into your R session.
Find volunteer data in WQX
Let’s explore participatory
science water projects using the Water Quality eXchange (WQX), Water
Quality Portal (WQP), and the EPATADA R Package. To start, let’s find
volunteer monitoring organizations who have submitted data to EPA’s
Water Quality eXchange (WQX) by reviewing the organization
domain table available here.
# Get the WQX organizations domain
organizations <- read.csv(url("https://cdx.epa.gov/wqx/download/DomainValues/Organization.CSV"))

# Subset to include only "Volunteer" organizations and exclude WQX test/training orgs
volunteer_orgs <- subset(
  organizations,
  Type == "Volunteer" &
    !grepl("training",
      Name,
      ignore.case = TRUE
    ) &
    !grepl("test",
      Name,
      ignore.case = TRUE
    ) &
    !grepl("\\*",
      Name,
      ignore.case = TRUE
    )
)

unique(volunteer_orgs$Name)
Generate a list of 5 random organization IDs:
random_volunteer_orgIDs <- sample(volunteer_orgs$ID, size = 5)Prepare list for use in TADA_DataRetrieval:
unlist(random_volunteer_orgIDs)Query the Water Quality Portal (WQP) using
TADA_DataRetrieval and the 5 random volunteer organizations
IDs. We will look for any data available from 2015 to present.
volunteer_data <- TADA_DataRetrieval(
  startDate = "2015-01-01",
  organization = random_volunteer_orgIDs,
  ask = FALSE,
  applyautoclean = TRUE
)
Retrieve data from WQP
Alternatively, choose 5 volunteer monitoring organizations and query WQP. We will move forward with this example of volunteer organizations in CT:
selected_orgs <-
  c(
    "CONNRIVERCONSERVANCY",
    "CT_NERR",
    "BANTAMLAKE_WQX",
    "CTVOLMON",
    "CT_NERR"
  )

volunteer_data <- EPATADA::TADA_DataRetrieval(
  organization = selected_orgs,
  ask = FALSE,
  applyautoclean = TRUE
)
utils::data("Data_Participatory_Scientists", package = "EPATADA")

volunteer_data <- Data_Participatory_Scientists
Explore and refine results
Review volunteer monitoring projects in WQX:
unique(volunteer_data$ProjectName)## [1] "Riffle Bioassessment by Volunteers Program"
## [2] "Volunteer Stream Temperature Monitoring Network"
## [3] "CRC and Affiliate Monitoring"
## [4] "Connecticut Lake Watch"
## [5] "CRC Cyanobacteria 2025"
## [6] "Ecoli2025"
## [7] "CT NERR Pathogen Monitoring"
## [8] "CRC 2019 Bacteria Monitoring"
## [9] "Chicopee Four Rivers Watershed Council 2019"
## [10] "Deerfield River Watershed Association 2019"
## [11] "Connecticut River Conservancy/Connecticut River Watershed Council 2012-2018"
## [12] "2019 Anguilla Brook Watershed Bacteria Source Trackdown"
## [13] "2012 Flat Brook Trackdown Survey"
## [14] "Connecticut River Conservancy 2020"
## [15] "Fort River Watershed Asssociation 2020"
## [16] "Deerfield River Watershed Association 2020"
## [17] "Chicopee 4River Watershed Council 2020"
## [18] "Pomperaug River Watershed Based Plan Implementation Groundwork: Additional Water Quality Monitoring, Agricultural Outreach, BMP Implementation Design and Landowner Agreements to Address Bacteria Impairments. EPA RFA No. 21059"
## [19] "Still River Watershed Pollution Trackdown Survey. CTDEEP Contract No. 17-06"
## [20] "Connecticut River Conservancy 2021"
## [21] "Chicopee 4 Rivers Watershed Council 2021"
## [22] "Deerfield River Watershed Association 2021"
## [23] "Connecticut River Conservancy 2022"
## [24] "Deerfield River Watershed Association 2022"
## [25] "Chicopee 4 Rivers Watershed Council 2022"
## [26] "Clean Up Sound & Harbors (CUSH) volunteer water monitoring program"
## [27] "CT Harbor Watch water monitoring program"Generate pie chart:
EPATADA::TADA_FieldValuesPie(volunteer_data, field = "MonitoringLocationTypeName")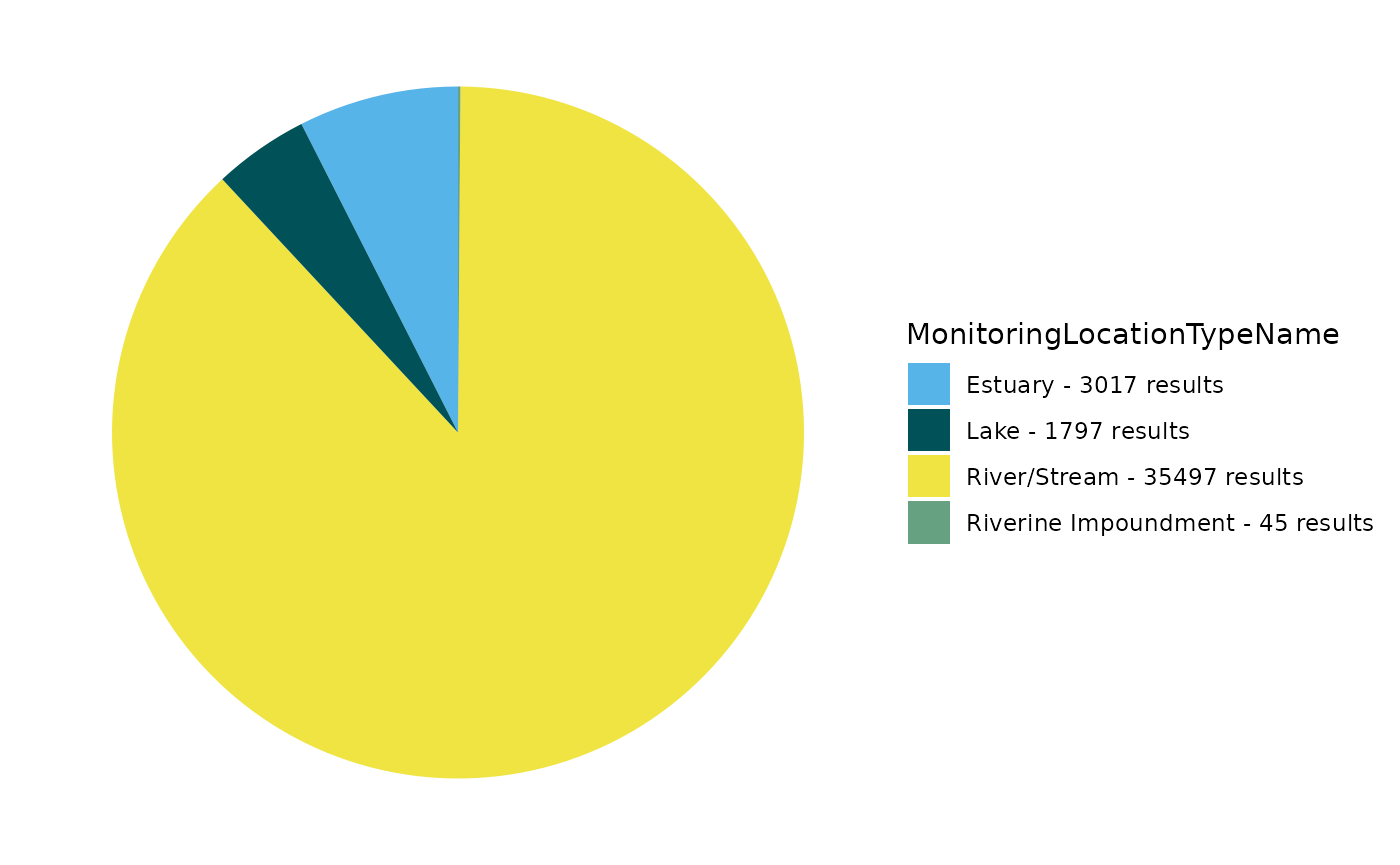
Review and remove sites if coordinates are imprecise or outside US:
volunteer_data <- EPATADA::TADA_FlagCoordinates(volunteer_data,
  clean_outsideUSA = "remove",
  clean_imprecise = TRUE,
  flaggedonly = FALSE
)
Use TADA_OverviewMap to generate a map:
EPATADA::TADA_OverviewMap(volunteer_data)Review and remove duplicate results if present:
volunteer_data <- EPATADA::TADA_FindPotentialDuplicatesSingleOrg(volunteer_data)## TADA_FindPotentialDuplicatesSingleOrg: 355 groups of potentially duplicated results found in dataset. These have been placed into duplicate groups in the TADA.SingleOrgDupGroupID column and the function randomly selected one result from each group to represent a single, unduplicated value. Selected values are indicated in the TADA.SingleOrgDup.Flag as 'Unique', while duplicates are flagged as 'Duplicate' for easy filtering.
volunteer_data <- dplyr::filter(volunteer_data, TADA.SingleOrgDup.Flag == "Unique")Prepare censored (nondetects and overdetects) results for analysis:
volunteer_data <- EPATADA::TADA_SimpleCensoredMethods(
  volunteer_data,
  nd_method = "multiplier",
  nd_multiplier = 0.5,
  od_method = "as-is",
  od_multiplier = "null"
)
## TADA_IDCensoredData: No censored data detected in your dataframe. Returning input dataframe with new column TADA.CensoredData.Flag set to Uncensored## Cannot apply simple censored methods to dataframe with no censored data results. Returning input dataframe.Run key TADA quality control flagging functions and remove suspect results:
volunteer_data <- EPATADA::TADA_RunKeyFlagFunctions(
  volunteer_data,
  clean = TRUE
)
## TADA_FindQCActivities: Quality control samples have been removed or were not present in the input dataframe. Returning dataframe with TADA.ActivityType.Flag column for tracking.Flag results above and below thresholds. Review carefully and consider removing.
volunteer_data <- EPATADA::TADA_FlagAboveThreshold(volunteer_data,
  clean = FALSE,
  flaggedonly = FALSE
)
## TADA_FlagAboveThreshold: Returning the dataframe with flags. Counts: NA - Not Available: 3156, Pass: 34741, Suspect: 1830
volunteer_data <- EPATADA::TADA_FlagBelowThreshold(volunteer_data,
  clean = FALSE,
  flaggedonly = FALSE
)
## TADA_FlagBelowThreshold: No data below the WQX Lower Threshold was found in your dataframe. Returning the input dataframe with TADA.ResultValueBelowLowerThreshold.Flag column for tracking. Counts: NA - Not Available: 3156, Pass: 36571Harmonize synonyms if found:
volunteer_data <- EPATADA::TADA_HarmonizeSynonyms(volunteer_data)Generate table:
EPATADA::TADA_FieldValuesTable(volunteer_data, field = "ActivityTypeCode")## Value Count
## 1 Sample-Routine 35883
## 2 Field Msr/Obs 3844Generate pie chart:
EPATADA::TADA_FieldValuesPie(volunteer_data, field = "OrganizationFormalName")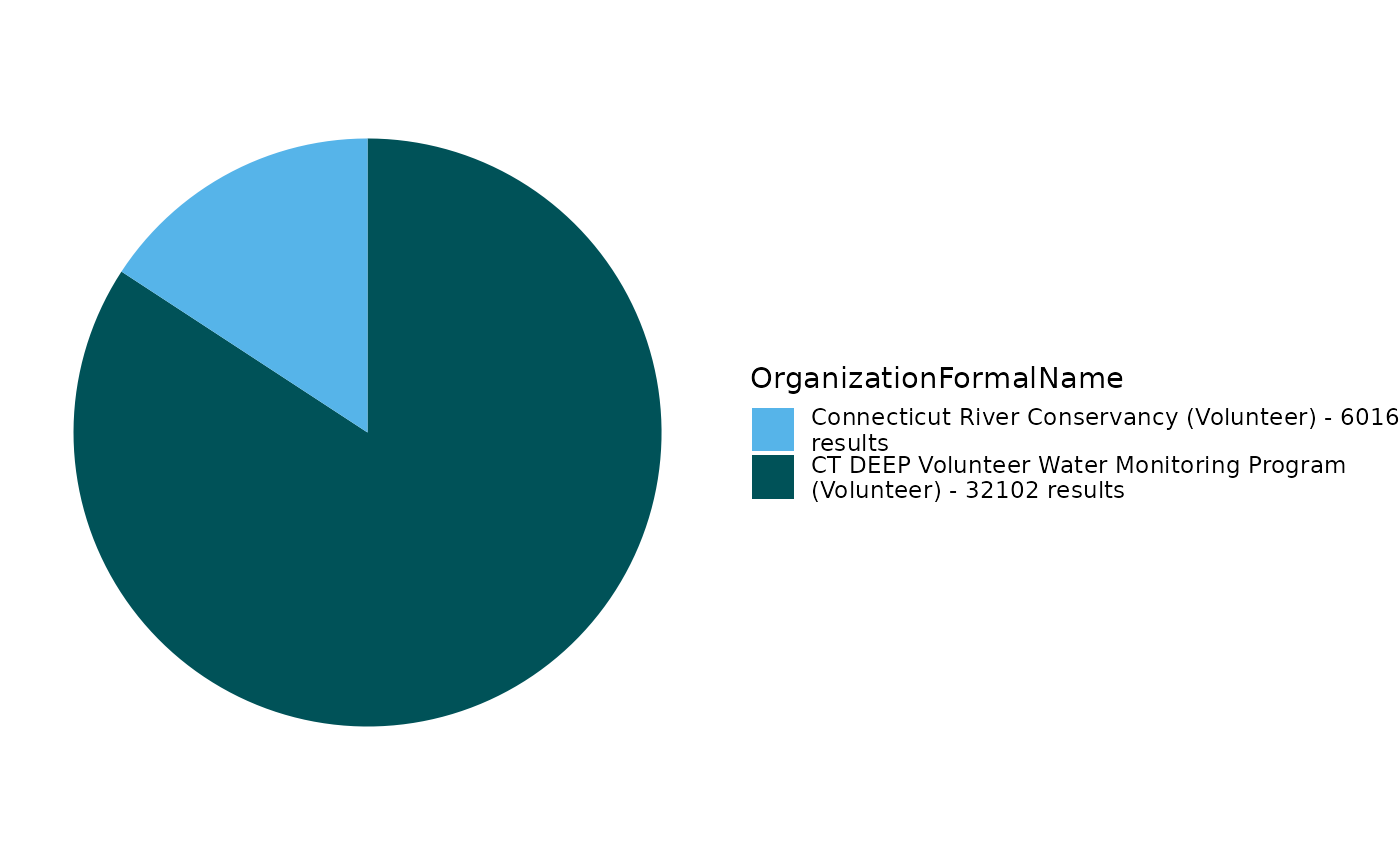
Generate pie chart:
EPATADA::TADA_FieldValuesPie(volunteer_data, field = "MonitoringLocationName")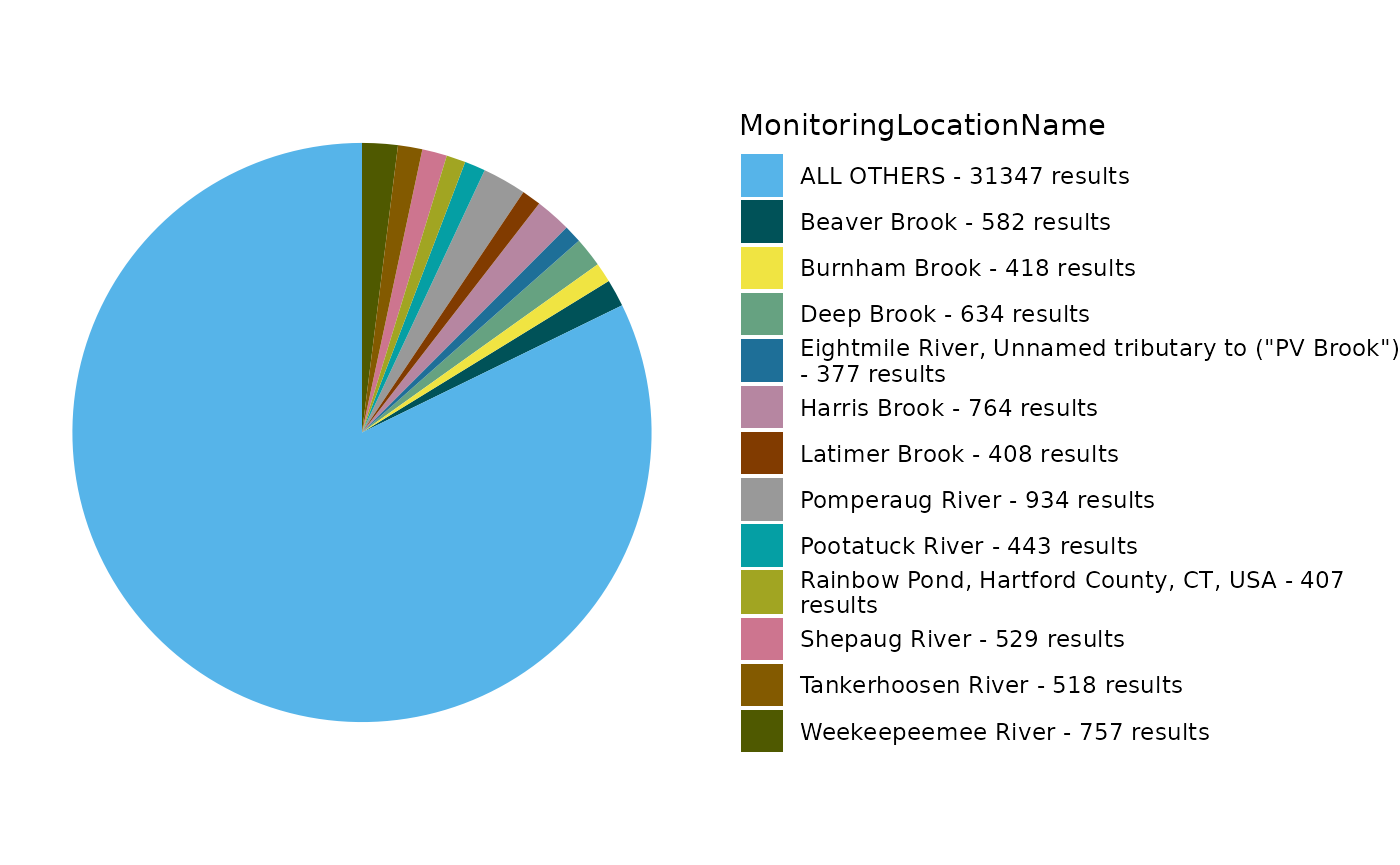
Remove non-numeric results:
volunteer_data <- EPATADA::TADA_ConvertSpecialChars(
  volunteer_data,
  col = "TADA.ResultMeasureValue",
  clean = TRUE
)
Review the number of sites and records for each characteristic:
EPATADA::TADA_SummarizeColumn(volunteer_data)## # A tibble: 21 × 3
## TADA.CharacteristicName n_sites n_records
## <chr> <int> <int>
## 1 AMMONIA 15 244
## 2 CHLOROPHYLL A 4 144
## 3 CONDUCTANCE 15 149
## 4 COUNT 808 23121
## 5 DEPTH, SECCHI DISK DEPTH 47 616
## 6 DISSOLVED OXYGEN (DO) 15 589
## 7 ENTEROCOCCUS 35 444
## 8 ESCHERICHIA COLI 440 9478
## 9 INORGANIC NITROGEN (NO2, NO3, & NH3) 15 269
## 10 NITRATE 30 303
## # ℹ 11 more rowsFilter data to review a single characteristic:
ecoli <- dplyr::filter(
  volunteer_data,
  TADA.ComparableDataIdentifier %in% c(
    "ESCHERICHIA COLI_NONE_NONE_CFU/100ML"
  )
)
Generate scatter plot for E. coli:
EPATADA::TADA_GroupedScatterplot(ecoli)## TADA_GroupedScatterplot: No 'groups' selected for MonitoringLocationName. There are 396 MonitoringLocationNames in the TADA dataframe. The top four MonitoringLocationNames by number of results will be plotted: Sunderland Boat Ramp; CT River at Barton Cove Boat Ramp (now MA-CTR_122.5); DCR/UMASS boat dock and Oxbow/Easthampton Boat Ramp.Filter to a single site and continue exploring E. coli:
ecoli <- dplyr::filter(
  ecoli,
  TADA.MonitoringLocationIdentifier %in% c(
    "CONNRIVERCONSERVANCY-WILLIAMS_.92"
  )
)
Let’s check if any results are above the EPA 304A recommended maximum criteria magnitude (see: 2012 Recreational Water Quality Criteria Fact Sheet).
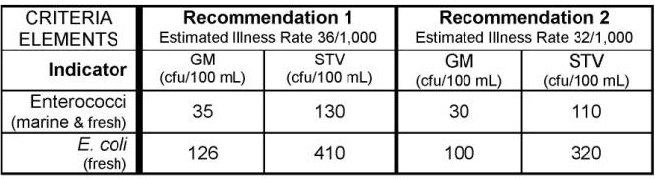
If interested, you can find other state, tribal, and EPA 304A criteria in EPA’s Criteria Search Tool.
Let’s check if any individual results exceed 320 CFU/100mL (the magnitude component of the EPA recommendation 2 criteria for ESCHERICHIA COLI).
# add column with comparison to criteria mag (excursions)
ecoli <- ecoli |>
  dplyr::mutate(meets_criteria_mag = ifelse(TADA.ResultMeasureValue <= 320, "Yes", "No"))

# review subset
ecoli_subset_review <- ecoli |>
  dplyr::select(
    MonitoringLocationIdentifier, OrganizationFormalName, ActivityStartDate, TADA.ResultMeasureValue,
    meets_criteria_mag
  )

EPATADA::TADA_TableExport(ecoli_subset_review)
Generate stats table. Review percentiles. Less than 5% of results fall above ~19 CFU/100mL and over 98% of results fall below ~2185 CFU/100m
EPATADA::TADA_TableExport(EPATADA::TADA_Stats(ecoli))Generate a scatterplot. One result value is above the threshold.
EPATADA::TADA_Scatterplot(ecoli, id_cols = "TADA.ComparableDataIdentifier") |>
  plotly::add_lines(
    y = 320,
    x = c(min(ecoli$ActivityStartDate), max(ecoli$ActivityStartDate)),
    inherit = FALSE,
    showlegend = FALSE,
    line = list(color = "red"),
    hoverinfo = "none"
  )
Generate a histogram.
EPATADA::TADA_Histogram(ecoli, id_cols = "TADA.ComparableDataIdentifier")TADA_Boxplot can be useful for identifying skewness and
percentiles.
EPATADA::TADA_Boxplot(ecoli, id_cols = "TADA.ComparableDataIdentifier")Check out other example R workflows designed to work with WQP data under the Articles tab on the EPATADA package website.